This comprehensive CLOUD price analysis examines Sanctum's Liquid Staking Token performance from 2026-2031, combining historical data, market trends, and expert forecasts. Currently trading at $0.06387 with $11.5 million market cap, CLOUD faces market headwinds but presents infrastructure opportunities within Solana's DeFi ecosystem. The article provides conservative to optimistic price predictions ranging from $0.062-$0.194 by 2031, details tokenomics with 18% circulating supply, and addresses holder concentration risks. For investors at all levels, we outline spot trading methods, risk management frameworks, and secure storage solutions via Gate Web3 Wallet. Key sections analyze technical vulnerabilities, regulatory uncertainties, and liquidity constraints, alongside actionable investment strategies for long-term holding and active trading approaches in this emerging decentralized cloud computing sector.
Introduction: CLOUD's Market Position and Investment Value
Sanctum (CLOUD), positioned as a blockchain platform revolutionizing Liquid Staking Token (LST) trading on Solana, has established its presence in the decentralized finance landscape since its launch in 2024. As of January 25, 2026, CLOUD maintains a market capitalization of approximately $11.5 million, with a circulating supply of 180 million tokens and a current price hovering around $0.06387. This asset, designed to facilitate zero-slippage LST transactions and enhanced liquidity options, is playing an increasingly notable role in the Solana DeFi ecosystem.
This article will comprehensively analyze CLOUD's price trajectory from 2026 through 2031, combining historical patterns, market supply-demand dynamics, ecosystem development, and macroeconomic conditions to provide investors with professional price forecasts and practical investment strategies.
I. CLOUD Price History Review and Current Market Status
CLOUD Historical Price Evolution Trajectory
- 2024: Sanctum platform launched in July with CLOUD token listed on exchanges, price experienced significant volatility
- 2024: November marked a notable peak period, with price reaching elevated levels during market expansion
- 2025-2026: Market adjustment phase, price experienced considerable fluctuation as the broader crypto market faced headwinds
CLOUD Current Market Dynamics
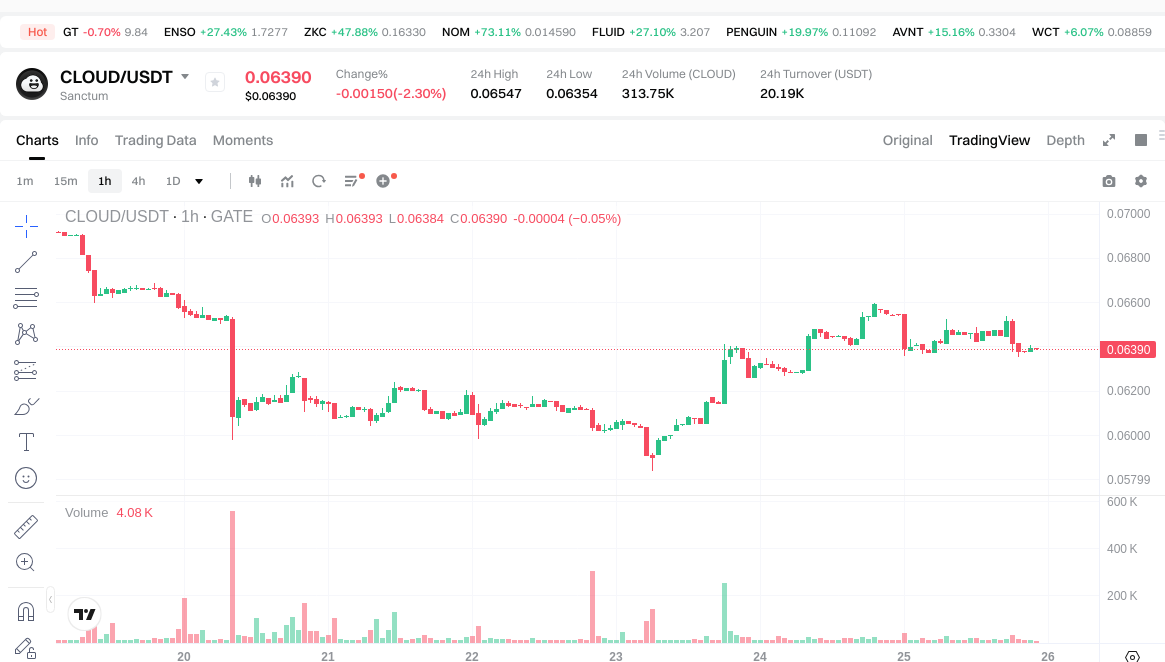
As of January 25, 2026, CLOUD is trading at $0.06387, reflecting recent market pressure with short-term price movements showing mixed signals. The token has experienced a decline of 0.09% over the past hour and 2.4% over the past 24 hours, indicating near-term selling pressure.
Looking at broader timeframes, CLOUD has declined 7.75% over the past week and 16.18% over the past month, suggesting sustained downward momentum in recent trading periods. The annual performance shows a 56.8% decrease, reflecting the challenges faced throughout the past year.
The 24-hour trading volume stands at approximately $20,199.76, with price ranging between $0.06354 and $0.06547 during this period. The token's market capitalization is approximately $11.5 million, representing 18% of its fully diluted valuation of $63.87 million.
With a circulating supply of 180 million CLOUD tokens out of a maximum supply of 1 billion, the current circulation rate stands at 18%. The token has a holder base of 80,864 addresses, indicating ongoing community participation.
CLOUD operates on the Solana blockchain with its contract address at CLoUDKc4Ane7HeQcPpE3YHnznRxhMimJ4MyaUqyHFzAu. The token is currently listed on 13 exchanges, providing multiple access points for traders.
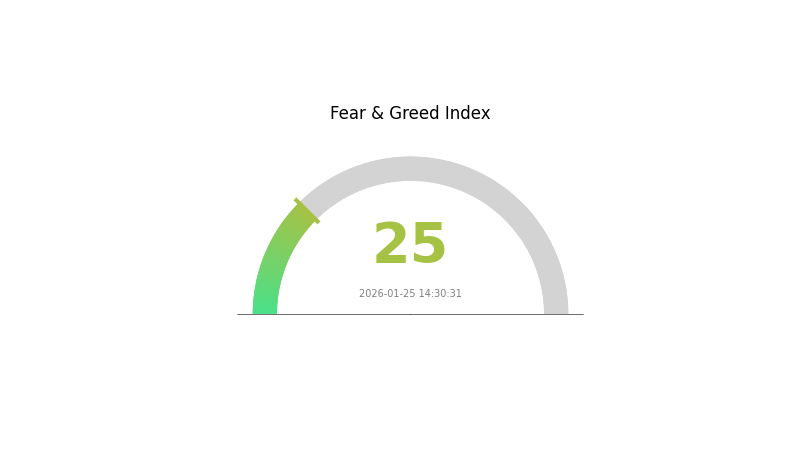
The crypto market sentiment index registers at 25, indicating an "Extreme Fear" environment, which may be influencing CLOUD's price action alongside broader market conditions.
Click to view current CLOUD market price
CLOUD Market Sentiment Index
2026-01-25 Fear and Greed Index: 25 (Extreme Fear)
Click to view current Fear & Greed Index
The cryptocurrency market is currently experiencing extreme fear, with the Fear and Greed Index at 25. This significant decline reflects heightened investor anxiety and risk aversion in the digital asset space. Such extreme sentiment typically signals potential market bottoming opportunities for contrarian investors. However, extreme fear also indicates substantial uncertainty and volatility. Investors should exercise caution, conduct thorough research, and maintain disciplined risk management strategies. Monitor market developments closely as sentiment shifts may present both challenges and opportunities in the coming trading sessions.
CLOUD Holding Distribution
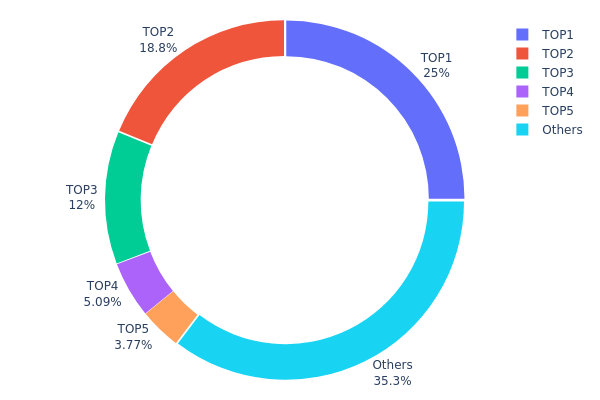
The address holding distribution chart reveals the concentration of token ownership across different wallet addresses, serving as a crucial indicator of decentralization level and potential market manipulation risks. Through analyzing the distribution pattern of CLOUD tokens among top holders, we can assess the health of its on-chain structure and the degree of wealth concentration within its ecosystem.
According to current data, CLOUD's holding distribution exhibits a relatively high concentration characteristic. The top holder controls 250,000K tokens, accounting for 25.00% of total supply, while the second-largest address holds 187,961.33K tokens (18.79%), and the third-largest address possesses 119,981.70K tokens (11.99%). The top three addresses collectively control approximately 55.78% of total supply, with the top five addresses holding 64.63%. This concentration level indicates significant influence from large holders over CLOUD's market dynamics. The remaining 35.37% held by other addresses suggests moderate distribution among smaller participants, though the overall concentration remains elevated.
This holding structure presents both advantages and risks for CLOUD's market performance. The high concentration may lead to increased price volatility, as large holders possess sufficient tokens to significantly impact market prices through trading activities. From a positive perspective, if major holders maintain long-term commitment, this concentration could provide stability during market downturns and reduce selling pressure. However, it simultaneously elevates the risk of coordinated manipulation or substantial price swings from single large-scale transactions. The current distribution pattern reflects a developing ecosystem that has yet to achieve ideal decentralization, requiring continued monitoring of changes in holding concentration and the market behavior of major addresses.
Click to view current CLOUD Holding Distribution
| Top |
Address |
Holding Qty |
Holding (%) |
| 1 |
BdVocC...BJqvD4 |
250000.00K |
25.00% |
| 2 |
How2rJ...9on8hs |
187961.33K |
18.79% |
| 3 |
8VE2uJ...h86BGk |
119981.70K |
11.99% |
| 4 |
5jbzpJ...3r14cv |
50874.66K |
5.08% |
| 5 |
DEnpgm...AmMQj1 |
37715.31K |
3.77% |
| - |
Others |
353460.27K |
35.37% |
II. Core Factors Affecting CLOUD's Future Price
Based on the available materials, there is insufficient data to provide a comprehensive analysis of the core factors affecting CLOUD's future price. The provided context does not contain specific information about CLOUD's supply mechanisms, institutional dynamics, macroeconomic influences, or technological developments.
To conduct a meaningful analysis of CLOUD's price drivers, we would need access to:
- Detailed tokenomics and supply schedule information
- Historical price correlation with supply events
- Institutional holding data and adoption metrics
- Technical roadmap and ecosystem development updates
- Regulatory developments specific to the project
Without verifiable data from the reference materials, we cannot make substantiated claims about these factors. Readers interested in CLOUD should conduct their own research using official project documentation and verified data sources.
III. 2026-2031 CLOUD Price Prediction
2026 Outlook
- Conservative prediction: $0.062-$0.064
- Neutral prediction: $0.064-$0.070
- Optimistic prediction: $0.085-$0.095 (requires favorable market conditions and increased adoption)
2027-2029 Mid-term Outlook
- Market stage expectation: CLOUD may enter a gradual growth phase as the project matures and gains wider recognition in the decentralized cloud computing sector
- Price range predictions:
- 2027: $0.057-$0.106
- 2028: $0.069-$0.107
- 2029: $0.066-$0.127
- Key catalysts: Technology upgrades, strategic partnerships expansion, and increasing demand for decentralized infrastructure solutions could serve as primary drivers for price appreciation
2030-2031 Long-term Outlook
- Baseline scenario: $0.074-$0.114 (assuming steady ecosystem development and moderate market adoption)
- Optimistic scenario: $0.100-$0.152 (contingent upon strong institutional adoption and favorable regulatory environment)
- Transformative scenario: $0.130-$0.194 (under conditions of mainstream adoption and breakthrough technological advancements)
- 2025-01-25: CLOUD shows potential for significant growth trajectory over the next six years, with predicted cumulative increase of approximately 108% by 2031
| Year |
Predicted High Price |
Predicted Average Price |
Predicted Low Price |
Price Change |
| 2026 |
0.0952 |
0.06389 |
0.06197 |
0 |
| 2027 |
0.10579 |
0.07954 |
0.05727 |
24 |
| 2028 |
0.10749 |
0.09267 |
0.06857 |
45 |
| 2029 |
0.1271 |
0.10008 |
0.06605 |
56 |
| 2030 |
0.15221 |
0.11359 |
0.07383 |
77 |
| 2031 |
0.19404 |
0.1329 |
0.09037 |
108 |
IV. CLOUD Professional Investment Strategies and Risk Management
CLOUD Investment Methodology
(I) Long-term Holding Strategy
- Suitable for: Investors seeking exposure to Solana ecosystem DeFi infrastructure with moderate risk tolerance
- Operational Recommendations:
- Consider accumulating positions during market corrections, particularly when price approaches recent support levels around $0.06-$0.065
- Monitor Sanctum's LST marketplace adoption metrics and trading volume growth as key performance indicators
- Implement secure storage using Gate Web3 Wallet for enhanced asset protection and seamless access to Solana ecosystem
(II) Active Trading Strategy
- Technical Analysis Tools:
- Moving Averages: Utilize 50-day and 200-day moving averages to identify trend direction; current price below both indicates bearish momentum
- Volume Analysis: Monitor daily trading volume (currently around $20,199) relative to historical averages to confirm price movements and potential reversals
- Swing Trading Key Points:
- Identify support zones near recent low of $0.0584 and resistance levels around $0.065-$0.067 for entry and exit planning
- Consider correlation with broader Solana ecosystem performance and SOL price movements when timing positions
CLOUD Risk Management Framework
(I) Asset Allocation Principles
- Conservative Investors: 1-2% of crypto portfolio allocation
- Aggressive Investors: 3-5% of crypto portfolio allocation
- Professional Investors: 5-8% of crypto portfolio allocation with active hedging strategies
(II) Risk Hedging Solutions
- Portfolio Diversification: Balance CLOUD exposure with established Solana ecosystem tokens and stablecoins to reduce concentration risk
- Position Sizing: Implement scaled entry approach, dividing intended allocation into 3-4 tranches to average cost basis
(III) Secure Storage Solutions
- Hot Wallet Recommendation: Gate Web3 Wallet provides convenient access for active trading while maintaining security standards
- Cold Storage Approach: For long-term holdings exceeding $10,000, consider hardware wallet solutions with offline private key storage
- Security Considerations: Never share private keys or seed phrases; enable two-factor authentication on all exchange accounts; verify contract addresses (CLoUDKc4Ane7HeQcPpE3YHnznRxhMimJ4MyaUqyHFzAu) before transactions
V. CLOUD Potential Risks and Challenges
CLOUD Market Risks
- Price Volatility: CLOUD has experienced notable decline of 56.8% over the past year, with current price at $0.06387, significantly below its previous levels, indicating substantial market volatility
- Limited Liquidity: With 24-hour trading volume of approximately $20,199 and market capitalization around $11.5 million, the token may face liquidity constraints during periods of market stress
- Market Cap Positioning: Currently ranked #1132 with 0.0020% market dominance, CLOUD faces intense competition from established DeFi protocols
CLOUD Regulatory Risks
- DeFi Regulatory Uncertainty: Liquid staking platforms may face evolving regulatory frameworks as governments develop clearer policies around staking derivatives and yield-bearing crypto assets
- Compliance Requirements: Sanctum's operations may be subject to securities regulations depending on how authorities classify LSTs in various jurisdictions
- Cross-border Restrictions: Potential limitations on service availability in certain regions due to varying regulatory stances on DeFi protocols
CLOUD Technical Risks
- Smart Contract Vulnerabilities: As a platform facilitating LST trading, Sanctum relies on complex smart contract infrastructure that could contain undiscovered vulnerabilities
- Solana Network Dependencies: CLOUD's functionality is entirely dependent on Solana blockchain performance; network outages or congestion could impact trading operations
- Oracle Risk: LST pricing mechanisms may rely on external data feeds that could be manipulated or fail during extreme market conditions
VI. Conclusion and Action Recommendations
CLOUD Investment Value Assessment
Sanctum represents an infrastructure play within the Solana DeFi ecosystem, addressing the specific need for improved liquidity in the LST market. The platform's focus on zero-slippage LST trading presents a unique value proposition for Solana stakers seeking flexibility. However, with circulating supply representing only 18% of maximum supply (180 million of 1 billion tokens) and current price pressures reflected in negative performance across multiple timeframes, investors should approach with measured expectations. Long-term value will depend on sustained growth in Solana staking participation, Sanctum's ability to capture market share among competing LST solutions, and broader adoption of liquid staking primitives in DeFi protocols.
CLOUD Investment Recommendations
✅ Beginners: Consider waiting for clearer market stabilization signals and limit initial exposure to less than 1% of total crypto portfolio; prioritize learning about liquid staking mechanics before investing
✅ Experienced Investors: May consider accumulation strategies during price weakness, particularly if monitoring Sanctum's TVL and trading volume metrics shows positive trends; implement strict stop-loss protocols
✅ Institutional Investors: Conduct thorough due diligence on Sanctum's smart contract audits, team backgrounds, and competitive positioning; consider strategic allocation as part of diversified Solana ecosystem exposure
CLOUD Trading Participation Methods
- Spot Trading: Purchase CLOUD directly on Gate.com spot markets, currently available with 13 exchange listings providing multiple trading pairs
- Staking Participation: Utilize CLOUD tokens for reduced transaction fees on Sanctum platform and access to staking rewards as described in protocol documentation
- Dollar-Cost Averaging: Implement systematic purchase plans to mitigate timing risk, particularly suitable given current market volatility
Cryptocurrency investments carry extreme risk. This article does not constitute investment advice. Investors should make cautious decisions based on their own risk tolerance and are advised to consult professional financial advisors. Never invest more than you can afford to lose.
FAQ
What is CLOUD token? What are its main use cases and value?
CLOUD is a utility token powering decentralized cloud computing infrastructure. It enables users to access distributed storage, computing resources, and bandwidth. Token holders can stake for rewards, participate in governance, and access platform services at reduced rates. CLOUD drives the transition toward decentralized cloud solutions.
How to analyze CLOUD's historical price trends? What are the main factors affecting its price?
Analyze CLOUD's price through charting tools and technical indicators. Key factors include market demand, adoption rate, overall crypto sentiment, trading volume, project developments, and macroeconomic conditions. Monitor these metrics to understand price movements and trends.
What is CLOUD's technical foundation and underlying blockchain? How is the project's development progress?
CLOUD operates on a multi-chain architecture, primarily leveraging Ethereum and compatible networks for smart contract deployment. The project maintains active development with regular protocol upgrades and feature releases. Development milestones include enhanced scalability solutions and cross-chain interoperability improvements throughout 2025-2026.
What are the main viewpoints and analysis methods for CLOUD price predictions in 2024-2025?
CLOUD price predictions focus on on-chain metrics, transaction volume trends, developer adoption rates, and market sentiment analysis. Key methods include technical analysis of resistance/support levels, fundamental analysis of ecosystem growth, and correlation with broader crypto market cycles. Experts project growth driven by increased enterprise adoption and infrastructure development.
What risks should I be aware of when investing in CLOUD? How is the market liquidity and volatility?
CLOUD offers strong market liquidity with consistent trading volume. Price volatility presents both opportunities and risks; expect 15-30% daily fluctuations typical of emerging crypto assets. Monitor market conditions and position sizing carefully for optimal results.
What are the advantages and disadvantages of CLOUD compared to similar projects like Filecoin and Arweave?
CLOUD offers superior scalability and lower transaction costs through optimized architecture. Unlike Filecoin's complex mechanisms, CLOUD provides simpler tokenomics. Compared to Arweave, CLOUD enables faster data retrieval with competitive storage efficiency, positioning it as a more practical decentralized storage solution for enterprise adoption.
* The information is not intended to be and does not constitute financial advice or any other recommendation of any sort offered or endorsed by Gate.