This comprehensive analysis examines COMMON token's price trajectory from 2026 through 2031, providing expert forecasts for this AI-native tokenized community platform serving 3.8 million users. The article evaluates COMMON's current market position at $0.001536, analyzing historical patterns and supply-demand dynamics to project potential price movements. Key sections address core factors influencing valuations, including macroeconomic conditions and ecosystem development, while offering professional investment strategies encompassing long-term holdings and active trading approaches. The analysis presents differentiated forecasts across conservative, neutral, and optimistic scenarios, with 2031 potentially delivering 72% gains from 2026 baseline levels. Comprehensive risk management frameworks, regulatory considerations, and security recommendations guide investors of varying sophistication levels. Practical guidance on portfolio allocation and trading participation methods on Gate and alternative platforms
Introduction: COMMON's Market Position and Investment Value
Common Protocol (COMMON) serves as an AI-native workspace platform that tokenizes communities, projects, and threads, enabling 3.8 million users across 50,000+ communities to conduct research, trade, and monetize ideas through integrated AI agents. Since its launch in October 2025, COMMON has established itself within the emerging AI-infrastructure ecosystem. As of January 30, 2026, COMMON maintains a market capitalization of approximately $3.81 million, with a circulating supply of around 2.48 billion tokens and a current price near $0.001536. This asset, positioned at the intersection of decentralized collaboration and AI integration, is gaining traction in tokenized community engagement and bounty-based development workflows.
This article provides a comprehensive analysis of COMMON's price trajectory from 2026 through 2031, examining historical patterns, market supply-demand dynamics, ecosystem development milestones, and macroeconomic factors to deliver professional price forecasts and actionable investment strategies for investors.
I. COMMON Price History Review and Market Status
COMMON Historical Price Evolution Trajectory
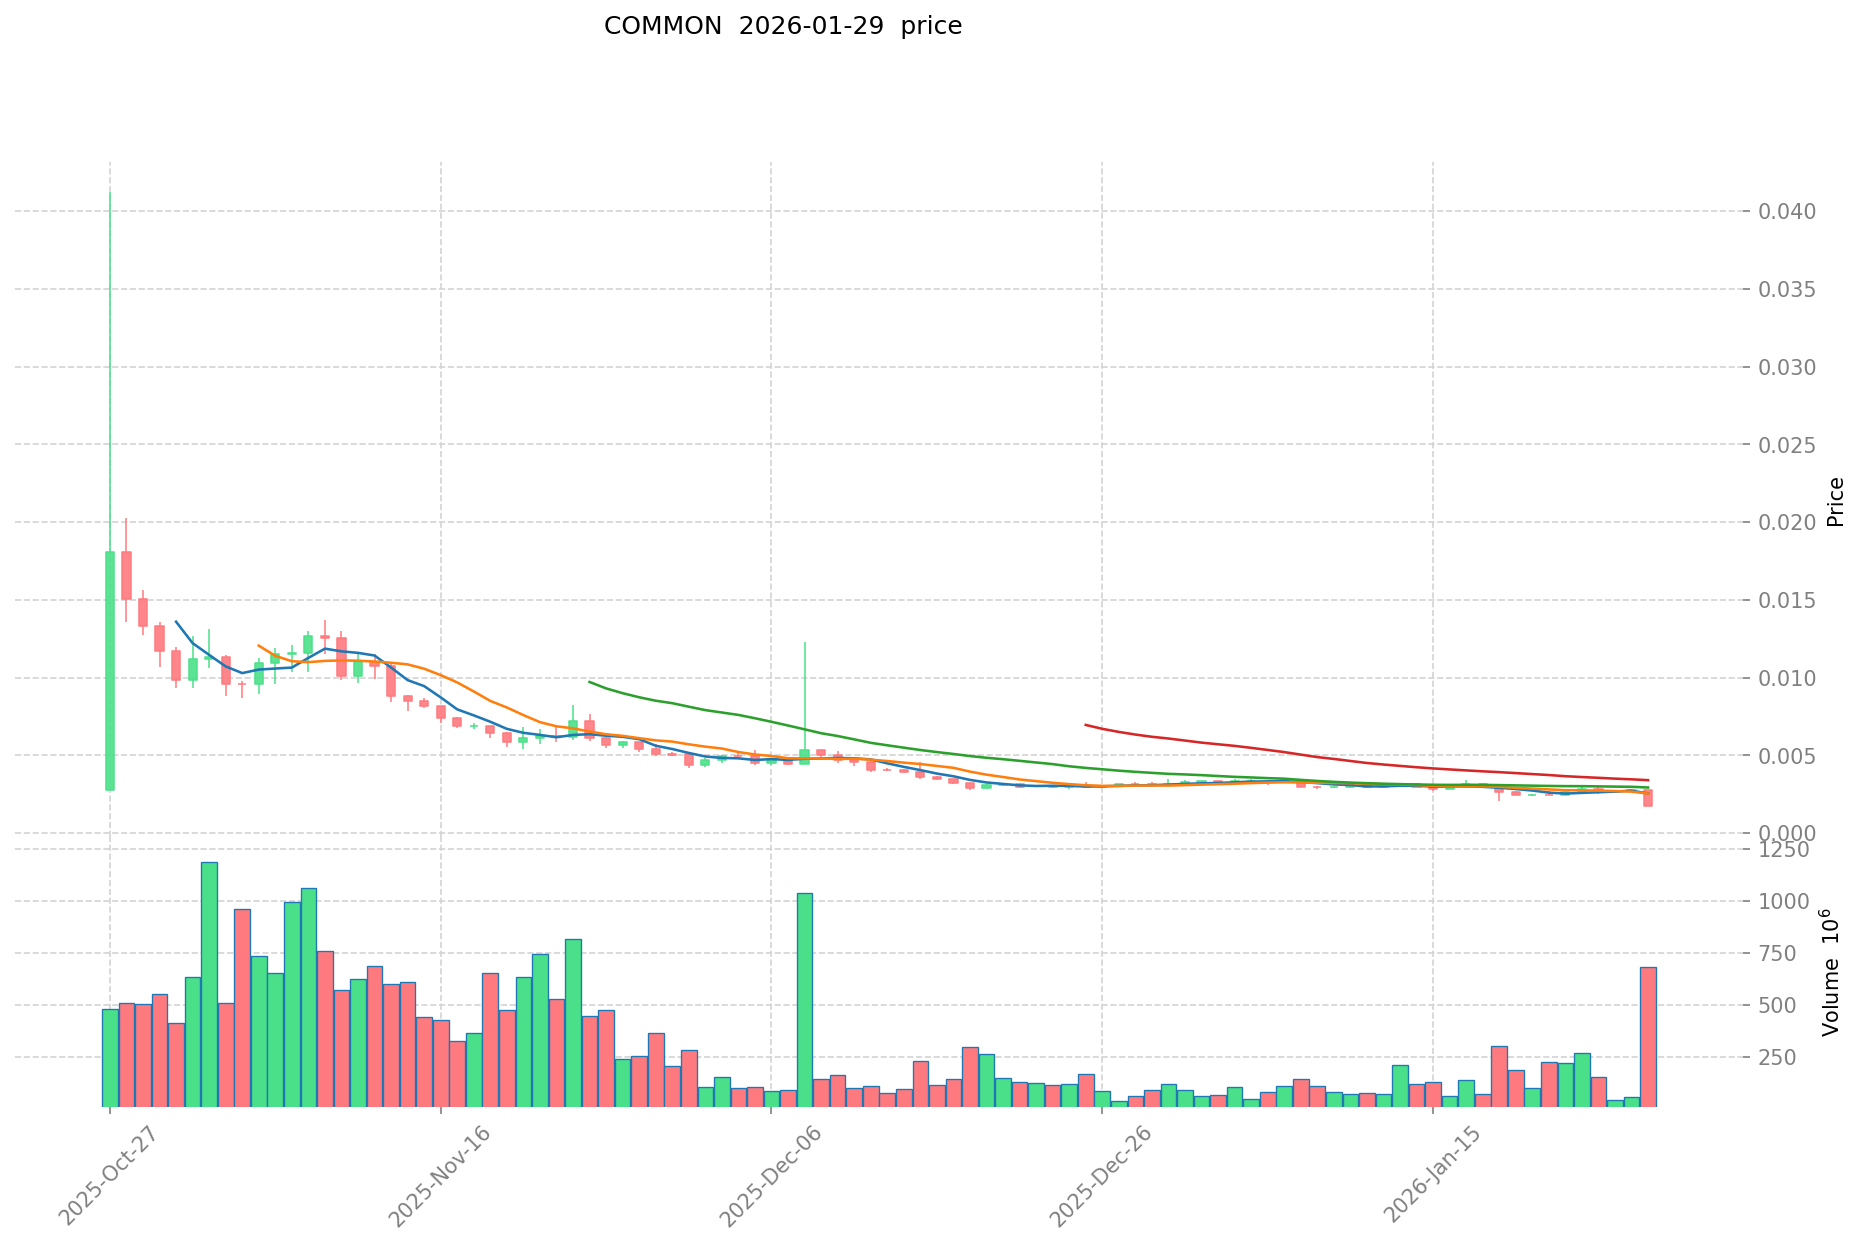
- October 2025: COMMON reached a significant price level of $0.0412 on October 27, marking a notable peak in its early trading period.
- January 2026: The token experienced substantial downward pressure, declining to $0.001377 on January 29, representing a significant correction from previous levels.
COMMON Current Market Situation
As of January 30, 2026, COMMON is trading at $0.001536, showing mixed short-term momentum with a 2.19% increase over the past hour but facing broader selling pressure with a 12.69% decline over 24 hours. The token has experienced more pronounced weakness over extended timeframes, declining 38.49% over the past week and 50.62% over the past 30 days.
The 24-hour trading volume stands at approximately $5.97 million, with the token trading within a range of $0.001377 to $0.001789 during this period. COMMON's market capitalization is approximately $3.81 million, with a circulating supply of 2.48 billion tokens representing 19.95% of the maximum supply of 12.42 billion tokens. The fully diluted market cap is calculated at approximately $19.07 million.
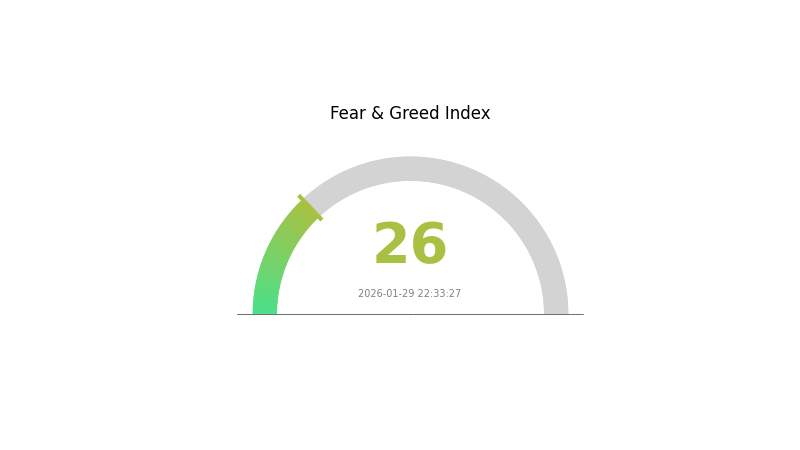
The token maintains a presence across 13 exchanges and has approximately 3,532 holders. COMMON's market share stands at 0.00063% of the total cryptocurrency market. The current market sentiment indicator shows a fear level of 26, suggesting cautious investor behavior in the broader market environment.
COMMON operates on the Base blockchain, with its contract address verified at 0x4c87da04887a1f9f21f777e3a8dd55c3c9f84701. The project positions itself as an AI-native workspace where communities, projects, and threads are tokenized, serving 3.8 million users across more than 50,000 communities.
Click to view current COMMON market price
COMMON Market Sentiment Indicator
2026-01-29 Fear and Greed Index: 26 (Fear)
Click to view the current Fear & Greed Index
The cryptocurrency market is currently experiencing a fear sentiment, with the Fear and Greed Index standing at 26. This reading indicates significant market anxiety and risk aversion among investors. When the index is in the fear zone, market participants tend to adopt cautious positions and may reduce their exposure to digital assets. This environment often presents contrarian opportunities for long-term investors, as extreme fear can sometimes precede market reversals. Traders should remain vigilant and monitor key technical levels while considering the broader market conditions and macroeconomic factors influencing crypto asset valuations.
COMMON Token Holding Distribution
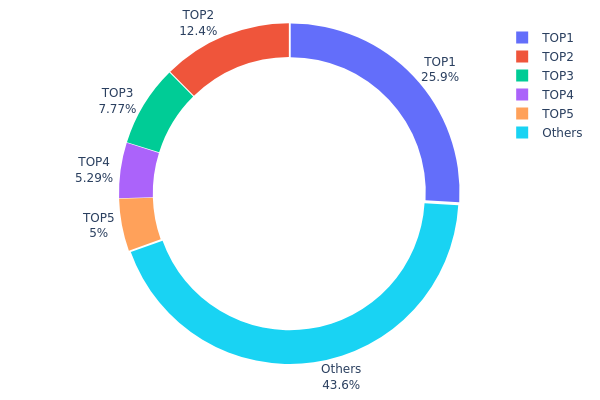
The token holding distribution chart reflects the allocation structure of COMMON tokens across different wallet addresses on the blockchain, serving as a critical indicator for assessing the degree of decentralization and potential concentration risks within the token ecosystem. By analyzing the holdings of top addresses, we can evaluate the market's vulnerability to whale manipulation and the overall health of token distribution.
According to the current data, COMMON exhibits a relatively high concentration pattern. The top address holds approximately 2.59 million tokens, accounting for 25.94% of the total supply, while the top 5 addresses collectively control 56.39% of the circulating tokens. This concentration level suggests that a significant portion of COMMON's supply is controlled by a small number of entities, which could pose concerns regarding market stability and decentralization principles. Notably, the second-largest holder possesses 12.40% of the supply, and the third-largest holds 7.77%, indicating that beyond the leading address, several other whales maintain substantial positions capable of influencing market dynamics.
From a market structure perspective, this concentration pattern presents both opportunities and risks. On one hand, large holders may provide price stability and long-term support if they represent project team members, strategic investors, or institutional participants with vested interests in the project's success. On the other hand, such concentration increases vulnerability to coordinated selling pressure, as the top 5 addresses could theoretically liquidate over half of the circulating supply, potentially triggering significant price volatility. The "Others" category, representing 43.61% of holdings distributed among smaller addresses, suggests some degree of retail participation, though it remains insufficient to counterbalance the influence of major stakeholders.
Click to view the current COMMON Holding Distribution
| Top |
Address |
Holding Qty |
Holding (%) |
| 1 |
0x5b05...981e62 |
2594591.32K |
25.94% |
| 2 |
0x8ecd...db735f |
1240000.00K |
12.40% |
| 3 |
0x76e8...da4847 |
777499.90K |
7.77% |
| 4 |
0xbaed...e9439f |
528923.71K |
5.28% |
| 5 |
0x8328...695a55 |
500000.00K |
5.00% |
| - |
Others |
4358985.07K |
43.61% |
II. Core Factors Affecting COMMON's Future Price
Supply Mechanism
-
Token Distribution Framework: Common Protocol's price outlook is influenced by market demand, adoption trends, and broader economic factors. The token distribution mechanism follows standard Web3 project frameworks, where token pools are allocated across different participant groups including founders, teams, investors, and community members.
-
Supply-Demand Dynamics: Token economics fundamentally operates on supply-demand relationships. The design aims to encourage demand while managing supply to maintain long-term value. Token distribution typically occurs in phases, including private sales, public sales, and ecosystem incentive programs, with vesting and lock-up periods implemented to prevent market oversaturation.
-
Current Influence: The token's value is determined by its practical utility scenarios and ability to attract investors. Effective token flow mechanisms that encourage reinvestment rather than selling can create value cycles and extend project lifecycle.
Macro-Economic Environment
-
Economic Factors Impact: Common Protocol's price movements are influenced by macroeconomic conditions alongside cryptocurrency-specific factors. Broader economic trends, monetary cycles, and market liquidity conditions play roles in shaping price trajectories.
-
Market Volatility Considerations: Price performance tends to vary across different market conditions. During periods of market turbulence, defensive characteristics may become more pronounced, while high-volatility bull market environments can present different dynamics.
Technical Development and Ecosystem Building
-
Decentralized Protocol Architecture: As a utility token within decentralized protocol frameworks, COMMON's value depends on its usage at the protocol and infrastructure levels. The token may serve functions including transaction fees, access permissions, and in-application utility.
-
Ecosystem Applications: Token value can be influenced by factors such as community building efforts and participation in decentralized autonomous organization governance. The development of Web3 projects that enhance functional value for token holders contributes to organic price appreciation.
-
Technology Layer Integration: The advancement of decentralized technologies facilitates token usage across various technical layers of Web3 projects, providing additional methods for token minting and distribution beyond traditional approaches.
III. 2026-2031 COMMON Price Prediction
2026 Outlook
- Conservative Forecast: $0.00112 - $0.00152
- Neutral Forecast: Around $0.00152
- Optimistic Forecast: Up to $0.00216 (requires favorable market conditions and increased adoption)
Based on the prediction data, COMMON is expected to experience a slight decline in 2026, with the average price settling around $0.00152. The price range is projected to fluctuate between $0.00112 and $0.00216, reflecting potential market volatility and the ongoing development phase of the project.
2027-2029 Outlook
- Market Phase Expectation: Recovery and gradual growth phase as the cryptocurrency market matures
- Price Range Forecast:
- 2027: $0.00121 - $0.00208, with an average of $0.00184 (19% increase from 2026)
- 2028: $0.00102 - $0.00208, with an average of $0.00196 (27% increase from 2026)
- 2029: $0.00176 - $0.00236, with an average of $0.00202 (31% increase from 2026)
- Key Catalysts: Ecosystem expansion, technological improvements, and broader market adoption could drive price appreciation during this period. The steady year-over-year growth suggests increasing market confidence and utility.
2030-2031 Long-term Outlook
- Baseline Scenario: $0.00151 - $0.00311 in 2030 (assuming continued project development and stable market conditions)
- Optimistic Scenario: $0.00244 - $0.00342 by 2031 (assuming significant ecosystem growth and favorable regulatory environment)
- Transformative Scenario: Potential to reach upper price targets if breakthrough partnerships or technological innovations materialize
The long-term projections indicate substantial growth potential, with 2030 showing a 42% increase from 2026 levels, and 2031 potentially delivering a 72% gain. The average price is expected to reach $0.00219 in 2030 and $0.00265 in 2031, reflecting a compound growth trajectory as the project matures and expands its user base.
| Year |
Predicted High Price |
Predicted Average Price |
Predicted Low Price |
Price Change |
| 2026 |
0.00216 |
0.00152 |
0.00112 |
-1 |
| 2027 |
0.00208 |
0.00184 |
0.00121 |
19 |
| 2028 |
0.00208 |
0.00196 |
0.00102 |
27 |
| 2029 |
0.00236 |
0.00202 |
0.00176 |
31 |
| 2030 |
0.00311 |
0.00219 |
0.00151 |
42 |
| 2031 |
0.00342 |
0.00265 |
0.00244 |
72 |
IV. COMMON Professional Investment Strategies & Risk Management
COMMON Investment Methodology
(1) Long-term Holding Strategy
- Suitable for: Long-term believers in AI-native tokenized communities and decentralized collaboration platforms
- Operational recommendations:
- Consider dollar-cost averaging (DCA) to build positions gradually, mitigating the impact of short-term price volatility
- Monitor the growth of Common's user base (currently 3.8 million users across 50,000+ communities) and ecosystem expansion as key performance indicators
- Utilize secure storage solutions such as Gate Web3 Wallet for long-term custody, enabling participation in potential governance or reward mechanisms
(2) Active Trading Strategy
- Technical analysis tools:
- Volume analysis: Monitor 24-hour trading volume (currently $5,969,424) to identify potential breakout or reversal patterns
- Support and resistance levels: Track key price zones based on 24-hour high ($0.001789) and low ($0.001377) to plan entry and exit points
- Swing trading considerations:
- Given the high volatility (7-day change: -38.49%, 30-day change: -50.62%), implement strict stop-loss orders to protect capital
- Monitor market sentiment and news related to AI, tokenization, and decentralized workspace trends for timing opportunities
COMMON Risk Management Framework
(1) Asset Allocation Principles
- Conservative investors: 1-3% of total crypto portfolio
- Aggressive investors: 5-8% of total crypto portfolio
- Professional investors: Up to 10-15% of total crypto portfolio, depending on risk tolerance and market analysis
(2) Risk Hedging Solutions
- Portfolio diversification: Balance COMMON exposure with established cryptocurrencies and stablecoins to reduce concentration risk
- Position sizing: Limit individual trade size to prevent significant losses from adverse price movements
(3) Secure Storage Solutions
- Hot wallet recommendation: Gate Web3 Wallet for active trading and accessing DeFi features
- Cold storage option: Consider hardware wallets for long-term holdings to minimize exposure to online threats
- Security precautions: Enable two-factor authentication, regularly update software, and never share private keys or seed phrases
V. COMMON Potential Risks & Challenges
COMMON Market Risks
- High volatility: COMMON has experienced substantial price fluctuations, with a 30-day decline of -50.62%, indicating significant market instability
- Low liquidity: With a market cap of $3,805,772 and relatively low trading volume, large trades may experience slippage or difficulty executing at desired prices
- Limited market history: COMMON's recent launch (October 2025) means historical data is limited, making long-term trend analysis challenging
COMMON Regulatory Risks
- Tokenization regulations: Evolving global regulations around tokenized communities and digital assets may impact COMMON's operational model
- AI integration compliance: As an AI-native platform, COMMON may face emerging regulatory scrutiny regarding AI governance and data privacy
- Geographic restrictions: Regulatory changes in key markets could limit access or adoption of COMMON's platform and token
COMMON Technical Risks
- Smart contract vulnerabilities: As a BASE-deployed token, COMMON is subject to potential smart contract bugs or exploits that could affect token integrity
- Platform scalability: With 3.8 million users across 50,000+ communities, technical challenges in scaling infrastructure could impact user experience
- Competition: The AI-native workspace sector is rapidly evolving, and COMMON faces competition from emerging platforms with similar value propositions
VI. Conclusion & Action Recommendations
COMMON Investment Value Assessment
COMMON presents an innovative approach to tokenized AI-native workspaces, offering potential value through its integration of decentralized collaboration, AI agents, and earning opportunities. However, the project's early stage, combined with significant price volatility and market uncertainty, presents considerable risk. Long-term value may depend on user adoption growth, ecosystem development, and successful navigation of regulatory landscapes. Short-term risks include continued price pressure, liquidity constraints, and market sentiment volatility.
COMMON Investment Recommendations
✅ Beginners: Approach with caution; consider allocating only a small portion (1-2%) of your crypto portfolio and prioritize education on AI-native platforms and tokenization before investing
✅ Experienced investors: Employ disciplined risk management, utilize DCA strategies, and monitor key metrics such as user growth and ecosystem milestones; consider COMMON as a speculative, high-risk component of a diversified portfolio
✅ Institutional investors: Conduct thorough due diligence on Common's technology, team, and competitive positioning; consider pilot allocations while closely tracking regulatory developments and platform scalability
COMMON Trading Participation Methods
- Spot trading: Purchase COMMON directly on Gate.com and other supported exchanges (available on 13 exchanges) for straightforward exposure
- Gate Web3 Wallet integration: Access decentralized features and potential ecosystem participation through Gate Web3 Wallet for enhanced utility
- Gradual accumulation: Implement dollar-cost averaging to mitigate timing risk and build positions over time as the project matures
Cryptocurrency investment carries extremely high risk, and this article does not constitute investment advice. Investors should make cautious decisions based on their own risk tolerance and are advised to consult professional financial advisors. Never invest more than you can afford to lose.
FAQ
What is COMMON token and what is its purpose?
COMMON is the native utility token of the Common protocol, designed to simplify community management and participation in Web3 ecosystems. It enables community governance, decision-making, and reward mechanisms through integrations with Discord and other platforms.
What is the historical price trend of COMMON token?
COMMON reached its all-time high of $0.06018 and low of $0.01990 on October 27, 2025. The token experienced significant volatility during its initial listing period, with notable price fluctuations after reaching its peak.
What will the COMMON token price reach in 2024?
COMMON token's 2024 price trajectory depends on market adoption, ecosystem development, and overall crypto sentiment. Based on current momentum and project fundamentals, price could potentially reach $0.50-$2.00 range, though market conditions remain highly volatile.
What are the main factors affecting COMMON token price?
COMMON token price is primarily influenced by market sentiment, overall cryptocurrency market trends, trading volume, and liquidity on exchanges. Network adoption and project developments also play significant roles in price movements.
How to analyze the technical and fundamental aspects of COMMON tokens?
Analyze technical aspects by observing price trends, trading volume, and chart patterns. For fundamentals, examine the project's technology, team, tokenomics, adoption metrics, and community growth. Compare transaction activity and ecosystem development to assess long-term potential.
What advantages does COMMON token have compared to other similar tokens?
COMMON exhibits superior price volatility of 4-8% daily, creating significant profit opportunities through strategic trading. It leads broader market trends by 10-14 days, providing early signals. Its unique volatility patterns enable identifiable trading opportunities with higher returns compared to static buy-and-hold strategies.
What are the main risks of investing in COMMON tokens?
The primary risks include high price volatility, market immaturity, and project execution uncertainty. Regulatory changes could impact token value. Early-stage projects carry potential for significant losses if development fails or adoption doesn't materialize.
Where can I buy and sell COMMON tokens?
COMMON tokens are available for trading on Gate.com, Bitget, BingX, MEXC, and Bybit. These major exchanges provide liquidity and support for COMMON trading pairs.
* The information is not intended to be and does not constitute financial advice or any other recommendation of any sort offered or endorsed by Gate.