This comprehensive analysis examines Cartesi (CTSI) token pricing dynamics from 2026 to 2031, offering professional forecasts for blockchain infrastructure investors. The article reviews CTSI's historical performance from its 2020 launch through its 2021 peak of $1.74 and subsequent market correction, currently trading at $0.03435 in January 2026. It provides detailed price predictions across three scenarios: conservative ($0.02237-$0.03441), neutral ($0.03441), and optimistic ($0.04989) for 2026, with projections reaching $0.10151 by 2031 under favorable conditions. The guide addresses core market factors, holding distribution patterns indicating moderate concentration with top 5 addresses controlling 54.61%, and actionable investment strategies via Gate trading platform. Risk analysis covers volatility concerns, regulatory uncertainties, and technical execution challenges while maintaining current market context without speculative predictions.
Introduction: CTSI's Market Position and Investment Value
Cartesi (CTSI), positioned as a Layer-2 infrastructure solution enabling complex computations in Linux environments off-chain without compromising decentralization or security, has been making strides in the blockchain scalability sector since its launch in 2020. As of 2026, Cartesi holds a market capitalization of approximately $30.97 million, with a circulating supply of around 901.49 million tokens, and maintains a price level near $0.03435. This asset, characterized as a developer-friendly blockchain infrastructure solution, is playing an increasingly relevant role in expanding the computational capabilities of decentralized applications.
This article will comprehensively analyze CTSI's price trajectory from 2026 to 2031, incorporating historical patterns, market supply and demand dynamics, ecosystem development progress, and macroeconomic conditions to provide investors with professional price forecasts and practical investment strategies.
I. CTSI Price History Review and Market Status
CTSI Historical Price Evolution Trajectory
- 2020: Cartesi (CTSI) launched on April 23, 2020 with an initial offering price of $0.015, marking the beginning of its market journey in providing Layer-2 infrastructure for decentralized applications.
- 2021: CTSI experienced significant growth during the broader cryptocurrency bull market, reaching an all-time high of $1.74 on May 9, 2021, representing a substantial appreciation from its launch price.
- 2022-2024: Following the peak in 2021, CTSI entered a prolonged correction phase aligned with the broader crypto market downturn, with prices declining from the historical high.
- 2025: The token reached its all-time low of $0.02606722 on October 11, 2025, reflecting challenging market conditions and representing a significant decline from its 2021 peak.
CTSI Current Market Situation
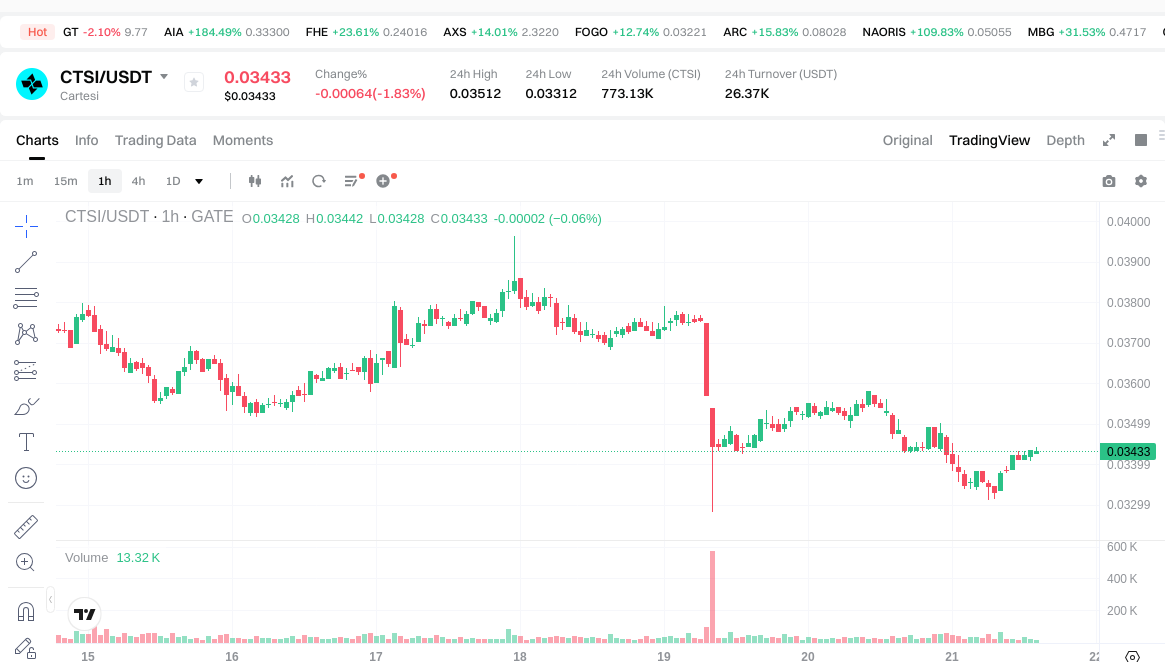
As of January 21, 2026, CTSI is trading at $0.03435, showing a modest recovery from its October 2025 low. The token has demonstrated mixed short-term performance, with a slight increase of 0.29% over the past hour, but experiencing a decline of 1.57% in the last 24 hours. Over the past week, CTSI has decreased by 7.19%, while showing a positive monthly trend with a 6.23% gain over the past 30 days.
The current 24-hour trading range spans from $0.03312 to $0.03512, with a total trading volume of $26,234.17. CTSI maintains a market capitalization of approximately $30.97 million, with a circulating supply of 901.49 million tokens representing 90.15% of the maximum supply of 1 billion tokens. The fully diluted market cap stands at $34.35 million.
Cartesi currently ranks #706 among cryptocurrencies by market capitalization, holding a 0.0010% market share. The project is listed on 31 exchanges and has attracted a holder base of 20,269 addresses. The market cap to fully diluted valuation ratio of 90.15% indicates that the majority of tokens are already in circulation.
The current market sentiment reflects extreme fear with a volatility index of 24, suggesting cautious positioning among market participants. Despite the challenging one-year performance showing a 74.52% decline, the recent monthly recovery indicates potential stabilization in CTSI's price action.
Click to view current CTSI market price
Crypto Market Sentiment Indicator
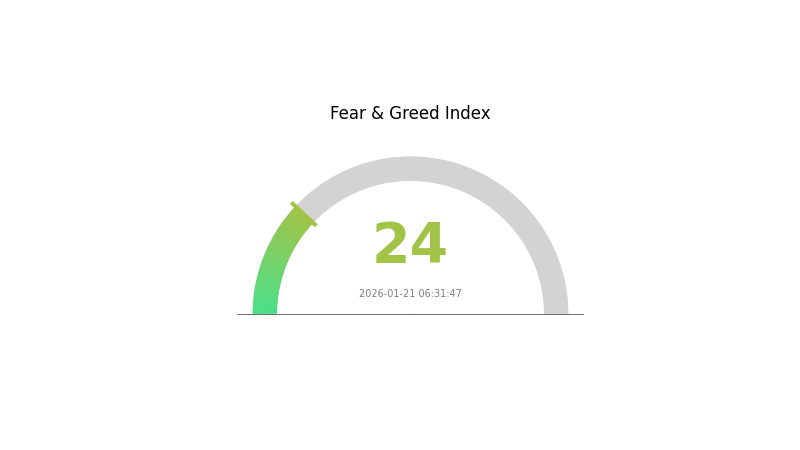
2026-01-21 Fear & Greed Index: 24 (Extreme Fear)
Click to view the current Fear & Greed Index
The crypto market is experiencing extreme fear with the Fear & Greed Index plummeting to 24. This exceptionally low reading indicates investors are heavily risk-averse and sentiment has turned significantly negative. During such periods, market participants typically adopt cautious positions and exhibit reduced buying appetite. However, historically, extreme fear levels often present contrarian opportunities for long-term investors. The current market conditions warrant careful analysis before making investment decisions on Gate.com.
CTSI Holding Distribution
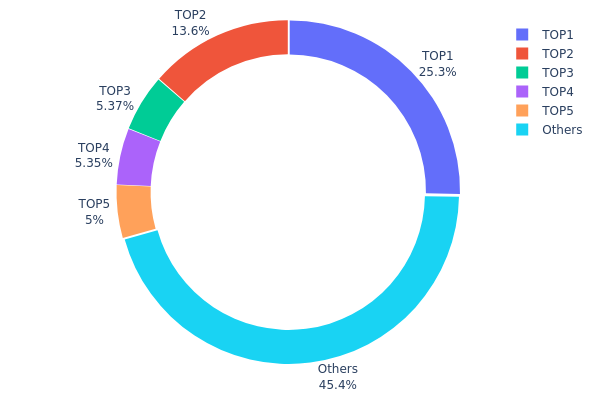
The holding distribution chart reveals the concentration of token ownership across different wallet addresses, serving as a critical indicator of decentralization and potential market manipulation risks. As of January 21, 2026, CTSI's on-chain structure demonstrates a moderately concentrated pattern, with the top 5 addresses collectively controlling 54.61% of the total circulating supply.
The data reveals significant concentration in the top tier, with the largest holder (0x9ede...764a69) possessing 252.92 million CTSI tokens, accounting for 25.29% of the total supply. The second-largest address (0xf977...41acec) holds 136.25 million tokens (13.62%), while the third through fifth positions maintain holdings between 5.00% and 5.36%. This distribution pattern suggests that while no single entity dominates the market entirely, the combined influence of major holders remains substantial enough to impact price discovery and liquidity dynamics during periods of large-scale transactions.
The remaining 45.39% distributed among other addresses indicates a relatively healthy retail and institutional participation base. However, the presence of two addresses each controlling over 13% of supply introduces structural vulnerabilities, particularly during market stress scenarios where coordinated selling pressure from top holders could trigger cascading liquidations. From a decentralization perspective, CTSI's current holding structure falls within the moderate range typical of established Layer 2 infrastructure projects, neither exhibiting excessive centralization seen in highly controlled tokens nor achieving the broader distribution characteristic of mature decentralized networks. This concentration level warrants continued monitoring, particularly regarding the movement patterns of top-tier addresses which could provide early signals of major market shifts.
Click to view current CTSI Holding Distribution
| Top |
Address |
Holding Qty |
Holding (%) |
| 1 |
0x9ede...764a69 |
252923.78K |
25.29% |
| 2 |
0xf977...41acec |
136248.65K |
13.62% |
| 3 |
0x17fe...a0e9dd |
53684.57K |
5.36% |
| 4 |
0xc4ce...e8971e |
53450.28K |
5.34% |
| 5 |
0xef13...1116a0 |
50000.00K |
5.00% |
| - |
Others |
453692.72K |
45.39% |
II. Core Factors Influencing CTSI's Future Price
Due to the lack of available data in the provided materials regarding CTSI's supply mechanisms, institutional holdings, macroeconomic factors, and technical developments, a comprehensive analysis of the core factors influencing CTSI's future price cannot be generated at this time. To provide accurate and reliable insights, specific information about Cartesi's tokenomics, recent ecosystem updates, partnership announcements, and market dynamics would be required.
For the most current information about CTSI, users are encouraged to visit Gate.com's official platform or refer to Cartesi's official channels for updates on technical developments and ecosystem growth.
III. 2026-2031 CTSI Price Prediction
2026 Outlook
- Conservative Forecast: $0.02237 - $0.03441
- Neutral Forecast: $0.03441 (average projection)
- Optimistic Forecast: $0.04989 (requiring favorable market conditions and ecosystem expansion)
2027-2029 Outlook
- Market Stage Expectation: Gradual growth phase with moderate volatility as the project continues development and adoption
- Price Range Forecast:
- 2027: $0.04004 - $0.05817 (approximately 22% increase from 2026 baseline)
- 2028: $0.03812 - $0.06671 (approximately 46% cumulative increase)
- 2029: $0.03448 - $0.06545 (approximately 70% cumulative increase with potential consolidation)
- Key Catalysts: Technical developments, partnerships, broader blockchain infrastructure adoption, and overall cryptocurrency market sentiment
2030-2031 Long-term Outlook
- Baseline Scenario: $0.04646 - $0.06194 in 2030 (assuming steady ecosystem growth and sustained market interest)
- Optimistic Scenario: $0.07464 - $0.10151 by 2031 (contingent on significant technological breakthroughs and mainstream adoption)
- Transformative Scenario: Potential to exceed $0.10151 (requiring exceptional market conditions, major institutional adoption, and breakthrough use cases)
- 2026-01-21: CTSI baseline average projection at $0.03441 (representing initial forecast period starting point)
| Year |
Predicted High Price |
Predicted Average Price |
Predicted Low Price |
Price Change |
| 2026 |
0.04989 |
0.03441 |
0.02237 |
0 |
| 2027 |
0.05817 |
0.04215 |
0.04004 |
22 |
| 2028 |
0.06671 |
0.05016 |
0.03812 |
46 |
| 2029 |
0.06545 |
0.05844 |
0.03448 |
70 |
| 2030 |
0.08734 |
0.06194 |
0.04646 |
80 |
| 2031 |
0.10151 |
0.07464 |
0.04926 |
117 |
IV. CTSI Professional Investment Strategy and Risk Management
CTSI Investment Methodology
(I) Long-Term Holding Strategy
- Target Investors: Individuals seeking exposure to Layer-2 infrastructure projects with a development focus on decentralized applications
- Operational Recommendations:
- Consider accumulating positions during market downturns when CTSI trades closer to support levels
- Monitor project development milestones and ecosystem growth as indicators for long-term viability
- Gate Web3 Wallet provides a secure storage solution for CTSI tokens with user-friendly interface
(II) Active Trading Strategy
- Technical Analysis Tools:
- Moving Averages: Use 50-day and 200-day moving averages to identify potential trend reversals and support/resistance levels
- Relative Strength Index (RSI): Monitor overbought conditions above 70 and oversold conditions below 30 for potential entry and exit points
- Swing Trading Key Points:
- Pay attention to the 24-hour price range between $0.03312 and $0.03512 for intraday trading opportunities
- Consider volume patterns as CTSI's 24-hour trading volume of approximately $26,234 may indicate lower liquidity requiring careful position sizing
CTSI Risk Management Framework
(I) Asset Allocation Principles
- Conservative Investors: 1-3% of cryptocurrency portfolio
- Aggressive Investors: 5-8% of cryptocurrency portfolio
- Professional Investors: May allocate up to 10% depending on thesis strength and diversification strategy
(II) Risk Hedging Solutions
- Portfolio Diversification: Allocate across multiple Layer-2 solutions and infrastructure projects to reduce single-project exposure
- Stop-Loss Implementation: Set predetermined exit points to limit potential losses during volatile market conditions
(III) Secure Storage Solutions
- Software Wallet Recommendation: Gate Web3 Wallet offers convenient access with enhanced security features for CTSI storage
- Multi-Signature Solutions: Consider multi-signature wallets for larger holdings to enhance security through distributed access control
- Security Precautions: Never share private keys or seed phrases, enable two-factor authentication, and regularly update security protocols
V. CTSI Potential Risks and Challenges
CTSI Market Risks
- High Volatility: CTSI has experienced a 74.52% decline over the past year, indicating significant price volatility that may continue
- Limited Liquidity: With a market cap of approximately $30.97 million and ranking at 706, CTSI faces potential liquidity constraints that may impact large trades
- Market Concentration: With only 0.0010% market dominance, CTSI remains highly susceptible to broader cryptocurrency market movements
CTSI Regulatory Risks
- Layer-2 Classification: Evolving regulatory frameworks may impact how Layer-2 solutions are classified and regulated across different jurisdictions
- Compliance Requirements: Potential future regulatory requirements for blockchain infrastructure projects could affect operational costs and development timelines
- Geographic Restrictions: Certain regions may impose limitations on cryptocurrency trading and ownership affecting CTSI accessibility
CTSI Technical Risks
- Development Execution: The success of Cartesi's Linux-based off-chain computing environment depends on continuous technical development and adoption
- Competition Pressure: Multiple Layer-2 solutions compete for developer attention and market share, potentially limiting Cartesi's growth
- Smart Contract Vulnerabilities: Despite security measures, smart contracts and blockchain infrastructure may contain undiscovered vulnerabilities
VI. Conclusion and Action Recommendations
CTSI Investment Value Assessment
Cartesi presents an innovative approach to blockchain scalability through its Linux-based off-chain computing environment, offering developers familiar tools for building decentralized applications. However, the project faces significant challenges including a 74.52% price decline over the past year and relatively small market presence with $30.97 million market cap. While the circulating supply represents 90.15% of total supply indicating limited future dilution concerns, investors should carefully weigh the project's technical innovation against current market positioning and competitive landscape. The short-term outlook remains uncertain given recent negative price momentum, while long-term value depends heavily on successful ecosystem development and developer adoption.
CTSI Investment Recommendations
✅ Beginners: Start with small position sizes (1-2% of crypto portfolio) and focus on understanding the project fundamentals before increasing exposure. Use Gate Web3 Wallet for secure storage and avoid trading during high volatility periods.
✅ Experienced Investors: Consider dollar-cost averaging strategies given current price levels relative to historical ranges. Monitor technical indicators and project development updates for optimal entry points while maintaining strict risk management protocols.
✅ Institutional Investors: Conduct thorough due diligence on Cartesi's technology stack, developer activity, and competitive positioning. Consider long-term allocation as part of diversified Layer-2 infrastructure exposure with appropriate hedging strategies.
CTSI Trading Participation Methods
- Spot Trading: Purchase CTSI directly through Gate.com with support for multiple trading pairs and competitive fees
- Portfolio Allocation: Include CTSI as part of a diversified blockchain infrastructure strategy alongside other Layer-2 projects
- Storage and Custody: Utilize Gate Web3 Wallet for convenient and secure CTSI token storage with regular security updates
Cryptocurrency investment carries extreme risks, and this article does not constitute investment advice. Investors should make careful decisions based on their own risk tolerance and are advised to consult professional financial advisors. Never invest more than you can afford to lose.
FAQ
What is the CTSI project? What is its purpose?
Cartesi (CTSI) is a blockchain infrastructure project that enables scalable smart contracts by combining on-chain and off-chain computation. It allows developers to build complex decentralized applications with improved efficiency, reducing gas costs while maintaining security through its innovative rollup technology.
What are the main factors affecting CTSI price?
CTSI price is influenced by network adoption rates, transaction volume, developer activity, market sentiment, macroeconomic conditions, token supply dynamics, and technological upgrades to the Cartesi platform.
What is the price prediction for CTSI in 2024-2025?
Based on market analysis, CTSI is expected to range between $0.25-$0.45 during 2024-2025, driven by increased adoption and development progress. Long-term growth potential remains strong as the platform expands its ecosystem and use cases.
What advantages does CTSI have compared to other Layer 2 solution tokens?
CTSI offers unique computational verification capabilities through Cartesi Machine, enabling complex computation on-chain cost-effectively. Its optimistic rollup approach reduces transaction fees while maintaining security, differentiating it from standard Layer 2 solutions.
What are the risks and opportunities of investing in CTSI?
Opportunities: CTSI powers Cartesi's Web3 infrastructure layer, benefiting from increasing demand for scalable solutions and ecosystem expansion. Growing adoption in dApps and enterprise applications could drive long-term value appreciation. Risks: Market volatility, regulatory uncertainty, and competition from alternative solutions may impact price movements and project viability.
CTSI has demonstrated solid market presence with consistent trading activity and healthy liquidity across major platforms. The token has shown resilience through market cycles, maintaining strong trading volumes and competitive bid-ask spreads, reflecting robust market demand and investor confidence in the Cartesi ecosystem.
* The information is not intended to be and does not constitute financial advice or any other recommendation of any sort offered or endorsed by Gate.