This comprehensive analysis examines Coinweb (CWEB) price trends and investment prospects from 2026 through 2031. As a second-layer cross-chain computing platform trading at $0.002045 with a $13.26 million market cap, CWEB addresses blockchain interoperability challenges. The article projects conservative 2026 estimates between $0.00146-$0.00205, with potential long-term appreciation to $0.00498 by 2031, representing approximately 80% growth. Expert recommendations include dollar-cost averaging for newcomers, active portfolio management for experienced investors, and rigorous due diligence for institutions. Key considerations include limited trading volume ($35,204), concentrated holder distribution (71.9% held by top five addresses), and regulatory uncertainties. Investors should utilize Gate exchange for spot trading and Web3 wallet solutions while implementing appropriate risk management strategies based on individual risk tolerance and investment horizons.
Introduction: CWEB's Market Position and Investment Value
Coinweb (CWEB), positioned as a second-layer cross-chain computing platform providing real interoperability for blockchain applications, has been under development since 2017 and emerged from stealth mode in recent years. As of 2026, Coinweb maintains a market capitalization of approximately $13.26 million, with a circulating supply of around 6.48 billion tokens, and the price hovering near $0.002045. This asset, recognized for its InChain architecture innovation, is playing an increasingly important role in enabling blockchain interoperability and cross-chain application development.
This article will comprehensively analyze CWEB's price trends from 2026 to 2031, combining historical patterns, market supply and demand dynamics, ecosystem development, and macroeconomic conditions to provide investors with professional price forecasts and practical investment strategies.
I. CWEB Price History Review and Market Status
CWEB Historical Price Evolution Trajectory
- 2021: CWEB reached a price level of $0.661693 on December 30, marking a significant milestone during the project's early trading period.
- 2022-2025: The token experienced a substantial decline from its previous levels, reflecting broader market conditions and adjustments in the crypto ecosystem.
- 2026: On January 23, CWEB recorded a price of $0.00197667, representing a notable contraction from earlier valuations.
CWEB Current Market Situation
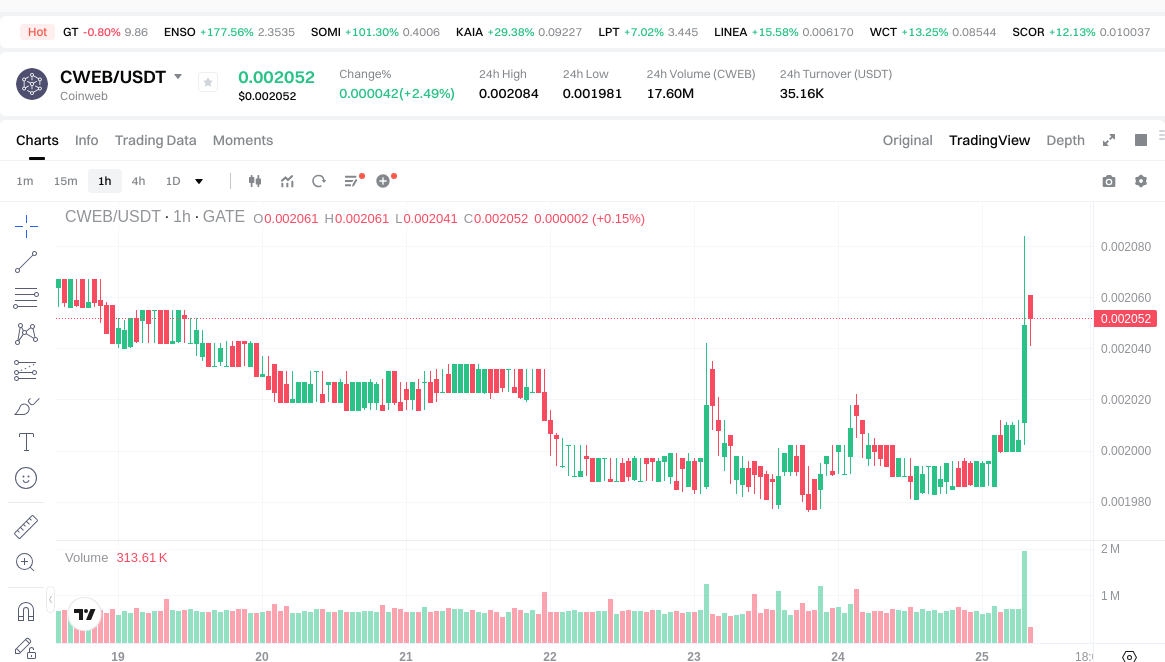
As of January 25, 2026, CWEB is trading at $0.002045, showing a 24-hour price increase of 2.95%. The token's trading range over the past day spans from $0.001981 to $0.002084, indicating moderate intraday volatility.
The current 24-hour trading volume stands at $35,204.40, with a circulating supply of 6,484,622,894 CWEB tokens. The market capitalization is approximately $13.26 million, while the fully diluted valuation reaches $15.54 million. The circulating supply represents 84.44% of the total supply of 7,599,185,598 CWEB tokens, with a maximum supply capped at 7,680,000,000 tokens.
CWEB holds a market ranking of 1073 and accounts for 0.00049% of the total cryptocurrency market share. The token is deployed on the Ethereum network with the contract address 0x505b5eda5e25a67e1c24a2bf1a527ed9eb88bf04.
Recent price performance shows mixed signals across different timeframes: a 1-hour gain of 1.64%, a 7-day decline of 0.67%, a 30-day decrease of 9.36%, and a 1-year drop of 47.53%. The current market sentiment index stands at 25, indicating extreme fear in the broader market environment.
Coinweb is listed on Gate.com and maintains a holder base of 6,377 addresses. The project focuses on cross-chain interoperability through its InChain architecture, positioning itself as a second-layer computing platform designed to facilitate blockchain integration for real-world applications.
Click to view current CWEB market price
CWEB Market Sentiment Indicator
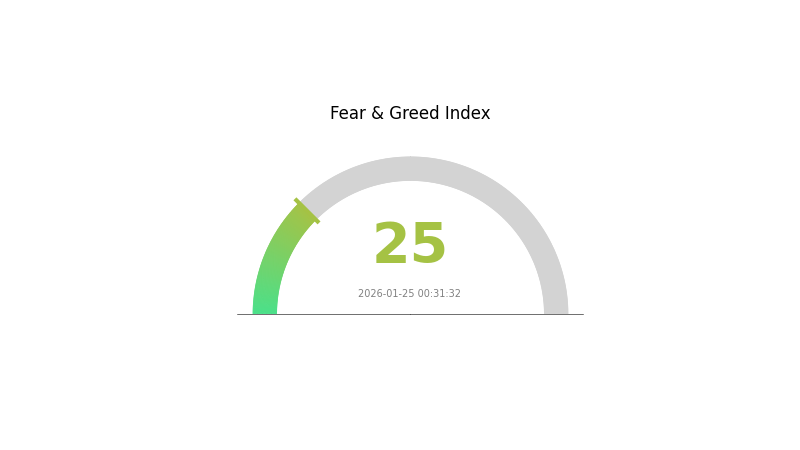
2026-01-25 Fear and Greed Index: 25 (Extreme Fear)
Click to view current Fear & Greed Index
The cryptocurrency market is currently experiencing extreme fear, with the Fear and Greed Index standing at 25. This significant decline reflects heightened market anxiety and pessimistic sentiment among investors. During periods of extreme fear, market volatility typically increases, creating both risks and opportunities. Risk-averse investors may consider reducing exposure, while long-term investors might view this as a potential accumulation opportunity. It's crucial to maintain a disciplined investment strategy and avoid panic-driven decisions. Monitor market developments closely and ensure your portfolio aligns with your risk tolerance and investment objectives.
CWEB Holder Distribution
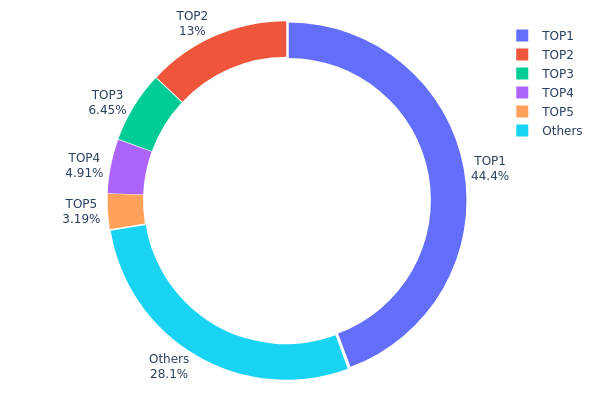
The holder distribution chart visualizes the concentration of token ownership across different wallet addresses, providing crucial insights into the decentralization level and potential market manipulation risks. By analyzing the proportion of tokens held by top addresses versus the broader community, investors can assess whether the token's market structure is healthy and sustainable.
According to the current data, CWEB exhibits a notably high concentration pattern. The top address alone controls 3,370,743.74K tokens, representing 44.35% of the total supply, while the top five addresses collectively hold approximately 71.9% of all tokens in circulation. This level of concentration suggests that a relatively small number of entities possess significant control over the token's market dynamics. The second-largest holder accounts for 13.02%, and the third holds 6.44%, indicating a clear hierarchical structure in ownership distribution.
This concentrated holder distribution presents both opportunities and risks for market participants. On one hand, such concentration may indicate strong conviction from early investors or strategic partners, potentially signaling confidence in the project's long-term value. On the other hand, high concentration increases the risk of price manipulation and creates vulnerability to sudden sell-offs if major holders decide to liquidate their positions. The relatively modest "Others" category at 28.1% suggests limited token distribution among retail investors and smaller participants, which could impact liquidity and price stability during volatile market conditions. This distribution pattern reflects a centralized on-chain structure that warrants careful monitoring by investors considering CWEB positions.
Click to view current CWEB Holder Distribution
| Top |
Address |
Holding Qty |
Holding (%) |
| 1 |
0x13fe...b12b1b |
3370743.74K |
44.35% |
| 2 |
0xd6fb...2f3ed7 |
989539.51K |
13.02% |
| 3 |
0x1660...4cfe36 |
490000.00K |
6.44% |
| 4 |
0x914b...01a6d8 |
373007.39K |
4.90% |
| 5 |
0x4209...4be2a1 |
242788.13K |
3.19% |
| - |
Others |
2133106.84K |
28.1% |
II. Core Factors Influencing CWEB's Future Price
Based on the available information, there is insufficient data to provide a comprehensive analysis of the core factors that may influence CWEB's future price. Without specific details about supply mechanisms, institutional dynamics, macroeconomic conditions, or technological developments related to CWEB, it would not be appropriate to speculate on these elements.
Investors interested in CWEB should conduct thorough research using verified sources and consider consulting with financial professionals before making investment decisions.
III. 2026-2031 CWEB Price Forecast
2026 Outlook
- Conservative prediction: $0.00146 - $0.00205
- Neutral prediction: Around $0.00205
- Optimistic prediction: Up to $0.00234 (subject to favorable market conditions and increased adoption)
2027-2029 Mid-term Outlook
- Market stage expectation: CWEB may enter a gradual growth phase with increasing volatility as the project matures and expands its ecosystem partnerships
- Price range forecast:
- 2027: $0.00184 - $0.00318, with an average around $0.00220
- 2028: $0.00247 - $0.00355, with an average around $0.00269
- 2029: $0.00203 - $0.00321, with an average around $0.00312
- Key catalysts: Technology upgrades, strategic partnerships, broader market adoption, and overall cryptocurrency market sentiment could serve as primary drivers for price movement
2030-2031 Long-term Outlook
- Baseline scenario: $0.00222 - $0.00421 (assuming steady project development and moderate market growth)
- Optimistic scenario: $0.00317 - $0.00498 (contingent on significant ecosystem expansion and enhanced utility)
- Transformative scenario: Potential to reach $0.00498 by 2031 (dependent on breakthrough developments, mass adoption, and exceptionally favorable market conditions)
- 2026-01-25: CWEB shows potential for gradual appreciation over the forecast period, with projected growth of approximately 80% by 2031 compared to 2026 baseline levels
| Year |
Predicted High Price |
Predicted Average Price |
Predicted Low Price |
Price Change |
| 2026 |
0.00234 |
0.00205 |
0.00146 |
0 |
| 2027 |
0.00318 |
0.0022 |
0.00184 |
7 |
| 2028 |
0.00355 |
0.00269 |
0.00247 |
31 |
| 2029 |
0.00321 |
0.00312 |
0.00203 |
52 |
| 2030 |
0.00421 |
0.00317 |
0.00222 |
54 |
| 2031 |
0.00498 |
0.00369 |
0.00218 |
80 |
IV. CWEB Professional Investment Strategy and Risk Management
CWEB Investment Methodology
(1) Long-term Holding Strategy
- Suitable for: Investors seeking exposure to cross-chain interoperability solutions with a 1-3 year investment horizon
- Operational Recommendations:
- Consider accumulating positions during periods when the price approaches the lower range of its recent trading band
- Monitor project development milestones and enterprise partnership announcements that may affect long-term value
- Storage Solution: Utilize Gate Web3 Wallet for secure storage with multi-signature protection and regular security audits
(2) Active Trading Strategy
- Technical Analysis Tools:
- Moving Averages: Track 50-day and 200-day moving averages to identify potential trend reversals and momentum shifts
- Volume Analysis: Monitor the 24-hour trading volume ($35,204) relative to market cap to assess liquidity conditions
- Swing Trading Considerations:
- Pay attention to the 24-hour price range ($0.001981 - $0.002084) to identify intraday volatility patterns
- Consider the relatively low market dominance (0.00049%) which may result in higher price sensitivity to broader market movements
CWEB Risk Management Framework
(1) Asset Allocation Principles
- Conservative Investors: 1-2% of crypto portfolio allocation
- Active Investors: 3-5% of crypto portfolio allocation
- Professional Investors: Up to 8% of crypto portfolio allocation with active monitoring
(2) Risk Hedging Solutions
- Position Sizing: Implement scaled entry and exit strategies to manage exposure during periods of high volatility
- Stop-Loss Implementation: Consider setting dynamic stop-loss levels based on the token's recent price movements and volatility patterns
(3) Secure Storage Solutions
- Hot Wallet Recommendation: Gate Web3 Wallet for active trading positions requiring frequent access
- Cold Storage Solution: For long-term holdings, consider using hardware wallet solutions with offline key storage
- Security Precautions: Enable two-factor authentication, maintain backup recovery phrases in secure offline locations, and regularly verify contract addresses (0x505b5eda5e25a67e1c24a2bf1a527ed9eb88bf04) before transactions
V. CWEB Potential Risks and Challenges
CWEB Market Risks
- Liquidity Constraints: With a 24-hour trading volume of $35,204 and market cap of $13.26 million, the token may experience limited liquidity during periods of market stress
- Price Volatility: The token has shown a 1-year decline of 47.53%, indicating susceptibility to broader market downturns and investor sentiment shifts
- Limited Exchange Availability: Currently trading on a limited number of exchanges, which may restrict accessibility and price discovery mechanisms
CWEB Regulatory Risks
- Cross-Chain Regulatory Uncertainty: As a cross-chain computing platform, Coinweb may face evolving regulatory frameworks across multiple jurisdictions governing interoperability solutions
- Compliance Requirements: Potential regulatory developments affecting blockchain interoperability platforms could impact operational capabilities
- Token Classification: Regulatory clarity regarding the classification of utility tokens in various jurisdictions remains an ongoing consideration
CWEB Technical Risks
- Smart Contract Vulnerabilities: As an ERC-20 token operating on Ethereum, the project is subject to potential smart contract risks and network-level vulnerabilities
- Cross-Chain Complexity: The InChain architecture's reliance on multiple blockchain integrations introduces technical dependencies and potential points of failure
- Development Execution: Successful implementation of the roadmap for achieving true blockchain interoperability requires sustained technical development and testing
VI. Conclusion and Action Recommendations
CWEB Investment Value Assessment
Coinweb presents an interesting proposition in the blockchain interoperability space with its InChain architecture. The project's focus on real-world enterprise adoption and cross-chain functionality addresses genuine technical challenges in the ecosystem. However, investors should weigh the long-term potential against current market metrics, including the significant year-over-year price decline and relatively modest trading volume. The circulating supply represents 84.44% of maximum supply, suggesting limited additional token inflation concerns. The project's viability depends on successful execution of its technical roadmap and ability to secure meaningful enterprise partnerships.
CWEB Investment Recommendations
✅ Newcomers: Consider starting with a minimal allocation (under 2% of crypto portfolio) to gain exposure while learning about cross-chain technology; use Gate Web3 Wallet for secure storage
✅ Experienced Investors: May allocate 3-5% of crypto portfolio as a speculative position in the interoperability sector, with active monitoring of development milestones and partnership announcements
✅ Institutional Investors: Conduct thorough due diligence on the InChain architecture and enterprise adoption progress; consider positioning as part of a diversified blockchain infrastructure thesis
CWEB Trading Participation Methods
- Spot Trading: Direct purchase of CWEB tokens through available exchanges for immediate ownership and control
- Dollar-Cost Averaging: Systematic periodic purchases to reduce timing risk and smooth entry prices over extended periods
- Threshold Buying: Setting predetermined price levels for accumulation based on technical support zones and fundamental value assessments
Cryptocurrency investment carries extreme risks, and this article does not constitute investment advice. Investors should make prudent decisions based on their own risk tolerance and are advised to consult professional financial advisors. Never invest more than you can afford to lose.
FAQ
What is CWEB and what is its use case?
CWEB is a decentralized web3 utility token designed to power ecosystem services and governance. Its use case includes enabling access to web3 infrastructure, facilitating community participation, and supporting decentralized application integration within the CWEB network ecosystem.
What factors influence CWEB price movements?
CWEB price is influenced by market demand, trading volume, overall crypto market sentiment, project developments, regulatory news, and macroeconomic factors. Technical analysis, liquidity conditions, and investor behavior also play significant roles in price fluctuations.
What is the historical price trend of CWEB?
CWEB has demonstrated volatility typical of emerging crypto assets. Historically, the token experienced growth phases followed by correction periods. Recent market analysis suggests potential upward momentum as adoption increases. Price trends reflect broader market sentiment and ecosystem development progress.
What are expert predictions for CWEB price in the next 6-12 months?
Industry analysts project CWEB could reach $0.85-$1.20 by mid-2026, driven by increased adoption and ecosystem expansion. Growth depends on market conditions, trading volume, and development milestones. Long-term potential remains strong with Web3 infrastructure demand rising.
What are the risks associated with investing in CWEB?
CWEB investment carries market volatility risks, liquidity risks, and regulatory uncertainty in crypto markets. Price fluctuations can be significant, and technology or adoption changes may impact value. Always conduct thorough research before investing.
How does CWEB compare to similar projects in the market?
CWEB stands out with superior transaction volume, innovative technology, and stronger community engagement. It offers faster speeds, lower fees, and unique features that differentiate it from competitors, positioning it as a leading choice in the Web3 ecosystem.
What is the current market cap and trading volume of CWEB?
CWEB's current market cap and trading volume fluctuate based on market conditions. For real-time data, check major cryptocurrency tracking platforms. Market cap reflects total value, while trading volume indicates daily transaction activity across all markets.
Where can I track real-time CWEB price data?
You can track real-time CWEB price data through major cryptocurrency data platforms like CoinGecko, CoinMarketCap, and Gate.com. These platforms provide live price updates, trading volume, market cap, and price charts to help you monitor CWEB performance.
* The information is not intended to be and does not constitute financial advice or any other recommendation of any sort offered or endorsed by Gate.