This article provides comprehensive analysis of DIA (Decentralized Information Asset) token, examining its market position, historical performance, and price forecasts from 2026 to 2031. Currently trading at $0.2699 with a $32.30 million market cap, DIA operates as a decentralized oracle platform providing verified financial data for DeFi protocols. The analysis covers historical price evolution, current market sentiment (extreme fear at index 24), token distribution dynamics, and detailed price scenarios across five years. Professional investment strategies include long-term holding through dollar-cost averaging and active trading with technical analysis. The article emphasizes risk management through diversified allocation (1-10% of crypto portfolio) and secure storage solutions via Gate.com. Key risks include volatility, liquidity constraints, and regulatory uncertainties. Suitable for beginners, experienced, and institutional investors seeking infrastructure exposure with appropriate risk awareness.
Introduction: DIA's Market Position and Investment Value
DIA (DIA) serves as a decentralized information asset platform providing oracle services for financial data verification and distribution. Since its launch in 2020, DIA has established itself within the blockchain data infrastructure ecosystem. As of January 2026, DIA maintains a market capitalization of approximately $32.30 million, with a circulating supply of around 119.68 million tokens, and the price holding near $0.27. This governance token, recognized as a "decentralized oracle solution," is playing an increasingly vital role in providing verified financial data and supporting DeFi protocols.
This article will comprehensively analyze DIA's price trajectory from 2026 to 2031, combining historical patterns, market supply and demand dynamics, ecosystem development, and macroeconomic conditions to provide investors with professional price forecasts and practical investment strategies.
I. DIA Price History Review and Market Status
DIA Historical Price Evolution Trajectory
- 2020: DIA launched on August 3, 2020 with an initial price of $0.05, marking the beginning of its journey as a decentralized oracle platform
- 2021: The token reached its all-time high of $5.73 on May 5, 2021, representing a significant milestone during the broader crypto market bull run
- 2023: Price declined to its all-time low of $0.208951 on September 2, 2023, reflecting the challenging market conditions during the crypto winter period
DIA Current Market Situation
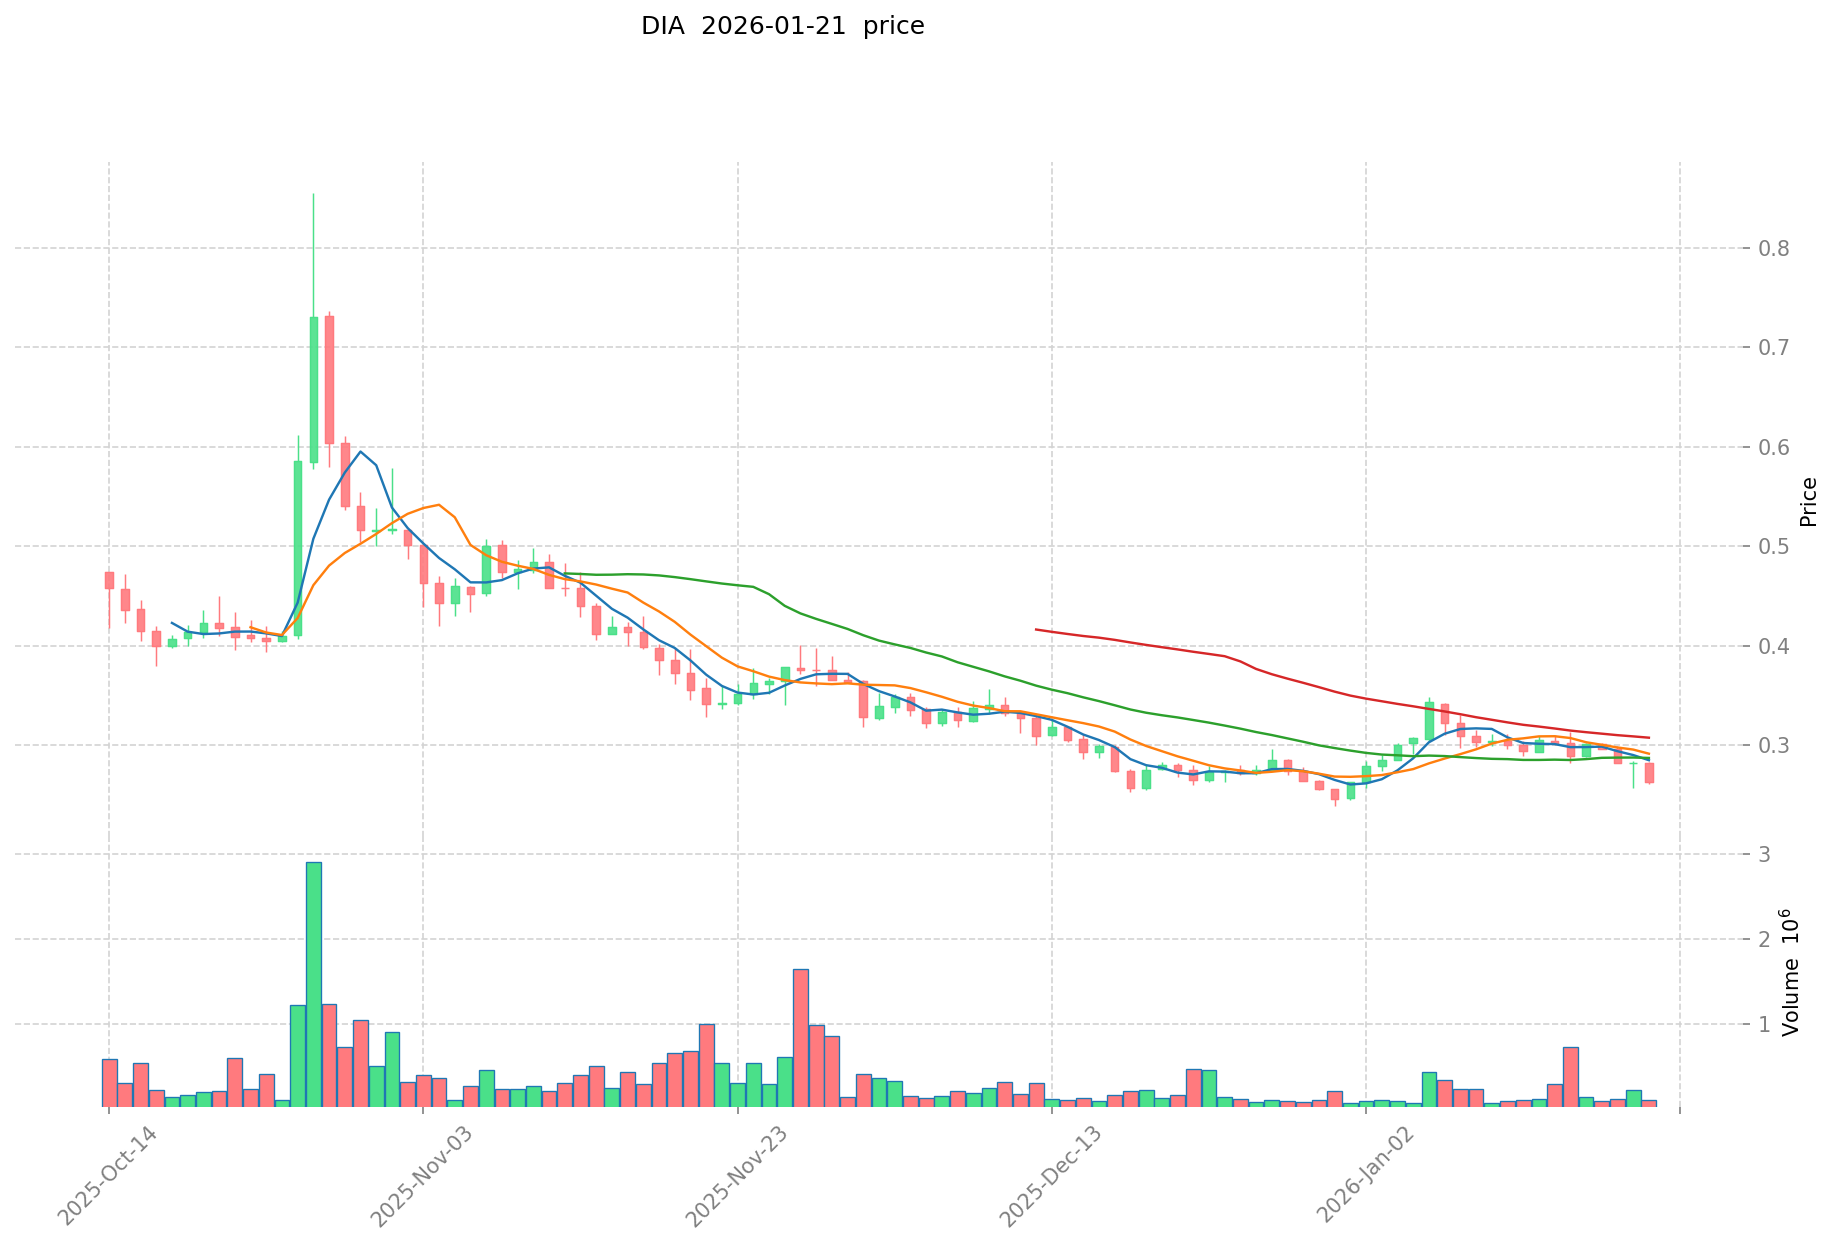
As of January 21, 2026, DIA is trading at $0.2699, positioning itself slightly above its historical low. The token demonstrates notable short-term volatility, with a 0.92% increase over the past hour, contrasting with a 3.81% decline over the 24-hour period. The 7-day performance shows an 11.74% decrease, while the monthly performance reflects a 1.39% decline.
Over the annual timeframe, DIA has experienced a substantial decrease of 55.16%, indicating prolonged market pressure. The 24-hour trading volume stands at $25,465.21, with price fluctuations between $0.261 and $0.2831 throughout the day.
DIA maintains a market capitalization of approximately $32.30 million, with a circulating supply of 119,676,104 tokens, representing 59.84% of the total supply of 168,817,248 tokens. The maximum supply is capped at 200,000,000 tokens. The fully diluted market cap reaches $45.56 million, and the token holds a market dominance of 0.0014%.
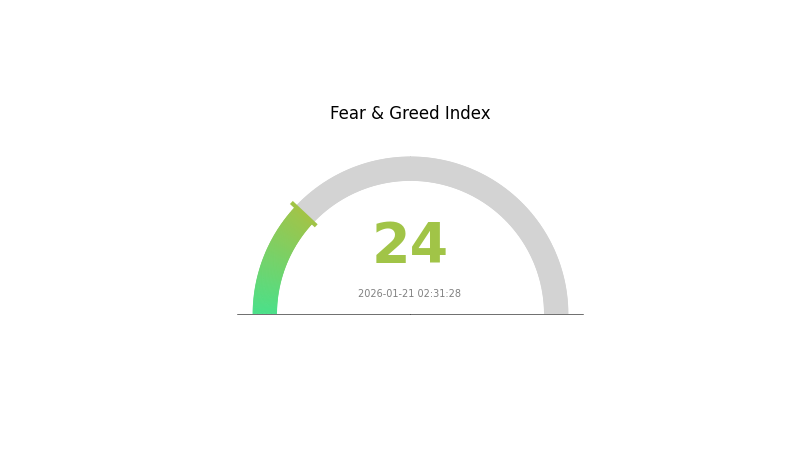
The current market sentiment index registers at 24, indicating an "Extreme Fear" condition in the broader cryptocurrency market. DIA is listed on 23 exchanges and has approximately 24,717 token holders. The token is available for trading on Gate.com and operates primarily on the Ethereum blockchain.
Click to view current DIA market price
DIA Market Sentiment Index
2026-01-21 Fear and Greed Index: 24 (Extreme Fear)
Click to view current Fear & Greed Index
The cryptocurrency market is currently experiencing extreme fear, with the Fear and Greed Index dropping to 24. This reading indicates significant market pessimism and heightened investor anxiety. During such periods, risk-averse traders typically reduce exposure, while contrarian investors may view extreme fear as a potential buying opportunity. Market volatility tends to remain elevated under these conditions. Traders should exercise caution and conduct thorough due diligence before making investment decisions during extreme fear phases.
DIA Token Holding Distribution
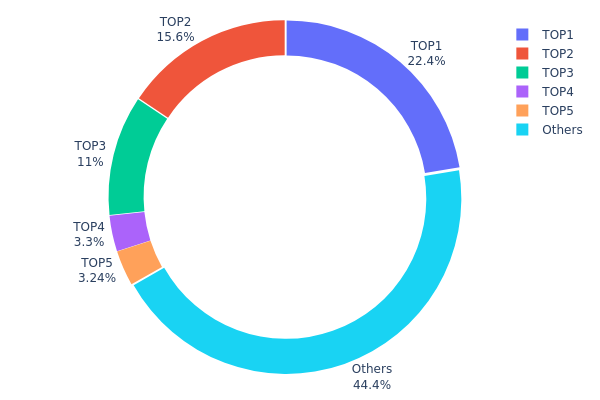
The address holding distribution chart represents the allocation of DIA tokens across different wallet addresses on the blockchain, providing insight into the decentralization level and concentration risk of token ownership. This metric is crucial for evaluating market structure stability and potential price manipulation risks, as highly concentrated holdings may indicate greater vulnerability to single-party influence on market dynamics.
According to the current data, DIA's token distribution exhibits significant concentration characteristics. The top holder controls 44,823.29K tokens (22.41%), while the burn address (0x0000...00dead) holds 15.63%, effectively removing these tokens from circulation. The third-largest address holds 11.04%, bringing the top three addresses to a combined 49.08% of total supply. The top five addresses collectively control 55.61% of tokens, with the remaining 44.39% distributed among other addresses. This distribution pattern indicates moderate to high concentration, where a relatively small number of entities maintain substantial control over the circulating supply.
From a market structure perspective, this concentration level presents both opportunities and concerns. The significant burn allocation (15.63%) demonstrates a deflationary mechanism that may support long-term value appreciation. However, the substantial holdings by the top addresses could introduce heightened volatility risk, as large-scale movements by these entities could significantly impact market liquidity and price stability. The relatively balanced distribution among smaller holders (44.39%) provides some buffer against complete centralization, yet the dominant positions of major holders suggest potential vulnerability to coordinated actions or single-party market influence.
Click to view current DIA Token Holding Distribution
| Top |
Address |
Holding Qty |
Holding (%) |
| 1 |
0x7170...9cbc85 |
44823.29K |
22.41% |
| 2 |
0x0000...00dead |
31267.41K |
15.63% |
| 3 |
0xf977...41acec |
22083.54K |
11.04% |
| 4 |
0x785a...df12c1 |
6593.79K |
3.29% |
| 5 |
0x21a2...8e616c |
6489.15K |
3.24% |
| - |
Others |
88742.81K |
44.39% |
II. Core Factors Affecting DIA's Future Price
Due to the lack of available data in the provided materials regarding DIA's supply mechanisms, institutional dynamics, macroeconomic factors, and technical developments, a comprehensive analysis of the core factors affecting DIA's future price cannot be completed at this time. Investors are advised to conduct thorough research through official channels and multiple reliable sources before making any investment decisions.
III. 2026-2031 DIA Price Forecast
2026 Outlook
- Conservative estimate: $0.1375 - $0.2696
- Neutral estimate: $0.2696
- Optimistic estimate: up to $0.2804 (requires favorable market conditions and increased adoption)
2027-2029 Outlook
- Market stage expectation: The token may experience gradual growth as the DeFi oracle sector matures and institutional demand for reliable data feeds increases
- Price range forecast:
- 2027: $0.2007 - $0.3355
- 2028: $0.2289 - $0.3999
- 2029: $0.2397 - $0.4054
- Key catalysts: Integration with major blockchain protocols, expansion of oracle service offerings, and broader acceptance of decentralized data solutions in traditional finance sectors
2030-2031 Long-term Outlook
- Baseline scenario: $0.3108 - $0.4624 (assuming steady ecosystem development and sustained market interest)
- Optimistic scenario: $0.3790 - $0.5848 (requires significant protocol upgrades and widespread institutional adoption)
- Transformational scenario: potential to reach upper bounds of $0.5848 in 2031 (contingent upon breakthrough partnerships and dominant market position in oracle services)
- January 21, 2026: DIA current analysis baseline established for multi-year projection framework
| Year |
Predicted High Price |
Predicted Average Price |
Predicted Low Price |
Price Change |
| 2026 |
0.28038 |
0.2696 |
0.1375 |
0 |
| 2027 |
0.33549 |
0.27499 |
0.20074 |
1 |
| 2028 |
0.39987 |
0.30524 |
0.22893 |
13 |
| 2029 |
0.40544 |
0.35255 |
0.23974 |
30 |
| 2030 |
0.46237 |
0.379 |
0.31078 |
40 |
| 2031 |
0.58475 |
0.42068 |
0.22296 |
55 |
IV. DIA Professional Investment Strategy and Risk Management
DIA Investment Methodology
(1) Long-term Holding Strategy
- Suitable for: Investors who believe in the long-term value of decentralized oracle infrastructure and are comfortable with moderate volatility
- Operational Recommendations:
- Accumulate positions during market dips when DIA trades below $0.25, considering its historical low of $0.208951
- Maintain holdings through market cycles, focusing on fundamental developments in the oracle data sector
- Implement dollar-cost averaging (DCA) monthly with 5-10% of crypto allocation to smooth entry points
- Storage Solution: Use Gate Web3 Wallet for secure self-custody with multi-signature protection, or keep a portion on Gate.com for liquidity needs
(2) Active Trading Strategy
- Technical Analysis Tools:
- Moving Averages: Monitor 50-day and 200-day moving averages; DIA's recent 7-day decline of 11.74% suggests potential oversold conditions for swing traders
- Volume Analysis: Track 24-hour volume ($25,465) relative to historical averages to identify accumulation or distribution phases
- Support/Resistance Levels: Current 24H range ($0.261-$0.2831) provides clear short-term trading boundaries
- Swing Trading Key Points:
- Enter positions near the $0.26 support level with 2-3% risk per trade
- Set profit targets at resistance levels around $0.28-$0.30 based on recent price action
- Use stop-loss orders 5-7% below entry to protect capital during volatile periods
DIA Risk Management Framework
(1) Asset Allocation Principles
- Conservative Investors: 1-2% of total crypto portfolio
- Aggressive Investors: 3-5% of total crypto portfolio
- Professional Investors: Up to 8-10% of crypto portfolio with active hedging strategies
(2) Risk Hedging Solutions
- Diversification Approach: Combine DIA holdings with other oracle and infrastructure tokens to reduce sector-specific risk
- Position Sizing: Limit single position to no more than 5% of total crypto holdings given DIA's 0.0014% market dominance
- Rebalancing Strategy: Review and adjust positions quarterly based on market cap changes and project developments
(3) Secure Storage Solutions
- Hot Wallet Recommendation: Gate Web3 Wallet for active trading needs with built-in security features and seamless Gate.com integration
- Cold Storage Solution: Hardware wallet storage for long-term holdings exceeding $1,000 worth of DIA tokens
- Security Considerations: Enable two-factor authentication, regularly update wallet software, never share private keys, and be cautious of phishing attempts targeting DIA holders
V. DIA Potential Risks and Challenges
DIA Market Risks
- Volatility Risk: DIA has experienced significant price fluctuation, declining 55.16% over the past year from higher levels, indicating substantial market volatility that may result in rapid value changes
- Liquidity Risk: With a market cap of approximately $32.3 million and ranking at #685, DIA has relatively lower liquidity compared to top-tier assets, potentially leading to wider spreads during market stress
- Competition Risk: The oracle data sector faces increasing competition from established players, which may impact DIA's market share and adoption rate over time
DIA Regulatory Risks
- Data Service Classification: Regulatory uncertainty surrounding how decentralized oracle services are classified could impact DIA's operational model and token utility
- Token Governance Framework: Evolving regulations on governance tokens may require adjustments to DIA's voting and staking mechanisms
- Cross-border Data Compliance: As DIA provides financial data services globally, changes in international data protection and financial reporting regulations could affect platform operations
DIA Technical Risks
- Oracle Accuracy Risk: The reliability of DIA's data feeds depends on validator participation and data quality; compromised data sources could affect oracle precision
- Smart Contract Vulnerabilities: Despite being an established project, smart contract risks remain, particularly with upgrades or new feature implementations
- Network Dependencies: As an Ethereum-based token (contract: 0x84cA8bc7997272c7CfB4D0Cd3D55cd942B3c9419), DIA is subject to Ethereum network congestion and gas fee fluctuations that may impact transaction costs
- Centralization Concerns: With approximately 24,717 holders and 59.84% of total supply in circulation, token distribution concentration could pose governance risks
VI. Conclusion and Action Recommendations
DIA Investment Value Assessment
DIA represents a specialized infrastructure play in the decentralized oracle space, offering exposure to the growing demand for reliable off-chain data in DeFi ecosystems. With a current price of $0.2699, the token trades significantly below its all-time high of $5.73 (May 2021), presenting potential upside for risk-tolerant investors who believe in oracle infrastructure recovery. However, the project's relatively small market cap ($32.3 million), recent negative price momentum (down 11.74% over 7 days), and competitive market position require careful consideration. The governance token model provides utility through data validation, voting rights, and platform access, but adoption metrics and revenue generation remain critical factors for long-term value.
DIA Investment Recommendations
✅ Beginners: Allocate no more than 1-2% of your crypto portfolio to DIA after thoroughly researching oracle technology and understanding the high-risk nature of small-cap tokens. Consider starting with a small position on Gate.com to learn market dynamics.
✅ Experienced Investors: DIA may fit as a 3-5% speculative allocation for those building diversified exposure to blockchain infrastructure. Employ DCA strategies during market weakness and monitor project development milestones for validation signals.
✅ Institutional Investors: Conduct comprehensive due diligence on DIA's data partnerships, validator network growth, and competitive positioning. Consider DIA as part of a broader oracle sector thesis with appropriate hedging and position sizing relative to sector allocation targets.
DIA Trading Participation Methods
- Spot Trading: Purchase DIA directly on Gate.com with competitive fees and deep liquidity, suitable for long-term accumulation or short-term position trading
- Staking Participation: Explore DIA's native staking mechanisms for validator participation and governance rights, which may provide additional utility beyond price appreciation
- API Data Access: For developers and institutional users, acquire DIA tokens to access premium real-time oracle data services, creating natural demand-side utility
Cryptocurrency investment carries extreme risk, and this article does not constitute investment advice. Investors should make cautious decisions based on their own risk tolerance and are advised to consult professional financial advisors. Never invest more than you can afford to lose.
FAQ
What is DIA token's historical price trend and current price position?
DIA token has demonstrated significant volatility since inception. Historically, it peaked during 2021 bull market, then consolidated through 2022-2023. Currently in 2026, DIA trades around mid-range levels showing recovery momentum. The token has built stronger utility through oracle services, supporting gradual price appreciation. Monitor trading volume for trend confirmation.
What are the main factors affecting DIA price?
DIA price is influenced by market demand, trading volume, broader crypto market trends, adoption rate of DIA's oracle services, competitive landscape, regulatory developments, and macroeconomic conditions affecting the cryptocurrency sector.
What are the core functions and application scenarios of the DIA project?
DIA is a decentralized data oracle providing real-time price feeds and market data for cryptocurrencies and assets. Its core functions include data aggregation, price prediction, and risk assessment across DeFi protocols, derivatives platforms, and lending markets, enabling transparent and accurate on-chain pricing solutions.
How will DIA price predictions look in 2024, and what do professional institutions think?
DIA showed strong fundamentals in 2024 with increased adoption in oracle solutions. Major institutions remained optimistic about its long-term potential, predicting steady growth driven by expanding DeFi ecosystem demands and enhanced data validation features.
What are DIA's advantages compared to other oracle projects like Chainlink and Band Protocol?
DIA offers decentralized price feeds with community-driven data sourcing, lower costs, and real-time market data across multiple blockchains. It provides transparent, customizable oracle solutions with higher flexibility for Web3 applications.
What are DIA's circulating supply and total supply, and how is the tokenomics structured?
DIA has a total supply of 200 million tokens. The circulating supply represents actively traded tokens in the market. The tokenomics features a deflationary mechanism with governance rights for holders, supporting ecosystem sustainability and community participation in protocol decisions.
What are the risks I need to pay attention to when investing in DIA?
DIA price volatility is high due to market sentiment changes. Liquidity risks exist during extreme market conditions. Smart contract risks and regulatory uncertainty in crypto markets are present. Diversify your portfolio and only invest capital you can afford to lose.
* The information is not intended to be and does not constitute financial advice or any other recommendation of any sort offered or endorsed by Gate.