This comprehensive guide analyzes EDEN (OpenEden) price trends from 2026 to 2031, providing expert forecasts for the leading RWA tokenization platform. The article examines EDEN's current market position at $0.05603 with a $10.30M market cap, reviews historical price evolution, and delivers scenario-based predictions ranging from conservative ($0.0477) to optimistic ($0.10753 by 2031). It outlines professional investment strategies including long-term holding and active trading approaches, with detailed risk management frameworks for different investor profiles. The analysis addresses market risks including 94.43% decline from ATH, liquidity concerns, and regulatory uncertainties specific to tokenized assets. Practical recommendations guide beginners through institutional investors, emphasizing secure storage on Gate Web3 Wallet and portfolio allocation principles. Essential reading for investors evaluating RWA sector exposure.
Introduction: EDEN's Market Position and Investment Value
OpenEden (EDEN), as a leading real-world asset (RWA) tokenization platform, has been bridging traditional and decentralized finance since its founding in 2022. As of 2026, EDEN maintains a market capitalization of approximately $10.30 million, with a circulating supply of around 183.87 million tokens, and the price hovering at $0.05603. This asset, recognized as a "compliant gateway to tokenized RWA," is playing an increasingly vital role in redefining financial access through secure and transparent on-chain solutions.
This article will comprehensively analyze EDEN's price trends from 2026 to 2031, combining historical patterns, market supply and demand dynamics, ecosystem development, and macroeconomic conditions to provide investors with professional price forecasts and practical investment strategies.
I. EDEN Price History Review and Market Status
EDEN Historical Price Evolution Trajectory
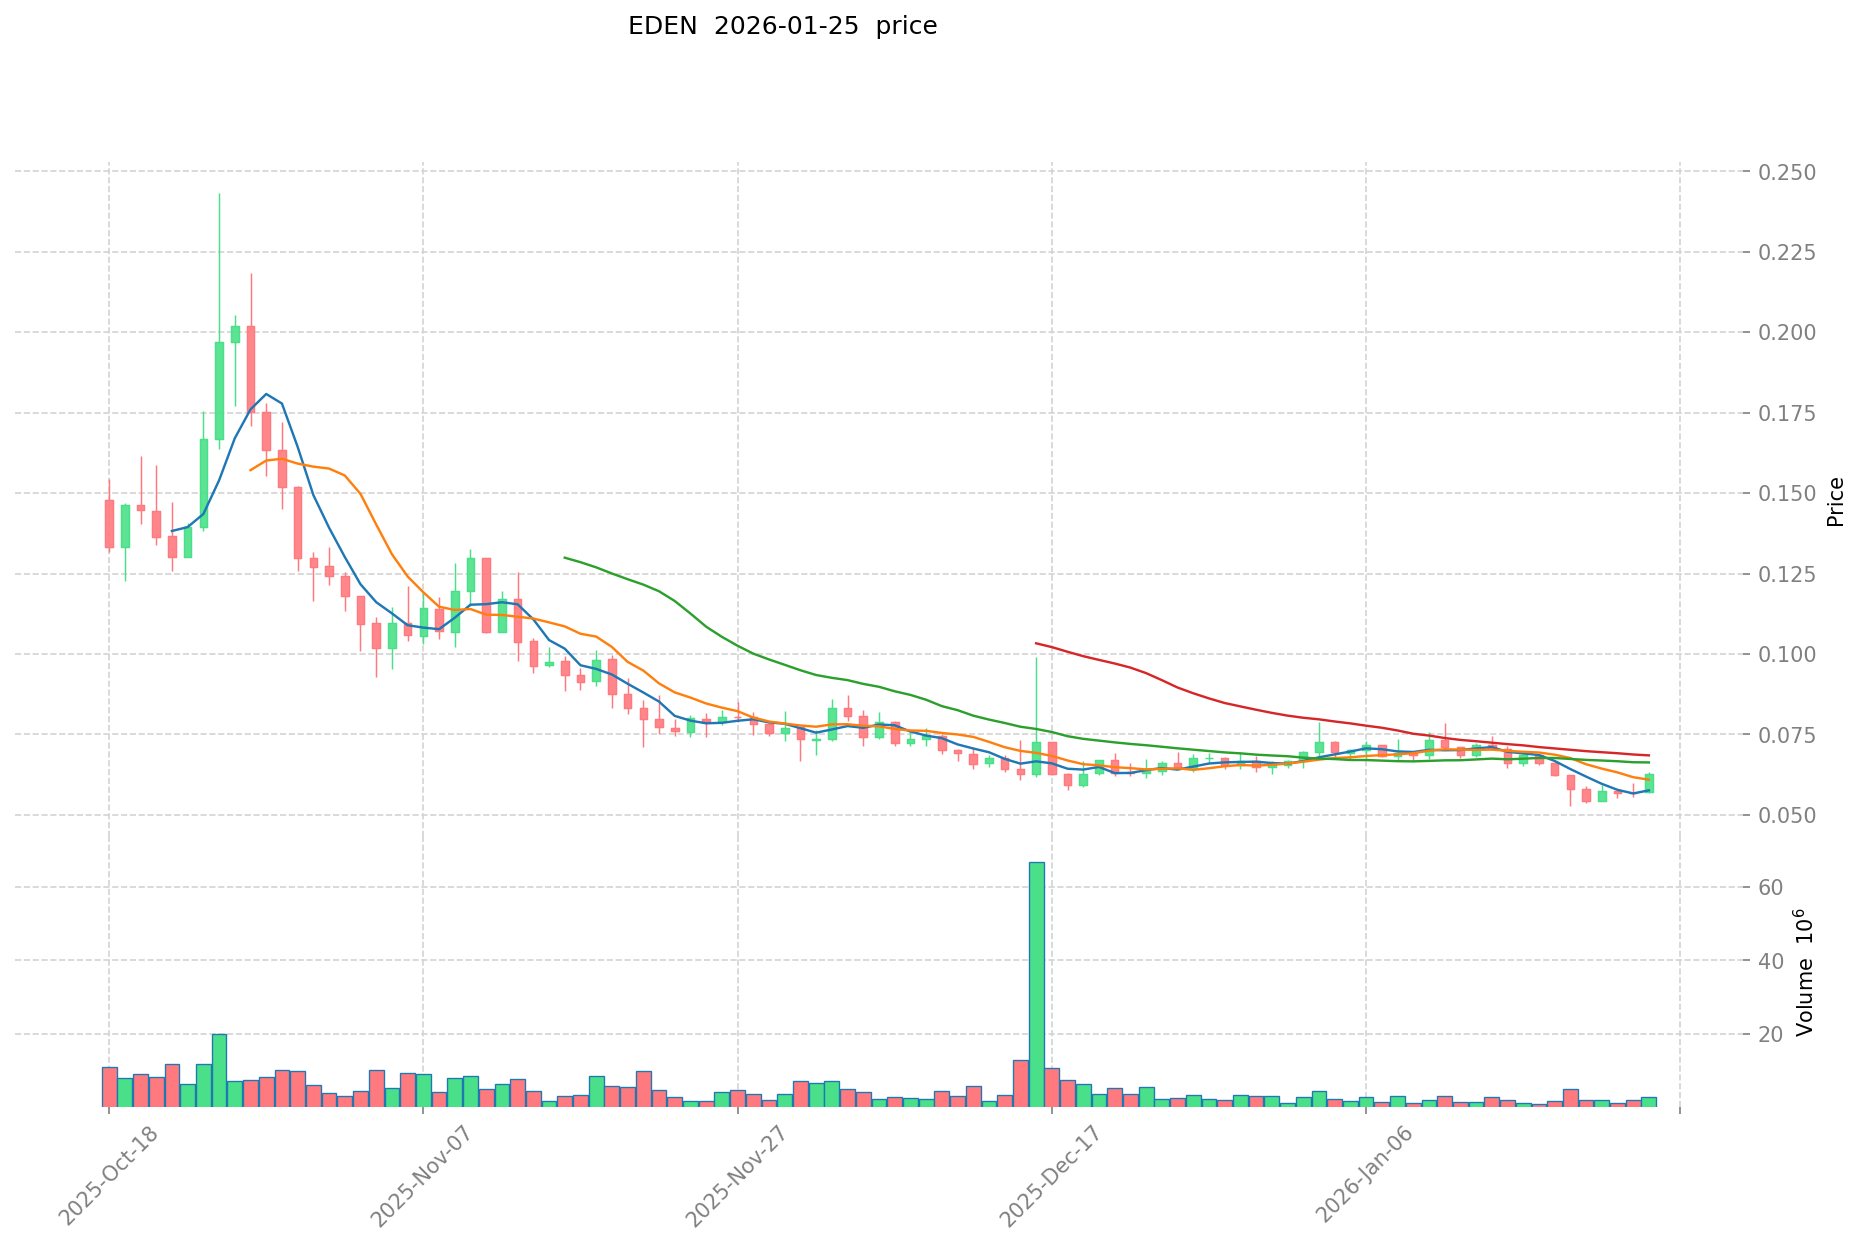
- 2025: Token launched on September 30, reaching an all-time high of $1.1123 during its initial trading period, demonstrating strong market interest in the real-world asset tokenization platform
- 2026: Market entered a correction phase, with price declining from previous highs to $0.05268 on January 19, representing a notable adjustment in valuation
EDEN Current Market Situation
As of January 26, 2026, EDEN is trading at $0.05603, showing a 24-hour decline of 8.01% with trading volume reaching $539,324.86. The token has experienced downward pressure across multiple timeframes, with a 7-day decrease of 15.22% and a 30-day decline of 16.56%. Over the past year, the price has decreased by 94.43% from its all-time high.
The current market capitalization stands at $10.30 million, with a circulating supply of 183.87 million tokens representing 18.39% of the total supply of 1 billion tokens. The fully diluted market cap is calculated at $56.03 million. EDEN's market dominance remains at 0.0018%, with the token being listed on 22 exchanges and held by 5,386 addresses.
The 24-hour price range spans from $0.05552 to $0.06672, indicating moderate intraday volatility. The token operates on multiple blockchain networks, with contract addresses deployed on both Ethereum (ETH) and Binance Smart Chain (BSC), providing users with cross-chain accessibility options.
Click to view current EDEN market price
EDEN Market Sentiment Index
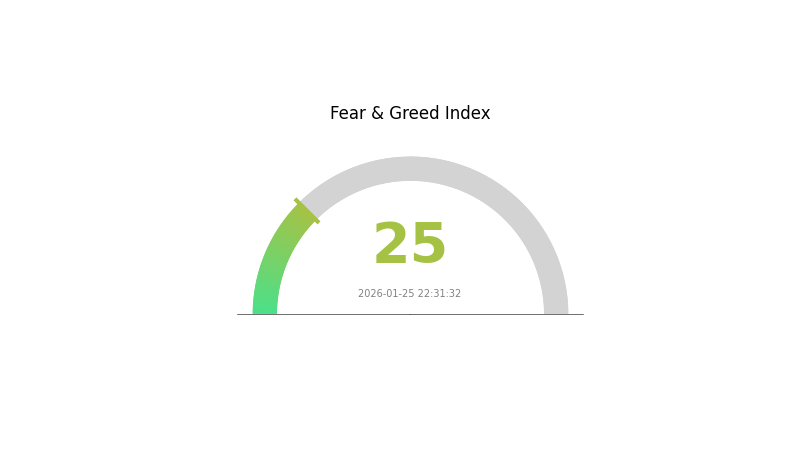
01-25-2026 Fear and Greed Index: 25 (Extreme Fear)
Click to view current Fear & Greed Index
The crypto market is currently experiencing extreme fear, with the Fear and Greed Index at 25. This indicates heightened market anxiety and pessimistic sentiment among investors. During such periods, market volatility typically increases as participants reassess positions and risk exposure. For traders, extreme fear can present both challenges and opportunities. Conservative investors may wait for stabilization signals, while experienced traders often identify potential entry points during panic selling. It is essential to maintain disciplined risk management and avoid emotional decision-making when market sentiment reaches such extreme levels.
EDEN Holding Distribution
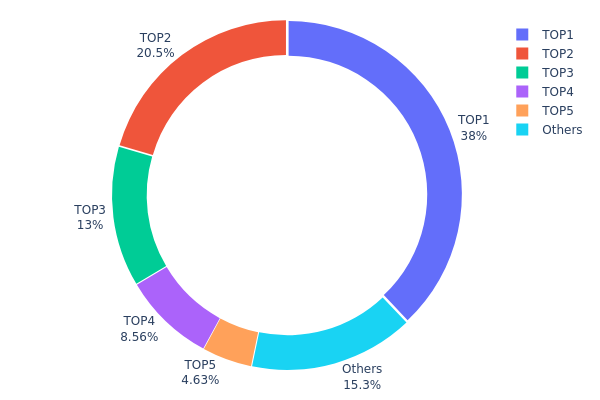
The holding distribution chart reflects the concentration of token holdings across different wallet addresses, serving as a key indicator of market structure and decentralization. By analyzing the proportion of tokens held by top addresses, we can assess the degree of concentration, potential manipulation risks, and overall health of the token's on-chain ecosystem.
According to the current data, EDEN exhibits a highly concentrated holding pattern. The top address controls 352,800K tokens, accounting for 37.95% of the total supply, while the top 5 addresses collectively hold 787,178.95K tokens, representing 84.65% of the circulating supply. This extreme concentration indicates that a small number of entities possess decisive influence over the token's market dynamics. The remaining 15.35% is distributed among other addresses, suggesting limited participation from retail investors and a fragmented secondary market structure.
Such high concentration poses significant risks to price stability and market fairness. The dominant holders have the capability to execute large-scale sell-offs or strategic accumulation, potentially triggering sharp price volatility or creating artificial market conditions. Furthermore, this distribution pattern reflects weak decentralization, with the token's governance and liquidity highly dependent on the behavior of a few major holders. From a risk management perspective, investors should remain vigilant about potential sudden liquidity events and recognize that the current on-chain structure lacks the robustness typically associated with mature, widely distributed crypto assets.
Click to view the current EDEN Holding Distribution
| Top |
Address |
Holding Qty |
Holding (%) |
| 1 |
0x80aa...0afbe8 |
352800.00K |
37.95% |
| 2 |
0x7ffd...d5ec66 |
190559.64K |
20.49% |
| 3 |
0x7e6c...65af23 |
121219.31K |
13.03% |
| 4 |
0xad11...d7e7ff |
79600.00K |
8.56% |
| 5 |
0xf977...41acec |
43000.00K |
4.62% |
| - |
Others |
142449.04K |
15.35% |
II. Core Factors Influencing EDEN's Future Price
Due to the lack of available data in the provided materials regarding EDEN's supply mechanisms, institutional dynamics, macroeconomic factors, and technical developments, a comprehensive analysis cannot be completed at this time. Investors are advised to conduct thorough research through official channels and multiple reliable sources before making any investment decisions.
III. 2026-2031 EDEN Price Prediction
2026 Outlook
- Conservative Prediction: $0.0477 - $0.05612
- Neutral Prediction: $0.05612
- Optimistic Prediction: $0.06342 (requires favorable market conditions and increased adoption)
2027-2029 Outlook
- Market Stage Expectation: Gradual growth phase with moderate volatility, potentially driven by ecosystem development and broader market recovery
- Price Range Prediction:
- 2027: $0.04781 - $0.06634
- 2028: $0.03909 - $0.07504
- 2029: $0.05662 - $0.09873
- Key Catalysts: Technology upgrades, strategic partnerships, user base expansion, and overall cryptocurrency market sentiment
2030-2031 Long-term Outlook
- Base Scenario: $0.08137 - $0.10151 (assuming steady ecosystem growth and market stability)
- Optimistic Scenario: $0.08389 - $0.10753 (with accelerated adoption and positive regulatory developments)
- Transformative Scenario: Potential to reach upper bounds if breakthrough innovations or mainstream institutional adoption occurs
- 2026-01-26: EDEN baseline price range established at $0.0477 - $0.06342 (early prediction cycle)
| Year |
Predicted High Price |
Predicted Average Price |
Predicted Low Price |
Price Change |
| 2026 |
0.06342 |
0.05612 |
0.0477 |
0 |
| 2027 |
0.06634 |
0.05977 |
0.04781 |
6 |
| 2028 |
0.07504 |
0.06306 |
0.03909 |
12 |
| 2029 |
0.09873 |
0.06905 |
0.05662 |
23 |
| 2030 |
0.10151 |
0.08389 |
0.08137 |
49 |
| 2031 |
0.10753 |
0.0927 |
0.05655 |
65 |
IV. EDEN Professional Investment Strategy and Risk Management
EDEN Investment Methodology
(1) Long-Term Holding Strategy
- Target Investors: Investors seeking exposure to tokenized real-world assets with a focus on regulatory compliance and stability
- Operational Recommendations:
- Consider accumulating positions during periods of price weakness, particularly when the token trades near support levels around $0.055
- Monitor OpenEden's ongoing development of tokenized RWA products and strategic partnerships that could enhance long-term value
- Utilize Gate Web3 Wallet for secure storage, enabling easy management while maintaining control over private keys
(2) Active Trading Strategy
- Technical Analysis Tools:
- Moving Averages: Track 7-day and 30-day moving averages to identify trend reversals; current downtrend (-15.22% over 7 days) suggests caution
- Volume Analysis: Monitor the 24-hour trading volume of approximately $539,324 for signs of accumulation or distribution patterns
- Swing Trading Key Points:
- Set stop-loss orders below recent lows around $0.0526 to manage downside risk
- Consider taking partial profits during rallies toward resistance levels near $0.067
EDEN Risk Management Framework
(1) Asset Allocation Principles
- Conservative Investors: 1-2% of crypto portfolio allocation
- Aggressive Investors: 3-5% of crypto portfolio allocation
- Professional Investors: 5-10% of crypto portfolio allocation, with active hedging strategies
(2) Risk Hedging Solutions
- Portfolio Diversification: Balance EDEN holdings with established cryptocurrencies and stablecoins to reduce concentration risk
- Position Sizing: Limit individual position size based on personal risk tolerance and the token's historical volatility
(3) Secure Storage Solutions
- Hot Wallet Recommendation: Gate Web3 Wallet for active trading and convenient access to DeFi applications
- Cold Storage Solution: Consider hardware wallet storage for long-term holdings exceeding 25% of total EDEN position
- Security Precautions: Enable two-factor authentication, regularly update wallet software, and never share private keys or seed phrases
V. EDEN Potential Risks and Challenges
EDEN Market Risks
- Price Volatility: EDEN has experienced a substantial decline of 94.43% from its all-time high of $1.1123, indicating significant market volatility
- Low Liquidity: With a 24-hour trading volume of approximately $539,324 and presence on 22 exchanges, liquidity may be limited during periods of market stress
- Market Sentiment: Current market share of 0.0018% reflects limited mainstream adoption and potential susceptibility to broader market movements
EDEN Regulatory Risks
- RWA Tokenization Framework: Evolving global regulations surrounding real-world asset tokenization could impact OpenEden's business model
- Cross-Jurisdiction Compliance: Operating through entities in BVI and Bermuda requires adherence to multiple regulatory frameworks, which may change
- Securities Classification: Potential reclassification of tokenized assets could affect EDEN's regulatory status and trading accessibility
EDEN Technical Risks
- Smart Contract Security: As EDEN operates on ETH and BSC chains, smart contract vulnerabilities could expose holders to potential exploits
- Platform Dependency: The token's utility is closely tied to OpenEden's platform performance and continued operation
- Integration Challenges: Technical difficulties in bridging traditional finance and DeFi could impact the platform's value proposition
VI. Conclusion and Action Recommendations
EDEN Investment Value Assessment
EDEN represents an investment opportunity in the emerging RWA tokenization sector, with OpenEden's focus on regulatory compliance and bridging traditional finance with DeFi positioning it within a growing market segment. However, the significant price decline of 94.43% from all-time highs and current downward price trends across multiple timeframes (-8.01% in 24H, -15.22% in 7D, -16.56% in 30D) present substantial short-term risks. The relatively low circulating supply ratio of 18.39% suggests potential future token unlocks that could create selling pressure. Long-term value depends on OpenEden's ability to expand its tokenized RWA offerings and achieve broader market adoption.
EDEN Investment Recommendations
✅ Beginners: Limit exposure to 1-2% of total crypto portfolio; wait for clear signs of price stabilization before initiating positions; prioritize understanding RWA tokenization fundamentals
✅ Experienced Investors: Consider small-scale position building during periods of extreme weakness; implement strict risk management with stop-loss orders; monitor OpenEden's platform development and partnership announcements
✅ Institutional Investors: Evaluate EDEN within broader RWA sector allocation strategy; conduct thorough due diligence on OpenEden's regulatory standing and tokenization framework; consider participating in strategic rounds if available
EDEN Trading Participation Methods
- Spot Trading: Purchase EDEN tokens on Gate.com for direct exposure with straightforward entry and exit
- Dollar-Cost Averaging: Establish regular purchase schedules to minimize timing risk during the current volatile period
- Yield Strategies: Explore potential staking or liquidity provision opportunities as they become available on OpenEden's platform
Cryptocurrency investment carries extremely high risks, and this article does not constitute investment advice. Investors should make cautious decisions based on their own risk tolerance and are advised to consult professional financial advisors. Never invest more than you can afford to lose.
FAQ
What is the current price of EDEN token? What are its historical high and low prices?
EDEN token's current price reflects real-time market dynamics. Historical data shows significant price movements, with all-time highs reached during market peaks and lows during corrections. For precise current pricing and complete historical data, check live market data sources for the most up-to-date information.
What are the main factors affecting EDEN price prediction?
EDEN price is influenced by market demand, trading volume, ecosystem development, tokenomics, overall crypto market sentiment, and adoption rate. Network upgrades and partnership announcements also impact price movements significantly.
2024年和2025年EDEN价格预测会如何发展?
Based on market trends, EDEN demonstrated strong momentum through 2024-2025. Analysts anticipate continued growth driven by ecosystem expansion and increased adoption. Price movements correlate with network development milestones and trading volume surge, suggesting upward trajectory potential in coming quarters.
What advantages does EDEN token have compared to other DeFi tokens?
EDEN offers superior capital efficiency, lower slippage through optimized liquidity pools, and enhanced yield farming returns. Its innovative governance model and community-driven development provide stronger value proposition than traditional DeFi alternatives.
What risks should I pay attention to when investing in EDEN tokens?
EDEN token risks include market volatility, liquidity fluctuations, regulatory uncertainty, and smart contract vulnerabilities. Monitor price movements, project developments, and technical security audits regularly to make informed decisions.
What is the fundamental situation and technical progress of the EDEN project?
EDEN demonstrates strong fundamentals with innovative DeFi protocols and sustainable tokenomics. Technical progress includes enhanced smart contract architecture, improved scalability solutions, and robust ecosystem development. The project shows promising growth trajectory with increasing developer adoption and community engagement.
How to analyze EDEN's technical and fundamental aspects for price prediction?
Analyze EDEN's technical indicators including moving averages, RSI, and support/resistance levels. For fundamentals, examine tokenomics, ecosystem development, community growth, trading volume, and network activity. Monitor on-chain metrics and compare with market trends to forecast price movements.
* The information is not intended to be and does not constitute financial advice or any other recommendation of any sort offered or endorsed by Gate.