This comprehensive analysis examines Elastos (ELA) cryptocurrency's investment landscape through 2031, combining historical price evolution, current market status, and expert forecasts. The article evaluates ELA's position as a decentralized Web 3.0 infrastructure provider, currently trading at $0.8408 with extreme market sentiment. It presents tiered price predictions ranging from conservative to optimistic scenarios, projects gradual growth through 2031 with potential highs exceeding $1.87, and outlines tailored investment strategies for different investor profiles. The analysis incorporates risk management frameworks, security solutions via Gate Web3 Wallet, and identifies critical challenges including volatility, limited liquidity, and regulatory uncertainties. Designed for crypto investors seeking strategic guidance, this forecast balances opportunity assessment with comprehensive risk evaluation for informed decision-making.
Introduction: ELA's Market Position and Investment Value
Elastos (ELA), positioned as a next-generation Web 3.0 platform dedicated to building a decentralized intelligent SmartWeb based on blockchain technology, has been developing its ecosystem since its launch in 2018. As of 2026, Elastos holds a market capitalization of approximately $19.39 million, with a circulating supply of about 23.06 million tokens, and the price maintains around $0.84. This asset, recognized as a "decentralized SmartWeb infrastructure provider," is playing an increasingly important role in the fields of decentralized identity, communication, storage, and distributed application platforms.
This article will comprehensively analyze ELA's price trends from 2026 to 2031, combining historical patterns, market supply and demand dynamics, ecosystem development, and macroeconomic environment factors to provide investors with professional price forecasts and practical investment strategies.
I. ELA Price History Review and Market Status
ELA Historical Price Evolution Trajectory
- February 2018: ELA reached a notable price level of $89.14 during the broader cryptocurrency market rally, marking a significant milestone in its early trading history.
- January 2023: Following the prolonged crypto market downturn, ELA price declined to $0.793867, representing a substantial correction from previous highs.
- January 2026: The token is trading at $0.8408, showing gradual recovery from the January 2023 lows but remaining substantially below historical peak levels.
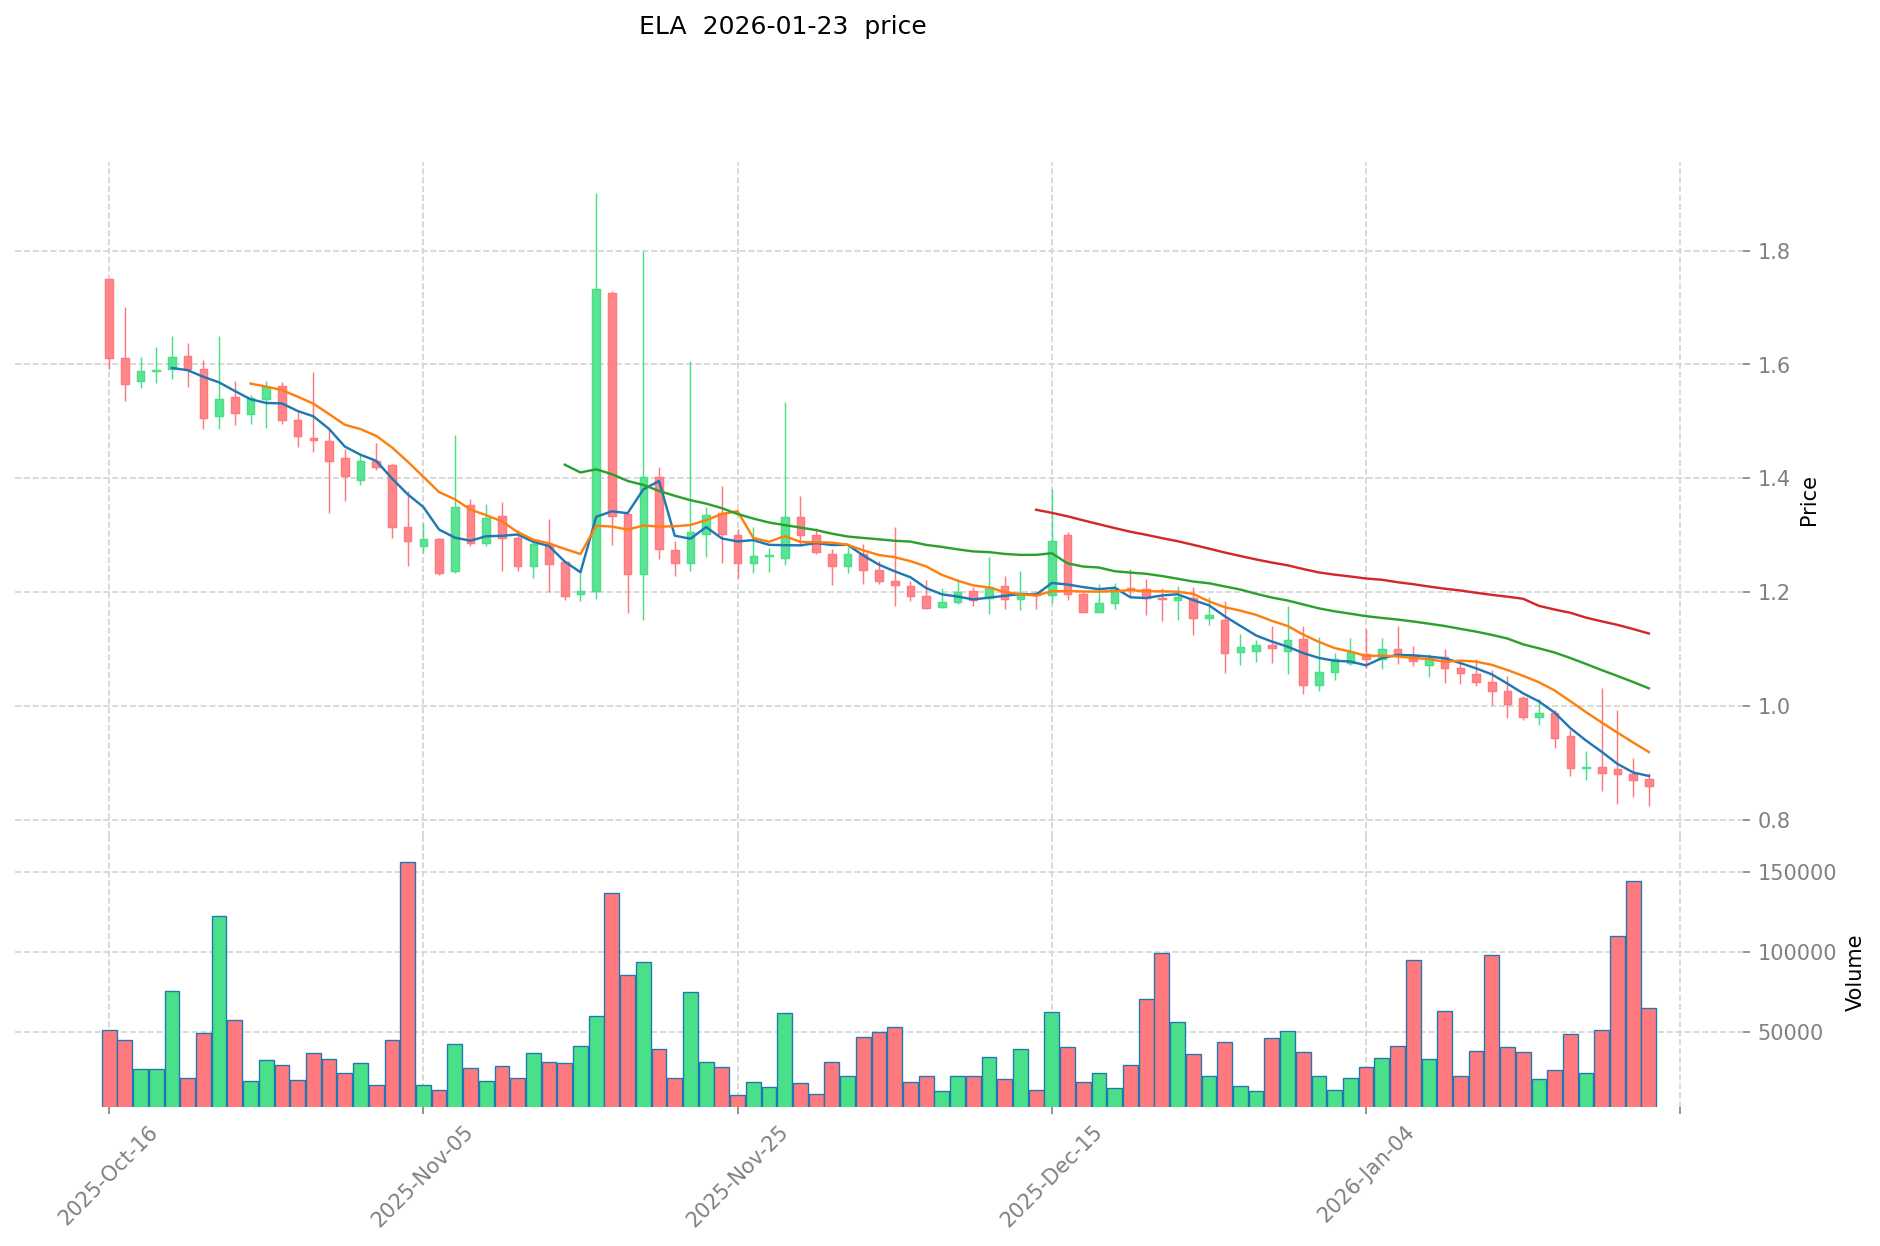
ELA Current Market Status
As of January 23, 2026, Elastos (ELA) is trading at $0.8408, experiencing a 2.41% decline over the past 24 hours. The token's 24-hour trading range has fluctuated between $0.8238 and $0.8705, with a total trading volume of $57,384.
The short-term price performance shows a 0.13% decrease over the past hour. Looking at broader timeframes, ELA has declined 12.08% over the past 7 days and 27.27% over the past 30 days. The one-year performance indicates a 54.03% decrease, reflecting the challenging market conditions in the cryptocurrency sector.
ELA's current market capitalization stands at approximately $19.39 million, with a fully diluted market cap of $22.02 million. The circulating supply comprises 23,064,959 ELA tokens out of a total supply of 26,187,303 tokens and a maximum supply of 28,219,999 tokens, representing a circulation ratio of 81.73%. The token ranks #898 in the overall cryptocurrency market, with a market dominance of 0.00069%.
The market cap to fully diluted valuation ratio stands at 81.73%, indicating that a significant portion of the total supply is already in circulation. With approximately 2,562 token holders, the project maintains a relatively concentrated holder base. ELA is currently available on 7 cryptocurrency exchanges and is tradable on Gate.com.
Click to view the current ELA market price
ELA Market Sentiment Indicator
2026-01-23 Fear and Greed Index: 24 (Extreme Fear)
Click to view the current Fear & Greed Index
The ELA market is currently experiencing extreme fear with an index reading of 24. This significant dip reflects heightened market anxiety and widespread pessimism among investors. When fear reaches such extreme levels, it often signals potential buying opportunities for contrarian investors, as markets tend to overreact to negative sentiment. However, traders should exercise caution and conduct thorough due diligence before making investment decisions. Monitor the index closely for signs of sentiment stabilization or recovery, which could indicate a market bottom and potential reversal opportunity.

ELA Holding Distribution
The holding distribution chart illustrates the concentration of ELA tokens across different wallet addresses, providing insights into the degree of centralization within the token's ecosystem. This metric is crucial for assessing market structure, as it reveals how token ownership is distributed among top holders versus the broader community of smaller participants.
According to the current data, ELA exhibits a moderately high concentration pattern. The top address holds approximately 1.585 million tokens, representing 28.76% of the total supply, while the top five addresses collectively control 62.15% of all circulating tokens. Specifically, the second-largest holder possesses 12.06%, the third 7.78%, and the fourth and fifth addresses hold 6.79% and 6.76% respectively. The remaining 37.85% is distributed among other addresses, indicating that a significant majority of the token supply is concentrated within a small number of wallets.
This concentration level suggests potential vulnerability to price manipulation and heightened volatility risk. When such a substantial proportion of tokens is controlled by a limited number of addresses, these major holders possess considerable influence over market dynamics through their trading activities. Large-scale sell-offs or transfers could trigger significant price fluctuations, while coordinated actions might disproportionately impact liquidity and price discovery mechanisms. However, it is worth noting that the "Others" category still accounts for over one-third of the supply, providing some degree of decentralization buffer. The current distribution pattern reflects a market structure where institutional or early investors maintain dominant positions, which is relatively common in blockchain projects but requires careful monitoring to ensure healthy market development and sustainable price stability.
Click to view current ELA Holding Distribution

| Top |
Address |
Holding Qty |
Holding (%) |
| 1 |
0x2291...77d4ea |
1585.38K |
28.76% |
| 2 |
0x1870...dda12e |
665.00K |
12.06% |
| 3 |
0xa9d1...1d3e43 |
429.17K |
7.78% |
| 4 |
0xe646...d2d0e9 |
374.34K |
6.79% |
| 5 |
0xe587...f4cde3 |
372.80K |
6.76% |
| - |
Others |
2085.48K |
37.85% |
II. Core Factors Influencing ELA's Future Price
Due to the lack of available data in the provided materials regarding Elastos (ELA)'s supply mechanisms, institutional dynamics, macroeconomic correlations, and technical developments, a comprehensive analysis cannot be generated at this time.
For accurate price factor analysis, information regarding ELA's tokenomics, recent protocol upgrades, institutional adoption patterns, and ecosystem developments would be necessary. Readers are encouraged to refer to official Elastos documentation and verified market data sources for the most current information on these critical factors.
III. 2026-2031 ELA Price Prediction
2026 Outlook
- Conservative Prediction: $0.489 - $0.8431
- Neutral Prediction: Around $0.8431
- Optimistic Prediction: Up to $1.01172 (requires favorable market conditions and increased adoption)
2027-2029 Outlook
- Market Stage Expectation: Gradual growth phase with moderate volatility, potential consolidation periods as the project matures
- Price Range Prediction:
- 2027: $0.86249 - $1.30765
- 2028: $0.88285 - $1.27398
- 2029: $0.74137 - $1.38708
- Key Catalysts: Ecosystem development, technological upgrades, broader market sentiment, and increased utility adoption
2030-2031 Long-term Outlook
- Baseline Scenario: $1.16227 - $1.38182 (assuming steady ecosystem growth and stable market conditions)
- Optimistic Scenario: $1.29142 - $1.87126 (contingent on significant technological breakthroughs and mass adoption)
- Transformative Scenario: Potentially exceeding $1.87126 (requires exceptional market conditions, major partnerships, and widespread institutional adoption)
- January 23, 2026: ELA trading within the predicted range of $0.489 - $1.01172 (early stage of the forecast period)
| Year |
Predicted High Price |
Predicted Average Price |
Predicted Low Price |
Price Change |
| 2026 |
1.01172 |
0.8431 |
0.489 |
0 |
| 2027 |
1.30765 |
0.92741 |
0.86249 |
10 |
| 2028 |
1.27398 |
1.11753 |
0.88285 |
32 |
| 2029 |
1.38708 |
1.19576 |
0.74137 |
42 |
| 2030 |
1.38182 |
1.29142 |
1.16227 |
53 |
| 2031 |
1.87126 |
1.33662 |
1.08266 |
58 |
IV. ELA Professional Investment Strategy and Risk Management
ELA Investment Methodology
(I) Long-term Holding Strategy
- Suitable for: Investors believing in Web 3.0 infrastructure development and decentralized internet vision
- Operational Recommendations:
- Consider accumulating positions during market corrections when price approaches support levels
- Monitor project development milestones and ecosystem expansion progress
- Storage Solution: Use Gate Web3 Wallet for secure storage with multi-signature protection enabled
(II) Active Trading Strategy
- Technical Analysis Tools:
- Moving Averages: Observe 50-day and 200-day MA crossovers for trend identification
- RSI Indicator: Monitor overbought (above 70) and oversold (below 30) conditions for entry/exit signals
- Swing Trading Points:
- Track 24-hour volatility range (currently $0.8238-$0.8705) for short-term trading opportunities
- Set stop-loss orders at 5-8% below entry points to manage downside risk
ELA Risk Management Framework
(I) Asset Allocation Principles
- Conservative Investors: 1-3% of crypto portfolio allocation
- Aggressive Investors: 5-10% of crypto portfolio allocation
- Professional Investors: Up to 15% with active risk monitoring
(II) Risk Hedging Solutions
- Portfolio Diversification: Balance ELA with established cryptocurrencies and stablecoins
- Position Sizing: Use dollar-cost averaging to reduce timing risk and volatility impact
(III) Secure Storage Solutions
- Hot Wallet Recommendation: Gate Web3 Wallet for convenient trading and staking access
- Cold Storage Solution: Hardware wallet storage for long-term holdings exceeding $5,000
- Security Precautions: Enable two-factor authentication, never share private keys, verify contract addresses before transactions
V. ELA Potential Risks and Challenges
ELA Market Risks
- High Volatility: ELA experienced -54.03% price decline over the past year, reflecting significant market volatility
- Low Liquidity: Daily trading volume of approximately $57,384 indicates limited liquidity that may impact large order execution
- Market Share: With only 0.00069% market dominance, ELA faces intense competition from established blockchain platforms
ELA Regulatory Risks
- Web 3.0 Regulatory Uncertainty: Evolving global regulations on decentralized infrastructure may impact project operations
- Compliance Requirements: Potential regulatory changes could affect token utility and platform functionality
- Jurisdiction Variations: Different regulatory approaches across regions may limit market access or adoption
ELA Technical Risks
- Platform Complexity: Multi-layer consensus and main-sidechain architecture increases technical maintenance challenges
- Adoption Barriers: Complex infrastructure may slow developer and user adoption compared to simpler platforms
- Security Considerations: Decentralized identity and storage systems require robust security protocols to prevent vulnerabilities
VI. Conclusion and Action Recommendations
ELA Investment Value Assessment
Elastos (ELA) represents an ambitious Web 3.0 infrastructure project focused on decentralized identity, communication, storage, and computing services. While the project offers innovative technical architecture with main-sidechain structure and multi-layer consensus mechanisms, investors should note the substantial price decline of 54.03% over the past year and limited market presence (0.00069% dominance). The long-term value proposition depends on successful ecosystem development and broader Web 3.0 adoption, while short-term risks include high volatility, low liquidity, and ongoing market challenges.
ELA Investment Recommendations
✅ Beginners: Start with small position allocation (1-2% of crypto portfolio) and focus on education about Web 3.0 concepts before increasing exposure
✅ Experienced Investors: Consider strategic accumulation during market dips while maintaining strict position limits (5-8%) and monitoring technical developments
✅ Institutional Investors: Conduct thorough due diligence on project roadmap and team execution, with position sizing based on comprehensive risk assessment
ELA Trading Participation Methods
- Spot Trading: Trade ELA on Gate.com with competitive fees and reliable liquidity
- Dollar-Cost Averaging: Implement systematic purchase plans to mitigate volatility and timing risks
- Portfolio Rebalancing: Periodically adjust ELA allocation based on market conditions and project progress
Cryptocurrency investment carries extremely high risks, and this article does not constitute investment advice. Investors should make prudent decisions based on their own risk tolerance and are advised to consult professional financial advisors. Never invest more than you can afford to lose.
FAQ
ELA reached an all-time high of approximately $151 in May 2021 during the bull market peak. The lowest point occurred around $0.30 in early 2017. Currently trading in mid-range levels, ELA has shown significant volatility reflecting broader market cycles and project development milestones throughout its history.
What are the main factors affecting ELA price?
ELA price is influenced by network adoption, transaction volume, market sentiment, blockchain developments, regulatory policies, and overall crypto market trends. Technical upgrades and ecosystem expansion also significantly impact its valuation.
What are the price predictions for ELA in 2024 and 2025?
Based on market analysis, ELA showed significant growth potential in 2024-2025. Predictions suggested prices could reach $8-12 range by mid-2025, driven by ecosystem development and increased adoption. However, actual performance depends on market conditions and project milestones.
How is the correlation between ELA and other mainstream cryptocurrencies such as BTC and ETH?
ELA shows moderate positive correlation with BTC and ETH, typically ranging from 0.6-0.8. During market uptrends, ELA tends to move in similar directions as major cryptocurrencies, though with higher volatility. This correlation strengthens during bull markets and may weaken during sideways movements.
What impact does Elastos project's roadmap have on ELA price?
Elastos's development roadmap directly influences ELA price through technology upgrades, ecosystem expansion, and adoption milestones. Major releases typically drive positive sentiment and increased transaction volume, supporting price appreciation. Successful implementation of smart contract features and cross-chain capabilities enhances utility and long-term value potential.
What are ELA's circulating supply and maximum supply? How do they impact the price?
ELA has a maximum supply of 21 million coins with approximately 10.5 million in circulation. Limited supply creates scarcity, supporting long-term price appreciation potential. As adoption grows and circulation increases toward the cap, supply constraints may drive significant value growth.
* The information is not intended to be and does not constitute financial advice or any other recommendation of any sort offered or endorsed by Gate.