This comprehensive article analyzes Elastos (ELA) token pricing from 2026 to 2031, combining historical market data, current ecosystem positioning, and technical fundamentals. The analysis covers ELA's price evolution from its 2018 launch peak of $89.14 to current levels around $0.86, alongside market sentiment indicators showing extreme fear conditions. The article provides tiered price forecasts ranging from conservative to optimistic scenarios, with 2031 projections up to $1.90 representing potential 70% appreciation. Readers will discover professional investment strategies tailored for beginners and experienced traders, comprehensive risk management frameworks, and detailed guidance on portfolio allocation. Additionally, the article addresses regulatory considerations, technical risks, and secure storage solutions on Gate trading platform, equipping investors with actionable insights for navigating ELA's volatile market landscape.
Introduction: ELA's Market Position and Investment Value
Elastos (ELA), positioned as a next-generation Web 3.0 platform dedicated to building a decentralized SmartWeb based on blockchain technology, has been developing since its launch in 2018. As of 2026, ELA maintains a market capitalization of approximately $19.82 million with a circulating supply of around 23.06 million tokens, trading at approximately $0.86. This asset, designed to support decentralized applications with enhanced user privacy protection and data security, is playing an increasingly important role in the distributed application ecosystem.
This article will comprehensively analyze ELA's price trends from 2026 to 2031, combining historical patterns, market supply-demand dynamics, ecosystem development, and macroeconomic environment to provide investors with professional price forecasts and practical investment strategies.
I. ELA Price History Review and Market Status
ELA Historical Price Evolution Trajectory
- 2018: Elastos launched on Gate.com with a publish price of $15.152, reaching an all-time high of $89.14 on February 24, 2018, demonstrating strong initial market interest in the Web 3.0 platform.
- 2023: The cryptocurrency market experienced a challenging period, with ELA reaching its all-time low of $0.793867 on January 8, 2023, reflecting broader market downturns.
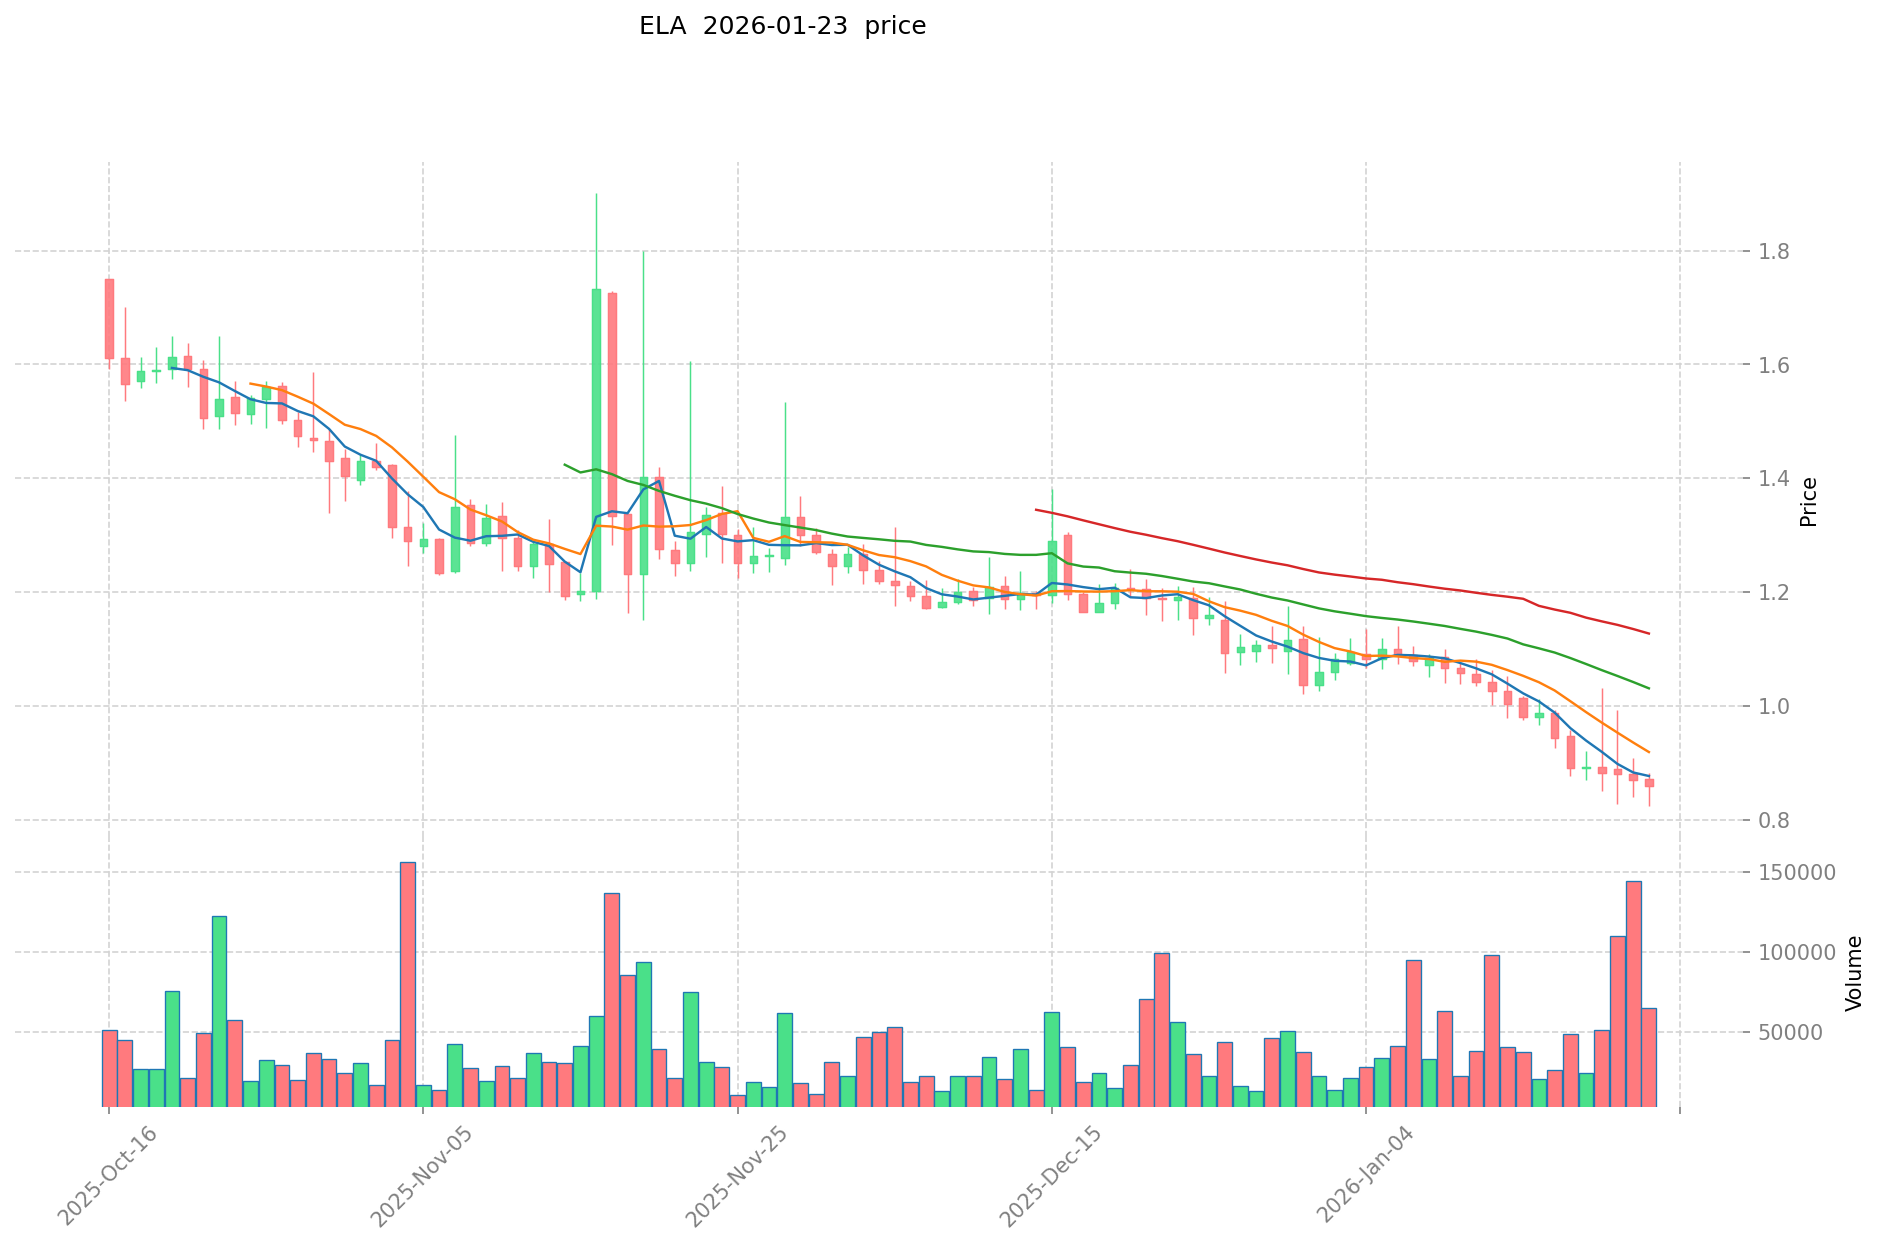
- Recent Period: Over the past year, ELA has experienced a price decline of 52.71%, with the token trading at $0.8592 as of January 23, 2026.
ELA Current Market Status
As of January 23, 2026, ELA is trading at $0.8592, showing a 24-hour price change of -1.27% with a decrease of approximately $0.011. The token's intraday trading range spans from a low of $0.8238 to a high of $0.8827.
The 24-hour trading volume stands at $54,093.03, with a circulating supply of 23,064,892 ELA tokens, representing 81.73% of the total supply. The market capitalization reaches $19,817,355.21, while the fully diluted market cap is valued at $22,500,130.74. ELA currently holds a market dominance of 0.00070%.
The token has experienced notable price movements across different timeframes: a 1-hour change of -0.02%, a 7-day decline of -11.23%, and a 30-day decrease of -26.75%. The maximum supply is capped at 28,219,999 tokens, with the current circulating supply indicating limited token availability.
ELA maintains listings on 7 exchanges and has a holder count of 2,562 addresses. The token is deployed on the Ethereum blockchain with the contract address 0xe6fd75ff38Adca4B97FBCD938c86b98772431867. The cryptocurrency market sentiment indicator shows a reading of 24, indicating an "Extreme Fear" environment.
Click to view current ELA market price
ELA Market Sentiment Indicator
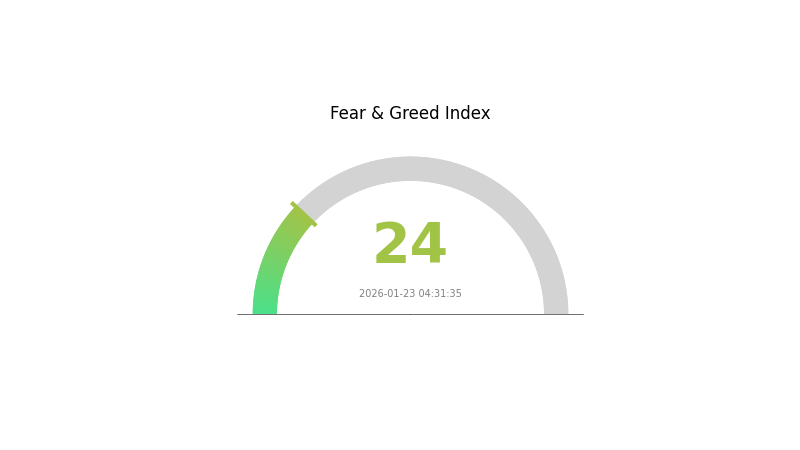
2026-01-23 Fear and Greed Index: 24 (Extreme Fear)
Click to view current Fear & Greed Index
The ELA market is currently experiencing extreme fear, with the Fear and Greed Index dropping to 24. This significant decline reflects heightened market pessimism and investor anxiety. During periods of extreme fear, markets often present contrarian opportunities for experienced traders who can identify undervalued assets. However, caution is advised, as further downside pressure may persist. Investors should consider their risk tolerance and maintain diversified portfolios. Monitor key technical levels and wait for stabilization signals before making major position adjustments. This sentiment typically precedes either capitulation or accumulation phases in market cycles.
ELA 持仓分布
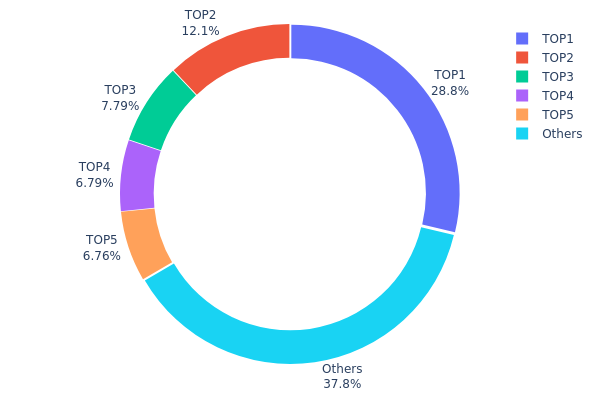
The address holding distribution chart illustrates the concentration of token ownership across different wallet addresses, serving as a crucial indicator of market decentralization and potential price manipulation risks. For ELA, the current distribution reveals a moderately concentrated ownership structure that warrants careful analysis.
According to the latest on-chain data, the top five addresses collectively hold approximately 62.15% of the total ELA supply, with the largest single address controlling 28.76% (1,585.38K ELA). The second-largest holder possesses 12.06% (665.00K ELA), while the remaining top three addresses each maintain between 6.76% and 7.78% of the total supply. The distribution shows a clear hierarchical pattern, with the remaining 37.85% dispersed among other addresses, indicating a relatively limited degree of decentralization in the current market structure.
This concentration level presents both opportunities and risks for market participants. On one hand, the significant holdings by top addresses could represent institutional investors or protocol-related wallets, which may contribute to long-term price stability. On the other hand, such concentration creates potential vulnerability to large-scale sell-offs, as movements from any of the top five holders could trigger substantial price volatility. The relatively small percentage held by smaller addresses (37.85% distributed among all others) suggests limited retail participation and a market structure that could be susceptible to coordinated actions by major holders. From a market health perspective, this distribution pattern indicates that ELA's on-chain ecosystem would benefit from broader token distribution to enhance resilience against manipulation and improve overall market liquidity.
Click to view the current ELA Holding Distribution
| Top |
Address |
Holding Qty |
Holding (%) |
| 1 |
0x2291...77d4ea |
1585.38K |
28.76% |
| 2 |
0x1870...dda12e |
665.00K |
12.06% |
| 3 |
0xa9d1...1d3e43 |
429.17K |
7.78% |
| 4 |
0xe646...d2d0e9 |
374.34K |
6.79% |
| 5 |
0xe587...f4cde3 |
372.80K |
6.76% |
| - |
Others |
2085.48K |
37.85% |
II. Core Factors Influencing ELA's Future Price
Based on the available information, there is currently insufficient data to provide a comprehensive analysis of the core factors affecting ELA's price trajectory. The key areas that typically influence cryptocurrency valuations—including supply mechanisms, institutional dynamics, macroeconomic conditions, and technological developments—require specific data points that are not present in the provided materials.
For accurate price analysis and forecasting, investors should monitor official announcements from the Elastos project team, track on-chain metrics through blockchain explorers, and follow verified industry reports. As new information becomes available regarding ELA's tokenomics, adoption metrics, or technical upgrades, this analysis can be updated accordingly.
Those interested in ELA can explore trading opportunities on Gate.com, which provides a secure platform for cryptocurrency transactions.
III. 2026-2031 ELA Price Prediction
2026 Outlook
- Conservative prediction: $0.46-$0.86
- Neutral prediction: $0.86
- Optimistic prediction: $1.18 (requires favorable market conditions and increased adoption)
2027-2029 Outlook
- Market stage expectation: The period may witness gradual market maturation with potential volatility as the cryptocurrency sector continues to evolve
- Price range prediction:
- 2027: $0.68-$1.19
- 2028: $0.63-$1.17
- 2029: $0.63-$1.56
- Key catalysts: Broader market sentiment, technological developments within the Elastos ecosystem, and potential institutional interest could drive price movements
2030-2031 Long-term Outlook
- Baseline scenario: $1.27-$1.35 (assuming steady ecosystem growth and stable market conditions)
- Optimistic scenario: $1.58 (contingent on significant technological breakthroughs and wider mainstream adoption)
- Transformative scenario: $1.90 (under exceptionally favorable conditions including major partnerships and substantial network expansion)
- 2026-01-23: ELA shows potential for gradual appreciation over the forecast period, with projected increases of up to 70% by 2031 compared to 2026 baseline
| Year |
Predicted High Price |
Predicted Average Price |
Predicted Low Price |
Price Change |
| 2026 |
1.18211 |
0.8566 |
0.46256 |
0 |
| 2027 |
1.19264 |
1.01935 |
0.68297 |
18 |
| 2028 |
1.17236 |
1.106 |
0.63042 |
28 |
| 2029 |
1.56068 |
1.13918 |
0.62655 |
32 |
| 2030 |
1.57941 |
1.34993 |
1.26893 |
57 |
| 2031 |
1.90407 |
1.46467 |
1.15709 |
70 |
IV. ELA Professional Investment Strategy and Risk Management
ELA Investment Methodology
(1) Long-term Holding Strategy
- Suitable for: Investors with strong belief in Web 3.0 and decentralized SmartWeb infrastructure development
- Operational Recommendations:
- Consider accumulating during periods of broader market correction when ELA trades closer to support levels
- Monitor developments in Elastos ecosystem expansion, particularly adoption of its decentralized identity and storage services
- For secure storage, consider using Gate Web3 Wallet which supports ELA and provides enhanced security features for long-term holdings
(2) Active Trading Strategy
- Technical Analysis Tools:
- Volume Analysis: Monitor the 24-hour trading volume (currently around $54,093) to identify potential breakout or breakdown scenarios
- Support and Resistance Levels: Track the 24-hour range ($0.8238 - $0.8827) to identify key price zones for entry and exit
- Swing Trading Considerations:
- Given the recent 7-day decline of 11.23%, traders might wait for stabilization signals before entering positions
- Set stop-loss orders to manage downside risk, particularly given the 30-day decline of 26.75%
ELA Risk Management Framework
(1) Asset Allocation Principles
- Conservative Investors: 1-3% of crypto portfolio
- Moderate Investors: 3-5% of crypto portfolio
- Aggressive Investors: 5-10% of crypto portfolio
(2) Risk Hedging Approaches
- Portfolio Diversification: Balance ELA holdings with established cryptocurrencies and stablecoins to reduce concentration risk
- Dollar-Cost Averaging: Spread purchases over time to mitigate the impact of short-term price volatility
(3) Secure Storage Solutions
- Hot Wallet Recommendation: Gate Web3 Wallet offers convenient access for active traders while maintaining security standards
- Cold Storage Option: For long-term holdings, consider transferring significant amounts to hardware wallets for enhanced security
- Security Precautions: Never share private keys, enable two-factor authentication, and regularly verify wallet addresses before transactions
V. ELA Potential Risks and Challenges
ELA Market Risks
- Price Volatility: ELA has experienced a 52.71% decline over the past year, demonstrating high volatility that could result in significant capital loss
- Liquidity Concerns: With 24-hour trading volume of approximately $54,093 and market cap around $19.8 million, ELA may face liquidity constraints during periods of market stress
- Market Share: With a dominance of only 0.00070%, ELA remains a small-cap asset vulnerable to broader market movements and sentiment shifts
ELA Regulatory Risks
- Web 3.0 Framework Uncertainty: As regulations around decentralized internet infrastructure evolve, changes in legal frameworks could impact Elastos's operational model
- Cross-jurisdictional Compliance: The global nature of decentralized platforms may face varying regulatory approaches across different regions
- Data Privacy Regulations: While Elastos emphasizes privacy protection, evolving data protection laws could require platform adjustments
ELA Technical Risks
- Adoption Challenges: The success of Elastos depends on widespread adoption of its SmartWeb platform, which faces competition from other Web 3.0 projects
- Technology Evolution: Rapid changes in blockchain technology could require continuous platform updates to remain competitive
- Network Security: As with any blockchain platform, potential vulnerabilities in the main-sidechain architecture or consensus mechanisms could pose risks
VI. Conclusion and Action Recommendations
ELA Investment Value Assessment
Elastos presents itself as an infrastructure project for Web 3.0 with a focus on decentralized identity, communication, storage, and computing services. However, investors should note the significant price decline of 52.71% over the past year and limited market capitalization of approximately $19.8 million. The circulating supply represents 81.73% of maximum supply, indicating relatively high token circulation. While the project's technical approach to building a decentralized SmartWeb has merit, the low trading volume and market dominance suggest limited current market adoption. The distance from its all-time high of $89.14 (reached in February 2018) to current levels around $0.86 reflects substantial value erosion.
ELA Investment Recommendations
✅ Beginners: Due to ELA's high volatility and limited liquidity, beginners should approach with caution. If interested, allocate only a small percentage of your overall portfolio and prioritize learning about Web 3.0 infrastructure before investing.
✅ Experienced Investors: Consider ELA as a speculative, small-cap position within a diversified portfolio. Monitor ecosystem development metrics and adoption indicators. Implement strict position sizing and stop-loss strategies given recent downward trends.
✅ Institutional Investors: Conduct thorough due diligence on Elastos's technology stack, team capabilities, and competitive positioning within the Web 3.0 landscape. Given the limited liquidity, institutions should be mindful of potential market impact when entering or exiting positions.
ELA Trading Participation Methods
- Spot Trading: Purchase ELA directly on Gate.com and other supporting exchanges for immediate ownership
- Dollar-Cost Averaging: Implement systematic purchase plans to build positions gradually while mitigating timing risk
- Portfolio Allocation: Integrate ELA as part of a broader Web 3.0 infrastructure investment thesis alongside other decentralized platform tokens
Cryptocurrency investment carries extremely high risks, and this article does not constitute investment advice. Investors should make cautious decisions based on their own risk tolerance and are advised to consult professional financial advisors. Never invest more than you can afford to lose.
FAQ
What is the current price of ELA?
ELA's price fluctuates based on market conditions. As of January 2026, ELA trades in the dynamic crypto market. For real-time pricing, check major crypto tracking platforms. ELA continues gaining adoption in the Elastos ecosystem, driving long-term value potential.
How did ELA price develop in 2024?
In 2024, ELA experienced moderate growth driven by increased ecosystem adoption and blockchain integration. The token benefited from rising market sentiment and expanded use cases, though it remained sensitive to broader crypto market trends and regulatory developments.
What are the main factors affecting ELA price?
ELA price is influenced by market demand, blockchain adoption rate, network development progress, overall crypto market sentiment, trading volume, and macroeconomic conditions. Technical upgrades and ecosystem expansion also significantly impact price movements.
How is the correlation between ELA and other mainstream cryptocurrencies such as BTC and ETH?
ELA shows moderate positive correlation with BTC and ETH, typically ranging from 0.6 to 0.8. During bull markets, ELA tends to move in sync with major cryptocurrencies, while maintaining its independent price dynamics driven by Elastos ecosystem developments and adoption growth.
What are ELA's historical highest and lowest prices?
ELA reached its all-time high of approximately $151 in May 2018, while its all-time low was around $0.30 in early 2017. Price levels have fluctuated significantly based on market conditions and adoption developments.
What are professional analysts' price predictions for ELA in the future?
Analysts project ELA could reach $3-5 by 2027, driven by increased adoption, ecosystem development, and growing institutional interest in blockchain infrastructure. Long-term sentiment remains bullish as the project expands its technological capabilities and market presence.
How will ELA's technical development progress affect its price?
ELA's technological advancements, including smart contract enhancements and blockchain scalability improvements, strengthen network utility and adoption. These developments typically drive increased demand and positive market sentiment, potentially supporting price appreciation over time.
* The information is not intended to be and does not constitute financial advice or any other recommendation of any sort offered or endorsed by Gate.