This comprehensive guide analyzes Balance (EPT) token's price trajectory and investment potential from 2026 through 2031. Currently trading at $0.000936 with a market cap of $2.29 million, EPT functions as an AI-focused Web3 infrastructure token for gaming and entertainment applications. The article examines EPT's market position, historical price evolution, and key price drivers including user adoption, ecosystem development, and regulatory environment. Professional price forecasts indicate conservative 2026 range of $0.00088-$0.00093, with potential growth to $0.00257 by 2031 under optimistic scenarios. Investment strategies cover long-term holding and active trading approaches on Gate Exchange, complemented by comprehensive risk management frameworks addressing market volatility, liquidity constraints, and regulatory uncertainties. Detailed guidance for beginners, experienced investors, and institutions includes secure storage solutions via Gate Web3 Wallet and dollar-cost averaging recommendations to miti
Introduction: EPT's Market Position and Investment Value
Balance (EPT), positioned as an AI-focused Web3 user experience infrastructure that deeply integrates AI technology with Web3 frameworks, has been making strides in the blockchain gaming and entertainment sectors since its inception. As of February 2026, EPT maintains a market capitalization of approximately $2.29 million, with a circulating supply of around 2.44 billion tokens, and a price hovering around $0.000936. This asset, designed to enable users to create personalized AI agents for gaming and entertainment applications, is playing an increasingly significant role in redefining the interaction between AI agents and users through its multi-layered architecture.
This article will comprehensively analyze EPT's price trajectory from 2026 to 2031, combining historical patterns, market supply-demand dynamics, ecosystem development, and macroeconomic conditions to provide investors with professional price forecasts and practical investment strategies.
I. EPT Price History Review and Market Status
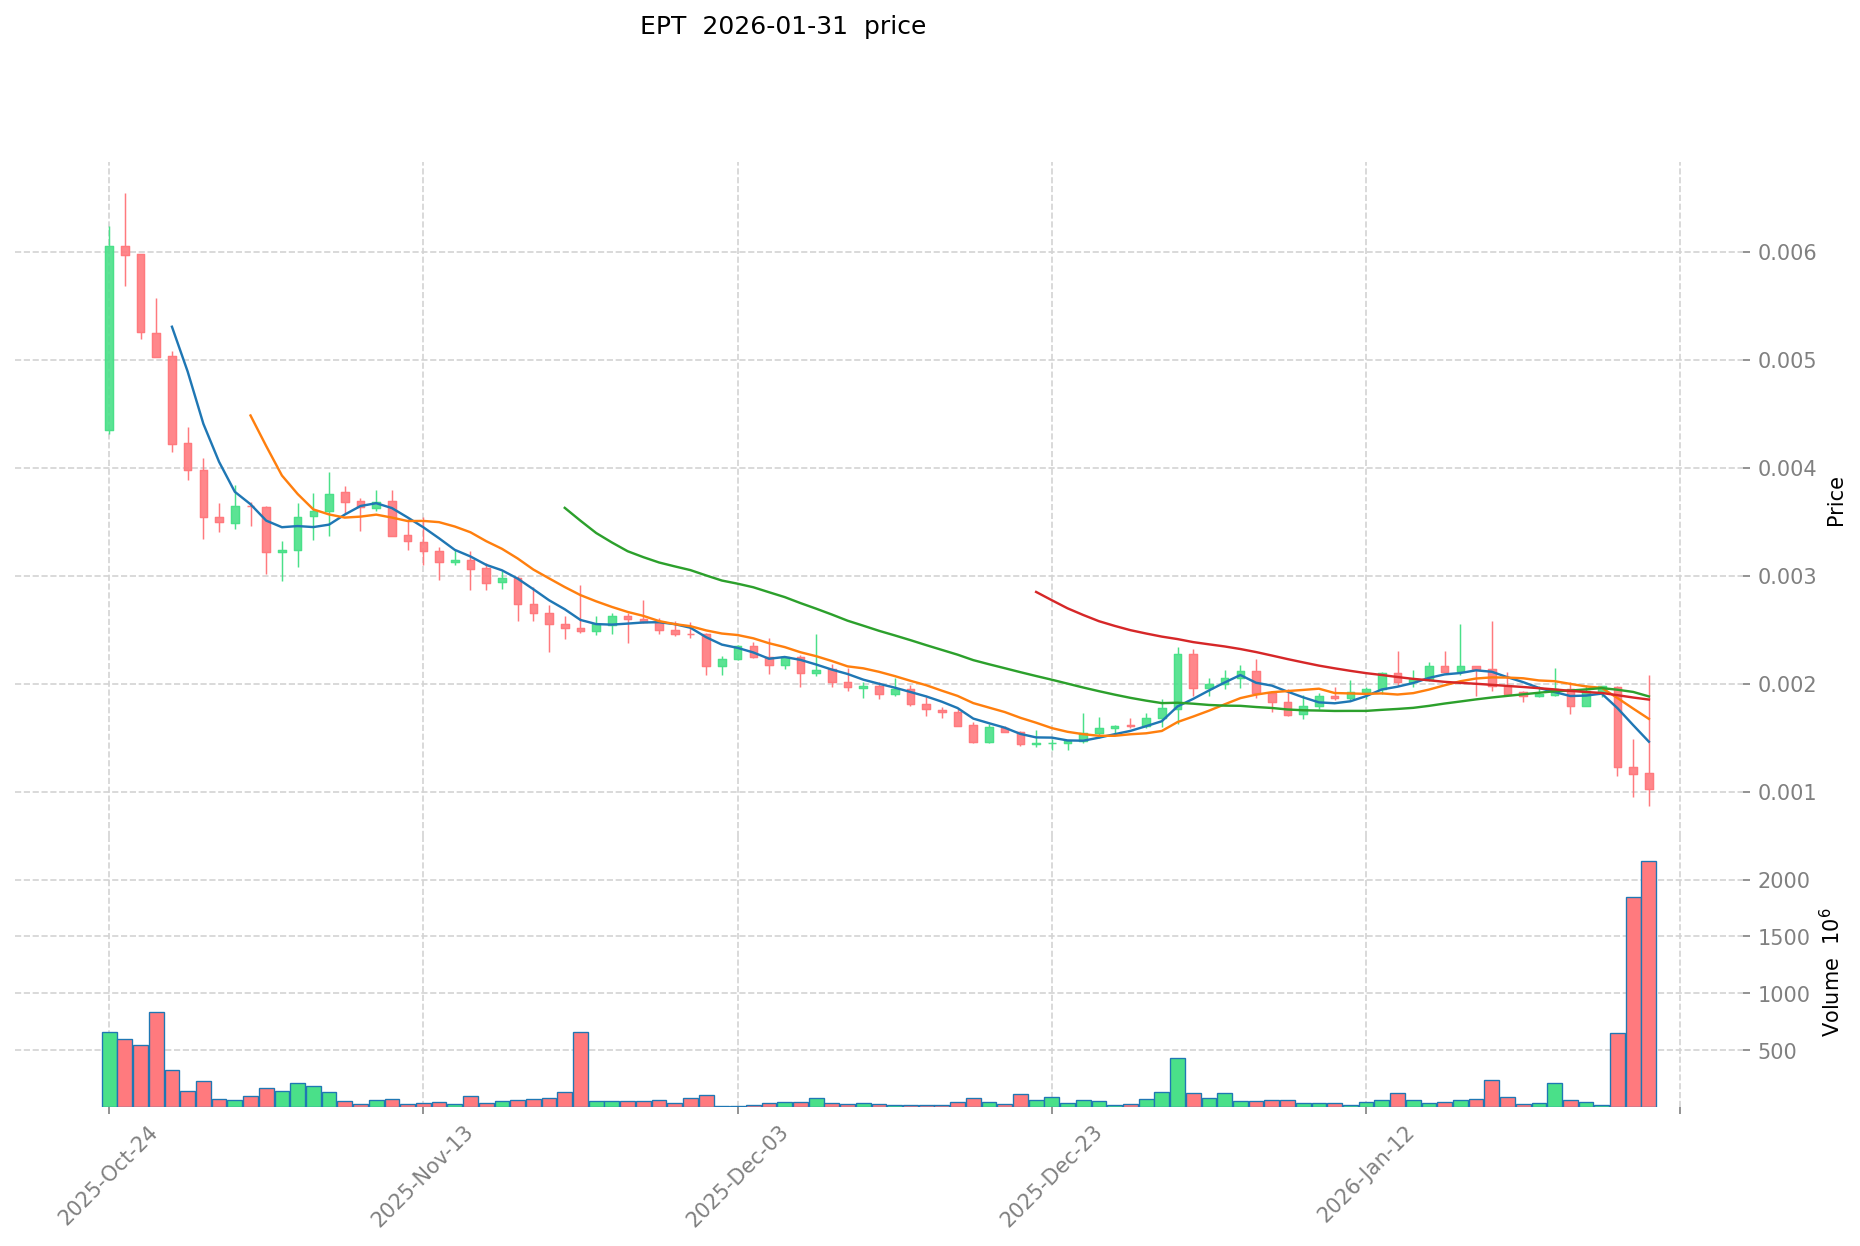
EPT Historical Price Evolution Trajectory
- 2025: Project launched on Gate.com in April, reaching a historical high of $0.03 on April 21st, 2025, marking the initial trading peak following token deployment
- 2026: Market experienced significant correction, with price declining to a historical low of $0.000869 on January 30th, 2026, representing a substantial downturn from previous levels
EPT Current Market Situation
As of February 1st, 2026, Balance (EPT) is trading at $0.000936, with a 24-hour trading volume of $401,606.67. The token has experienced notable volatility, with a 24-hour price range between $0.000921 and $0.00105. Recent price movements indicate a downward trend, with the token declining 1.58% in the past hour, 7.94% over 24 hours, and 52.68% over the past week. The 30-day performance shows a similar pattern with a 52.41% decrease.
EPT currently holds a market ranking of #1957 among cryptocurrencies, with a circulating market capitalization of approximately $2.29 million. The circulating supply stands at 2.44 billion tokens, representing 24.42% of the total supply of 10 billion tokens. The fully diluted market cap is calculated at $9.36 million, with the current market capitalization representing 24.42% of this fully diluted valuation. Market dominance remains minimal at 0.00033%.
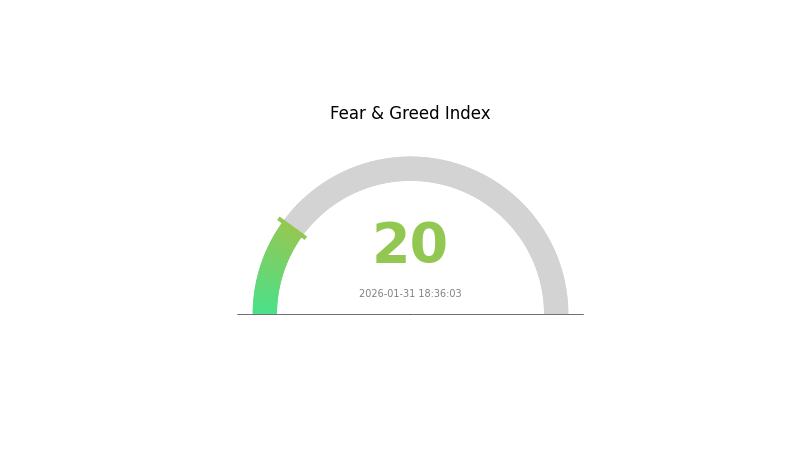
The token is accessible through multiple blockchain networks, with contract addresses deployed on both Ethereum (ETH) and Binance Smart Chain (BSC) networks, utilizing ERC-20 and BEP-20 standards respectively. Current holder count stands at 148 addresses, while the token is listed across 27 exchanges. The current market sentiment indicator reflects an extreme fear rating of 20 on the VIX scale, suggesting heightened caution among market participants.
Click to view current EPT market price
EPT Market Sentiment Index
2026-01-31 Fear & Greed Index: 20 (Extreme Fear)
Click to view current Fear & Greed Index
The cryptocurrency market is currently experiencing extreme fear, with the Fear & Greed Index standing at 20. This indicates significant market pessimism and heightened risk aversion among investors. Such extreme fear conditions often present contrarian opportunities, as markets tend to overreact to negative sentiment. However, traders should exercise caution and conduct thorough research before making investment decisions. Monitor market developments closely and consider dollar-cost averaging strategies to mitigate timing risks during periods of extreme volatility.
EPT Holding Distribution
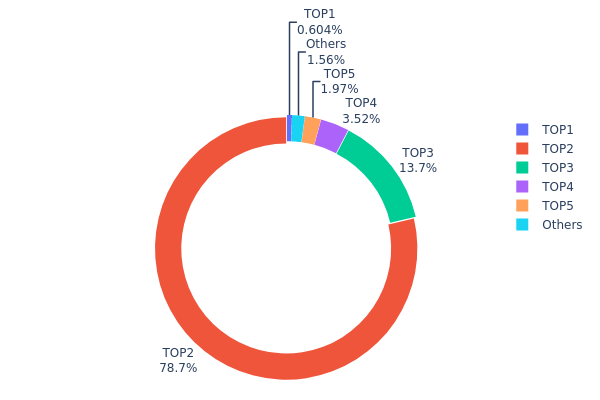
According to the on-chain data, the EPT token holding distribution shows a significant concentration pattern. The top 5 addresses collectively hold 98.41% of the total circulating supply, with the second-largest address alone controlling 78.66% of all tokens. This extraordinarily high concentration level indicates that EPT's token distribution structure is heavily centralized, with a small number of whale addresses dominating the market supply.
From a market structure perspective, such extreme concentration poses several notable risks. The address holding 78.66% of tokens possesses substantial market influence, capable of significantly impacting price through large-scale selling or strategic positioning. Additionally, addresses ranked third through fifth hold 13.67%, 3.51%, and 1.97% respectively, while all remaining addresses combined account for merely 1.59%. This distribution pattern suggests limited token circulation among retail investors, with market liquidity potentially controlled by a handful of major holders.
This centralized holding structure may lead to heightened price volatility and reduced market depth. In the event of concentrated selling by major holders, the market could experience severe price fluctuations due to insufficient buy-side support. Furthermore, the extremely low proportion held by dispersed addresses (1.59%) reflects weak community participation and limited decentralization, which could negatively affect long-term ecosystem development and market confidence.
Click to view current EPT Holding Distribution
| Top |
Address |
Holding Qty |
Holding (%) |
| 1 |
0x20e1...c0bd8a |
17455.20K |
0.60% |
| 2 |
0x15ec...dc74b0 |
2273935.77K |
78.66% |
| 3 |
0xa312...4ab647 |
395410.19K |
13.67% |
| 4 |
0x67da...b309a2 |
101737.42K |
3.51% |
| 5 |
0xe809...6f74a7 |
56991.11K |
1.97% |
| - |
Others |
45040.72K |
1.59% |
II. Core Factors Influencing EPT's Future Price
Market Demand and Sentiment Dynamics
- User Adoption Trends: EPT's price trajectory is closely tied to adoption rates within the Balance Protocol ecosystem. The token serves as the native asset for governance, staking rewards, and fee rebates, making user participation a critical demand driver.
- Media Coverage Impact: Positive developments such as strategic partnerships or favorable media attention tend to increase demand and push EPT's exchange rate higher. Conversely, negative news related to security concerns can trigger price declines.
- Community Engagement: The platform's airdrop mechanism, which rewards early participants, testers, and active governance contributors, helps strengthen community cohesion and sustain long-term interest in the token.
Institutional Participation and Holder Behavior
- Staking Incentives: EPT employs a deflationary model where a portion of transaction fees is burned to reduce circulating supply and enhance scarcity. Long-term holders are encouraged through staking mechanisms that offer additional yields or increased governance weight.
- Distribution Strategy: Airdrops are released in phases, often linked to platform activities or task completion, which helps expand the user base while maintaining engagement levels.
Broader Economic and Regulatory Environment
- Regulatory Policy Influence: Any adverse regulatory developments could significantly impact the platform's growth trajectory and EPT's valuation. The cryptocurrency market remains highly sensitive to policy shifts across major jurisdictions.
- Economic Factors: EPT's price performance is influenced by wider economic conditions, including macroeconomic trends, monetary policy directions, and overall risk appetite in financial markets.
Competitive Landscape and Market Positioning
- DeFi Sector Competition: The digital currency market is highly competitive, with numerous projects launching innovative features. EPT's ability to establish differentiation within the DeFi space while expanding its user base will be crucial for sustained growth.
- Development Progress: The project's execution capability, particularly in maintaining development milestones and delivering on roadmap commitments, represents a key consideration for assessing EPT's medium-to-long-term potential.
Technical Infrastructure and Ecosystem Development
- Smart Contract Architecture: Balance Protocol leverages smart contract technology to enable transparent fund flows and efficient management within a decentralized financial ecosystem, distinguishing it from traditional financial systems.
- Liquidity Mechanisms: The platform has established liquidity pools with reward structures designed to encourage liquidity provision, thereby promoting trading activity and token circulation.
III. 2026-2031 EPT Price Forecast
2026 Outlook
- Conservative Forecast: $0.00088 - $0.00093
- Neutral Forecast: Around $0.00093
- Optimistic Forecast: Up to $0.00131 (requires favorable market conditions and increased adoption)
2027-2029 Outlook
- Market Stage Expectation: Gradual growth phase with potential for steady price appreciation as the project matures and expands its user base
- Price Range Forecast:
- 2027: $0.00103 - $0.00143 (approximately 19% increase from 2026)
- 2028: $0.00073 - $0.00158 (approximately 36% increase from 2026)
- 2029: $0.00100 - $0.00190 (approximately 52% increase from 2026)
- Key Catalysts: Enhanced utility features, strategic partnerships, broader market recovery, and increased platform integration
2030-2031 Long-Term Outlook
- Baseline Scenario: $0.00150 - $0.00178 (assuming stable market conditions and continued project development)
- Optimistic Scenario: $0.00164 - $0.00257 (assuming successful ecosystem expansion and favorable regulatory environment)
- Transformative Scenario: Beyond $0.00257 (requires exceptional adoption rates, major technological breakthroughs, and widespread institutional acceptance)
- 2026-02-01: EPT is positioned in its early growth phase with potential for gradual value appreciation over the forecast period
| Year |
Predicted High Price |
Predicted Average Price |
Predicted Low Price |
Price Change |
| 2026 |
0.00131 |
0.00093 |
0.00088 |
0 |
| 2027 |
0.00143 |
0.00112 |
0.00103 |
19 |
| 2028 |
0.00158 |
0.00128 |
0.00073 |
36 |
| 2029 |
0.0019 |
0.00143 |
0.001 |
52 |
| 2030 |
0.00178 |
0.00167 |
0.0015 |
77 |
| 2031 |
0.00257 |
0.00172 |
0.00164 |
84 |
IV. EPT Professional Investment Strategies and Risk Management
EPT Investment Methodology
(1) Long-Term Holding Strategy
- Target Investors: AI and Web3 technology enthusiasts, blockchain ecosystem believers
- Operational Recommendations:
- Consider accumulating positions during market corrections to reduce average cost
- Set reasonable profit-taking targets based on project development milestones
- Storage Solution: Use Gate Web3 Wallet for secure asset custody with multi-signature protection
(2) Active Trading Strategy
- Technical Analysis Tools:
- Moving Averages: Monitor 20-day and 50-day MAs to identify short-term trend reversals
- Volume Analysis: Track 24-hour trading volume changes to assess market participation intensity
- Swing Trading Key Points:
- Set stop-loss levels at 8-10% below entry price to control downside risk
- Monitor social media sentiment and project announcements for potential catalysts
EPT Risk Management Framework
(1) Asset Allocation Principles
- Conservative Investors: Allocate no more than 2-3% of crypto portfolio
- Aggressive Investors: May allocate 5-8% depending on risk tolerance
- Professional Investors: Can adjust allocation based on comprehensive technical and fundamental analysis
(2) Risk Hedging Solutions
- Portfolio Diversification: Balance EPT holdings with established cryptocurrencies
- Dollar-Cost Averaging: Distribute purchases across different time periods to mitigate timing risk
(3) Secure Storage Solutions
- Hot Wallet Recommendation: Gate Web3 Wallet for convenient trading and DApp interactions
- Cold Storage Solution: Hardware wallet storage for long-term holdings exceeding significant value
- Security Precautions: Enable two-factor authentication, regularly backup private keys, verify contract addresses before transactions
V. EPT Potential Risks and Challenges
EPT Market Risks
- High Volatility: EPT has experienced a 52.68% decline over the past 7 days, demonstrating significant price fluctuation
- Low Liquidity: With a 24-hour trading volume of approximately $401,607, market depth may be limited
- Market Cap Concentration: Circulating supply represents only 24.42% of total supply, indicating potential dilution risk
EPT Regulatory Risks
- AI Regulation Uncertainty: Evolving global AI governance frameworks may impact AI-integrated blockchain projects
- Cross-Chain Compliance: Deployment on both ETH and BSC networks requires adherence to multiple jurisdictional requirements
- Token Classification: Regulatory authorities may classify EPT differently across various regions
EPT Technical Risks
- Smart Contract Vulnerabilities: Multi-chain deployment increases attack surface and potential security risks
- AI Agent Reliability: Dependence on AI technology introduces uncertainties related to algorithm performance
- Ecosystem Development Risk: Project success relies heavily on user adoption and developer engagement
VI. Conclusion and Action Recommendations
EPT Investment Value Assessment
Balance (EPT) represents an innovative attempt to integrate AI agents with Web3 infrastructure, targeting gaming and entertainment sectors. The project's multi-layered architecture demonstrates technical ambition. However, investors should note the significant price volatility, limited circulating supply (24.42%), and relatively small market capitalization. The project's long-term value depends on successful ecosystem development and sustained user adoption, while short-term risks include market volatility and regulatory uncertainty.
EPT Investment Recommendations
✅ Beginners: Start with minimal allocation (1-2% of crypto portfolio), focus on learning about AI and Web3 integration before increasing exposure
✅ Experienced Investors: Consider strategic positioning during market dips, implement strict risk management protocols, monitor project development milestones
✅ Institutional Investors: Conduct comprehensive due diligence on technical architecture and team credentials, assess liquidity constraints before large-scale deployment
EPT Trading Participation Methods
- Spot Trading: Purchase EPT directly on Gate.com with various trading pairs
- Dollar-Cost Averaging: Establish systematic purchase plans to smooth out price volatility
- Gate Web3 Wallet Integration: Utilize Gate Web3 Wallet for seamless interaction with Balance ecosystem DApps
Cryptocurrency investments carry extremely high risks, and this article does not constitute investment advice. Investors should make prudent decisions based on their own risk tolerance and are advised to consult professional financial advisors. Never invest more than you can afford to lose.
FAQ
EPT reached its all-time high of 0.03 USD in April 2025, marking a key project milestone. It dropped to a low of 0.001468 USD in October 2025, then rebounded from November onwards, showing recovery momentum.
What are the main factors affecting EPT price?
EPT price is influenced by market sentiment, trading volume, technological development, and user adoption. Macroeconomic factors such as interest rate changes and regulatory signals also play significant roles in price movements.
How to predict EPT prices? What are the common analysis methods?
Common EPT price prediction methods include technical analysis using price charts and indicators like moving averages and RSI to identify trends, support and resistance levels. Fundamental analysis examining project developments and market sentiment also helps forecast price movements.
What key indicators should be focused on for EPT's technical and fundamental analysis?
Technical analysis: monitor trading volume, price trends, RSI, MACD, and moving averages. Fundamental analysis: track token utility, ecosystem development, adoption metrics, market capitalization, and competitive positioning in the market.
What risks should I pay attention to when investing in EPT?
EPT investment risks include market volatility, contract expiration risks, and strategy adjustments. Monitor commodity price movements and market conditions closely. Rising prices may impact annual returns through rolling costs and fees.
What are the advantages and disadvantages of EPT compared to similar tokens?
EPT introduces innovative token valuation through EPT(per-token earnings)metrics, offering transparent value distribution. Advantages include unique earnings model and community-driven governance. Disadvantages involve market volatility and adoption challenges compared to established competitors.
Professional analysts' predictions for EPT's future price are how?
Professional analysts predict EPT price will rise based on market trends, adoption growth, and ecosystem development. However, exact future prices remain uncertain. Investors should consult latest market analysis and research before making decisions.
* The information is not intended to be and does not constitute financial advice or any other recommendation of any sort offered or endorsed by Gate.