This comprehensive analysis provides a detailed ERA price prediction for 2026-2031, guiding investors through Caldera's Layer 2 scaling ecosystem. ERA currently trades at $0.1952 with a $28.99 million market cap, processing 850+ million transactions across 25 million addresses. The article examines historical price evolution, current market sentiment (extreme fear at index 24), and holding concentration risks. Price forecasts range from conservative estimates of $0.16567-$0.1949 in 2026 to optimistic scenarios reaching $0.5097 by 2031. Professional investment strategies include long-term holding and active trading approaches, with risk management frameworks for conservative, aggressive, and institutional investors. Key considerations address high volatility, limited liquidity, regulatory uncertainty, and competition from established Layer 2 solutions. The analysis emphasizes dollar-cost averaging, secure storage on Gate Web3 Wallet, and portfolio diversification within the rollups sector for prudent ERA inves
Introduction: ERA's Market Position and Investment Value
Caldera (ERA), as a pioneering platform for the Internet of Rollups dedicated to making crypto faster, cheaper, and more interconnected, has achieved notable milestones since its launch in 2025. As of January 21, 2026, ERA maintains a market capitalization of approximately $28.99 million, with a circulating supply of around 148.5 million tokens, and its price stabilizes near $0.1952. This asset, recognized as an innovative infrastructure solution in the rollup ecosystem, is playing an increasingly vital role in facilitating seamless cross-chain interactions and scalable blockchain applications.
Caldera's ecosystem has secured over $400 million in total value locked and processed more than 850 million transactions across 25 million unique addresses, demonstrating its capacity to meet real-world demand while maintaining reliability and efficiency. With its current market ranking at 724 and a market dominance of 0.0062%, ERA represents a developing asset in the Layer 2 scaling solutions landscape.
This article will comprehensively analyze ERA's price trajectory from 2026 through 2031, incorporating historical patterns, market supply-demand dynamics, ecosystem development, and macroeconomic conditions, to provide investors with professional price forecasts and practical investment strategies.
I. ERA Price History Review and Current Market Status
ERA Historical Price Evolution Trajectory
- 2025: Caldera (ERA) launched in July with an initial trading presence, experiencing significant volatility throughout its first year of operation
- 2025 (Mid-year): The token reached notable price levels during its early trading period, with market participants exploring the rollup infrastructure narrative
- 2025 (Late-year): Price movements reflected broader market conditions as the token established its trading range and liquidity profile
ERA Current Market Landscape
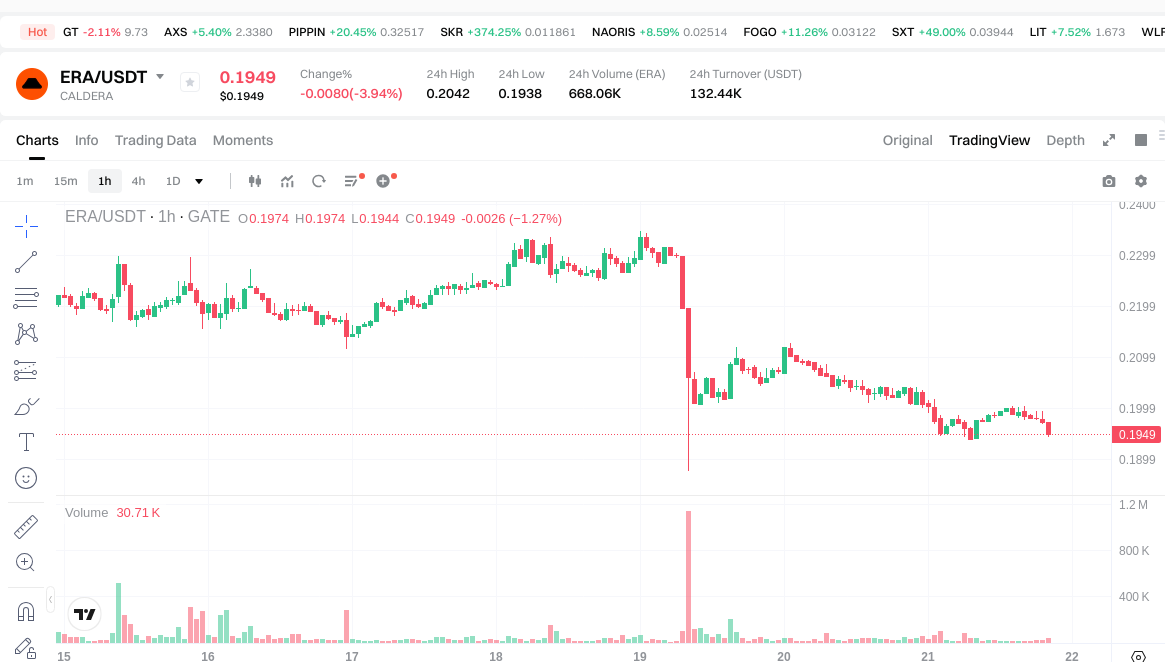
As of January 21, 2026, ERA is trading at $0.1952, representing a 3% decrease over the past 24 hours. The token has demonstrated notable price action across different timeframes, with a 1.26% decline in the last hour and an 11.81% decrease over the past week. On a monthly basis, ERA has shown relative stability with a modest 0.26% increase over the past 30 days.
The token's market capitalization stands at approximately $28.99 million, with a fully diluted valuation of $195.2 million. ERA maintains a circulating supply of 148.5 million tokens out of a maximum supply of 1 billion tokens, representing a circulation ratio of 14.85%. The 24-hour trading volume has reached $129,193.91, indicating ongoing market activity.
Within the past day, ERA has traded between a low of $0.1938 and a high of $0.2042, establishing a relatively narrow intraday range. The token currently ranks #724 in the cryptocurrency market with a market dominance of 0.0062%. From a historical perspective, ERA recorded an all-time high of $1.85 on July 17, 2025, and an all-time low of $0.1759 on December 18, 2025.
The underlying Caldera platform has demonstrated operational metrics that reflect growing adoption, with its ecosystem securing over $400 million in total value locked and processing more than 850 million transactions across 25 million unique addresses. This infrastructure performance provides context for ERA's market positioning within the rollup-as-a-service sector.
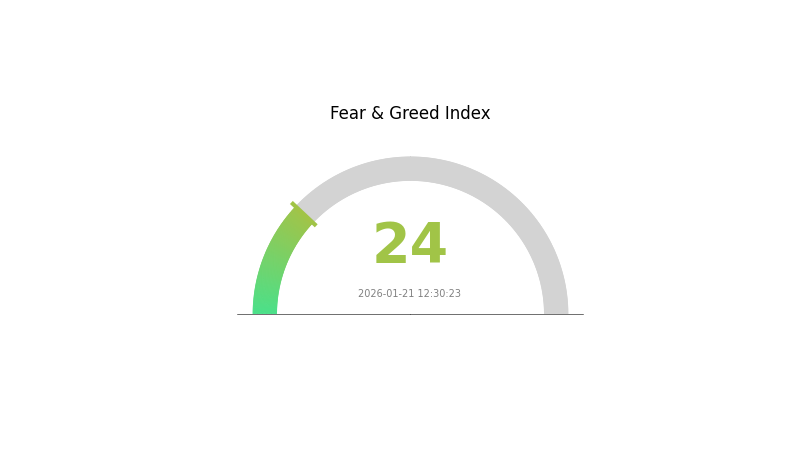
Market sentiment indicators currently reflect a cautious environment, with the broader crypto fear and greed index registering at 24, indicating extreme fear conditions. This backdrop influences ERA's price dynamics alongside token-specific factors related to Caldera's platform development and ecosystem expansion efforts.
Click to view current ERA market price
ERA Market Sentiment Indicator
2026-01-21 Fear and Greed Index: 24 (Extreme Fear)
Click to view the current Fear & Greed Index
The cryptocurrency market is currently experiencing extreme fear sentiment, with the Fear and Greed Index at 24. This indicates significant market anxiety and pessimism among investors. Such extreme fear conditions often present contrarian opportunities, as markets tend to recover when sentiment reaches these levels. Traders should exercise caution while considering long-term investment strategies. Risk management remains critical during periods of heightened market uncertainty.
ERA Holding Distribution
The holding distribution chart represents the allocation of ERA tokens across different addresses on the blockchain, providing insights into ownership concentration and decentralization levels. This metric is crucial for understanding the market structure, as it reveals whether tokens are widely distributed among numerous holders or concentrated in the hands of a few large addresses.
According to the current data, ERA demonstrates a significantly concentrated holding pattern. The top three addresses collectively control approximately 82.14% of the total supply, with the largest address holding 30.64%, the second holding 26.41%, and the third holding 25.09%. The top five addresses account for 90.42% of the total supply, while all other addresses combined represent only 9.58%. This high concentration level indicates that a small number of entities possess substantial control over the token's circulating supply, which is characteristic of projects in early development stages or those with specific token distribution mechanisms.
Such concentrated holding distribution poses notable implications for market dynamics. The dominance of top addresses suggests limited decentralization, potentially increasing susceptibility to price manipulation and creating elevated volatility risks. Large holders possess significant influence over market movements, as their trading decisions can trigger substantial price fluctuations. Additionally, this concentration pattern may affect liquidity, as the relatively small percentage held by diverse market participants could result in thinner order books and wider bid-ask spreads during active trading periods. From an on-chain structural perspective, this distribution reflects a market still in its formative phase, where broader token distribution and enhanced decentralization would benefit long-term stability and investor confidence.
Click to view current ERA Holding Distribution
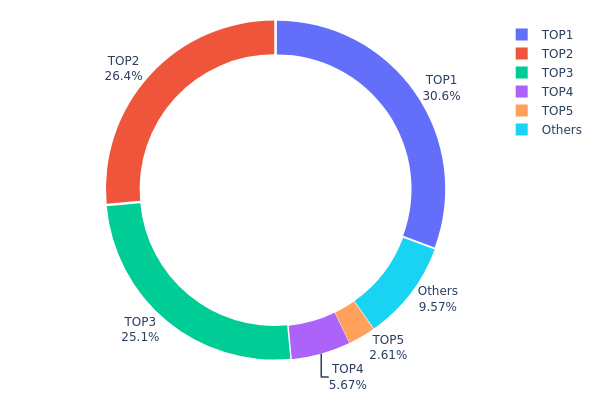
| Top |
Address |
Holding Qty |
Holding (%) |
| 1 |
0xb92d...59f983 |
306447.21K |
30.64% |
| 2 |
0x0306...516551 |
264173.87K |
26.41% |
| 3 |
0xf214...d499cd |
250900.00K |
25.09% |
| 4 |
0x1669...9f7cf3 |
56707.17K |
5.67% |
| 5 |
0xf977...41acec |
26100.75K |
2.61% |
| - |
Others |
95671.00K |
9.58% |
II. Core Factors Influencing ERA's Future Price
Based on the current available information, specific details regarding ERA's supply mechanisms, institutional dynamics, macroeconomic environment impact, and technical development are not provided in the reference materials. A comprehensive analysis of these factors requires access to the project's official documentation, on-chain data, and market intelligence.
For investors interested in ERA, it is recommended to:
- Monitor official announcements from the project team regarding tokenomics and supply schedules
- Track institutional investment activities through blockchain explorers and disclosure platforms
- Stay informed about broader cryptocurrency market trends and regulatory developments
- Evaluate the project's technical roadmap and ecosystem partnerships through official channels
As market conditions evolve and more information becomes available, these fundamental factors will become clearer for analysis.
III. 2026-2031 ERA Price Prediction
2026 Outlook
- Conservative estimate: $0.16567 - $0.1949
- Neutral estimate: Around $0.1949
- Optimistic estimate: Up to $0.28066 (requires favorable market conditions and increased adoption)
2027-2029 Mid-term Outlook
- Market stage expectation: Gradual growth phase with potential volatility as the project matures and expands its ecosystem
- Price range forecast:
- 2027: $0.16169 - $0.30673 (approximately 21% growth)
- 2028: $0.23686 - $0.36482 (approximately 39% growth)
- 2029: $0.22298 - $0.35676 (approximately 63% cumulative growth from baseline)
- Key catalysts: Technology development progress, partnership expansion, broader market adoption, and overall cryptocurrency market trends
2030-2031 Long-term Outlook
- Baseline scenario: $0.24311 - $0.42882 (assuming steady ecosystem development)
- Optimistic scenario: $0.33765 - $0.5097 (with accelerated adoption and favorable regulatory environment)
- Transformative scenario: Potential to reach upper bounds of $0.5097 by 2031 (requiring significant breakthrough in technology implementation and mainstream adoption, representing approximately 96% cumulative growth)
- 2026-01-21: ERA trading within established range as market participants evaluate long-term growth potential
| Year |
Predicted High Price |
Predicted Average Price |
Predicted Low Price |
Price Change |
| 2026 |
0.28066 |
0.1949 |
0.16567 |
0 |
| 2027 |
0.30673 |
0.23778 |
0.16169 |
21 |
| 2028 |
0.36482 |
0.27226 |
0.23686 |
39 |
| 2029 |
0.35676 |
0.31854 |
0.22298 |
63 |
| 2030 |
0.42882 |
0.33765 |
0.24311 |
72 |
| 2031 |
0.5097 |
0.38323 |
0.21844 |
96 |
IV. ERA Professional Investment Strategies and Risk Management
ERA Investment Methodology
(1) Long-term Holding Strategy
- Target Investors: Investors who believe in the Rollups infrastructure narrative and Layer 2 scaling solutions
- Operational Recommendations:
- Consider accumulating during periods of market weakness, as ERA has shown a 30-day price increase of 0.26% despite broader volatility
- Monitor the project's ecosystem metrics, particularly the growth in unique addresses which currently exceeds 25 million
- Storage Solution: Utilize Gate Web3 Wallet for secure asset custody with multi-signature protection capabilities
(2) Active Trading Strategy
- Technical Analysis Tools:
- Moving Averages: Track the 7-day moving average as ERA showed an 11.81% decline over the past week, potentially indicating oversold conditions
- Volume Analysis: Monitor the 24-hour trading volume of approximately $129,194 to gauge market interest and liquidity
- Swing Trading Points:
- Set entry points near the 24-hour low of $0.1938 and consider taking partial profits near resistance levels around $0.2042
- Utilize the relatively low circulating supply of 14.85% of total supply as a factor in volatility assessment
ERA Risk Management Framework
(1) Asset Allocation Principles
- Conservative Investors: 1-2% of crypto portfolio allocation
- Aggressive Investors: 3-5% of crypto portfolio allocation
- Professional Investors: Up to 7-10% with active hedging strategies
(2) Risk Hedging Solutions
- Position Sizing: Implement incremental entry positions to average down cost basis during volatility periods
- Stop-Loss Management: Consider setting stop-loss orders 10-15% below entry points given ERA's historical volatility
(3) Secure Storage Solutions
- Hot Wallet Recommendation: Gate Web3 Wallet for active trading positions with convenient access to Gate.com exchange
- Cold Storage Solution: Hardware wallet for long-term holdings exceeding short-term trading needs
- Security Precautions: Enable two-factor authentication, regularly verify contract addresses (0xe2ad0bf751834f2fbdc62a41014f84d67ca1de2a on Ethereum), and never share private keys or seed phrases
V. ERA Potential Risks and Challenges
ERA Market Risks
- High Volatility: ERA experienced a 55.47% decline over the past year, demonstrating significant price fluctuations
- Limited Liquidity: With a market cap of approximately $28.99 million and relatively modest 24-hour trading volume, large trades may face slippage
- Low Circulation Ratio: Only 14.85% of total supply is currently circulating, creating potential selling pressure as more tokens unlock
ERA Regulatory Risks
- Layer 2 Regulatory Uncertainty: Evolving regulatory frameworks for Rollup technologies may impact operational parameters
- Token Classification: Potential changes in how regulatory authorities classify infrastructure tokens could affect market access
- Cross-chain Compliance: The project's interoperability features may face scrutiny under emerging cross-chain transaction regulations
ERA Technical Risks
- Infrastructure Dependencies: Reliance on Ethereum mainnet security and performance may create systemic vulnerabilities
- Competition from Established L2s: Major Layer 2 solutions like Arbitrum and Optimism hold significant market share advantages
- Smart Contract Vulnerabilities: As an ERC-20 token on Ethereum, ERA is subject to potential smart contract exploits or protocol bugs
VI. Conclusion and Action Recommendations
ERA Investment Value Assessment
Caldera presents a compelling infrastructure play in the Layer 2 scaling narrative, with demonstrated traction evidenced by over 850 million processed transactions and 25 million unique addresses. However, the project faces challenges including a 55.47% annual price decline and strong competition from established Layer 2 solutions. The low circulation ratio of 14.85% suggests potential token unlocks could create selling pressure. Long-term value depends on Caldera's ability to maintain its technical advantages in the increasingly crowded Rollups market while expanding ecosystem adoption.
ERA Investment Recommendations
✅ Beginners: Start with small allocations (1-2% of crypto portfolio) and focus on understanding the Layer 2 ecosystem before increasing exposure
✅ Experienced Investors: Consider swing trading opportunities around technical support levels while maintaining a core position based on ecosystem growth metrics
✅ Institutional Investors: Evaluate ERA as part of a broader Layer 2 infrastructure thesis with appropriate hedging strategies and attention to token unlock schedules
ERA Trading Participation Methods
- Spot Trading: Direct purchase and sale of ERA tokens on Gate.com with access to multiple trading pairs
- Dollar-Cost Averaging: Systematic accumulation strategy to mitigate timing risk given current market volatility
- Portfolio Diversification: Combine ERA holdings with other Layer 2 tokens to reduce concentration risk within the scaling solutions sector
Cryptocurrency investment carries extreme risks, and this article does not constitute investment advice. Investors should make prudent decisions based on their own risk tolerance and are advised to consult professional financial advisors. Never invest more than you can afford to lose.
FAQ
What is ERA token? What are its uses and application scenarios?
ERA is a utility token powering the Era ecosystem, enabling governance, staking rewards, and decentralized protocol participation. It facilitates smart contract interactions, DeFi protocols, and community-driven development within the Web3 infrastructure layer.
ERA has demonstrated strong upward momentum throughout 2025, with consistent gains driven by increased adoption and ecosystem development. The token appreciated significantly, reflecting positive market sentiment and growing utility within the ERA network ecosystem.
How to analyze ERA's price trends? What are the key indicators for technical and fundamental analysis?
Technical analysis focuses on price charts, moving averages, RSI, and trading volume. Fundamental analysis examines project developments, tokenomics, ecosystem growth, and market adoption. Monitor on-chain metrics, developer activity, and community sentiment for comprehensive ERA price evaluation.
What are the main factors affecting ERA price predictions? How do market sentiment, liquidity, and macroeconomic factors influence it?
ERA price is primarily driven by market sentiment, trading volume, liquidity depth, and macroeconomic conditions. Positive sentiment and high liquidity typically support upward momentum, while macroeconomic changes and reduced trading activity may create downward pressure on pricing.
What are the risks of investing in ERA tokens? How should I mitigate them?
ERA token investments carry market volatility, liquidity, and regulatory risks. Mitigate by diversifying your portfolio, investing only what you can afford to lose, staying informed on project developments, and using dollar-cost averaging for gradual entry.
What are the advantages and disadvantages of ERA compared to similar tokens?
ERA offers lower transaction fees and faster confirmation times. Its decentralized governance provides community control. However, it faces lower trading volume compared to established tokens, limiting liquidity and market adoption.
* The information is not intended to be and does not constitute financial advice or any other recommendation of any sort offered or endorsed by Gate.