This comprehensive analysis examines Caldera (ERA) price trajectory from 2026-2031, offering expert market forecasts for blockchain infrastructure investors. ERA, trading at $0.1986 with $29.49M market cap, demonstrates strong ecosystem fundamentals with 850M+ transactions across 25M addresses. The article evaluates historical price evolution, current market sentiment, and token distribution dynamics. Professional price predictions range from $0.192-$0.230 in 2026 to $0.343-$0.520 by 2030-2031 under favorable conditions. Strategic investment approaches include long-term holding, active trading via technical analysis, and dollar-cost averaging through Gate.com. Risk management frameworks address volatility concerns, regulatory uncertainties, and smart contract vulnerabilities, while detailed FAQ sections clarify ERA's competitive advantages and investment credibility factors for both beginners and experienced crypto participants.
Introduction: ERA's Market Position and Investment Value
Caldera (ERA), positioned as The Internet of Rollups platform dedicated to making cryptocurrency faster, cheaper, and more interconnected, has achieved notable milestones since its launch in 2025. As of January 21, 2026, ERA maintains a market capitalization of approximately $29.49 million with a circulating supply of 148.5 million tokens, trading at around $0.1986. This asset, recognized as an innovative rollup infrastructure solution, is playing an increasingly vital role in blockchain interoperability and scalability.
Caldera's ecosystem has secured over $400 million in total value and processed more than 850 million transactions across 25 million unique addresses, surpassing certain established Layer 2 solutions in terms of unique address count. This growth demonstrates Caldera's capacity to meet real-world demand while maintaining operational reliability and efficiency.
This article provides a comprehensive analysis of ERA's potential price trajectory from 2026 to 2031, incorporating historical patterns, market supply-demand dynamics, ecosystem development, and macroeconomic conditions to offer professional price projections and practical investment strategies for stakeholders.
I. ERA Price History Review and Market Status
ERA Historical Price Evolution Trajectory
- 2025: Project launched in mid-July, price reached $1.85 during initial listing period
- 2025: Market experienced significant volatility, price declined to $0.1759 by mid-December
- Recent Period: Price demonstrated modest recovery with 1.53% increase over 30-day period
ERA Current Market Situation
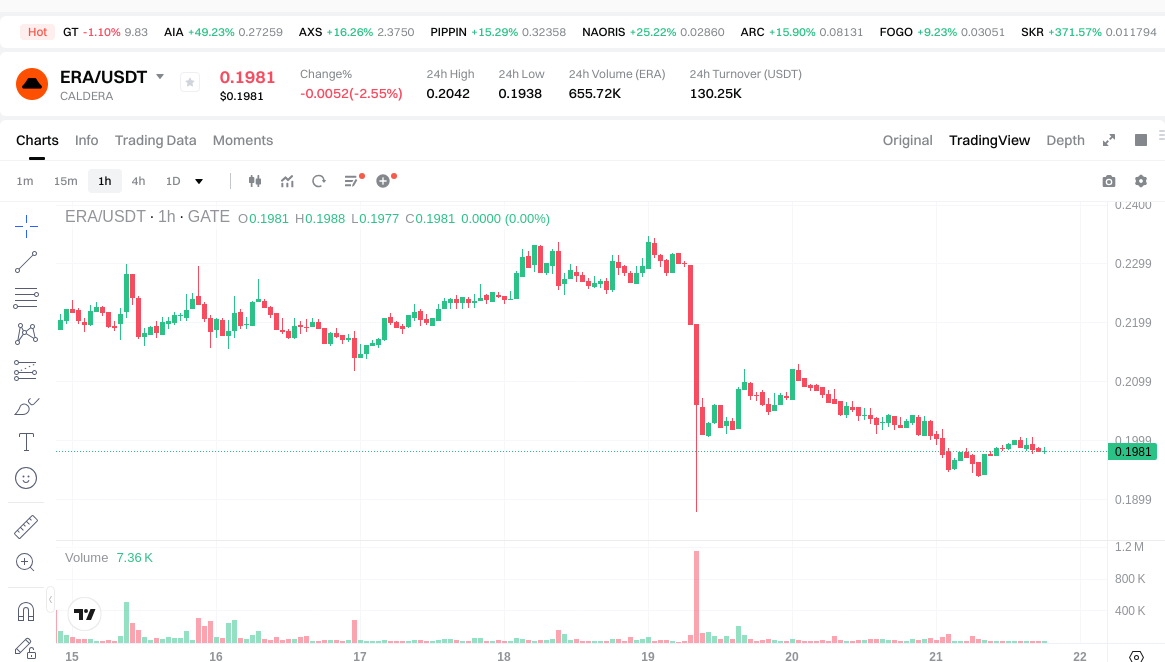
As of January 21, 2026, ERA is trading at $0.1986, showing a 24-hour decline of 2.31%. The token has experienced a slight hourly decrease of 0.05%, while demonstrating a 7-day decline of 10.7%. Over the past year, ERA has declined by 55.44%.
The 24-hour trading range spans from $0.1938 to $0.2042, with total trading volume reaching $129,941.71. The current market capitalization stands at $29.49 million, with a circulating supply of 148.5 million tokens representing 14.85% of the total supply of 1 billion tokens. The fully diluted market cap is calculated at $198.6 million.
ERA holds a market ranking of #720 with a market dominance of 0.0062%. The token operates on the Ethereum blockchain as an ERC-20 token and has been listed on 32 exchanges, with approximately 19,658 holders. The project's ecosystem has processed over 850 million transactions across more than 25 million unique addresses, securing over $400 million in total value.
Click to view current ERA market price
ERA Market Sentiment Indicator
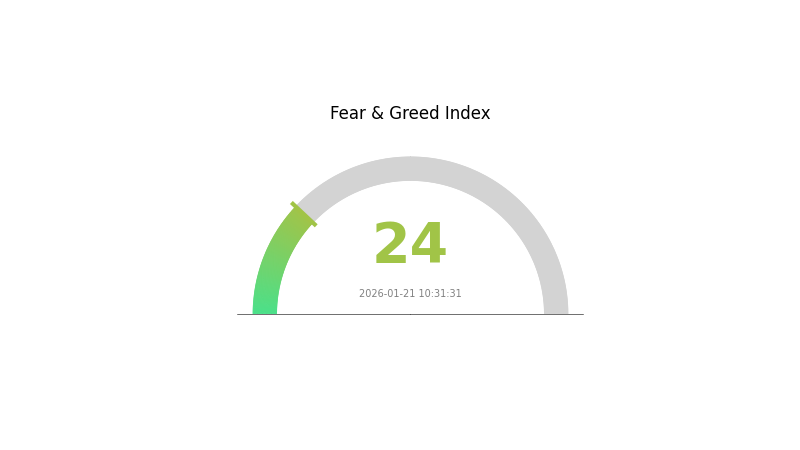
2026-01-21 Fear and Greed Index: 24 (Extreme Fear)
Click to view current Fear & Greed Index
The cryptocurrency market is currently experiencing extreme fear with an index reading of 24. This sentiment reflects significant market pessimism and risk aversion among investors. During such periods, market volatility typically increases as participants reassess their positions. Extreme fear often presents contrarian opportunities for long-term investors, as assets may be undervalued. However, caution is advised when entering positions during high-fear environments, as downward pressure may continue. Monitor key support levels and consider dollar-cost averaging strategies to manage risk effectively during this fearful market phase.
ERA Token Holding Distribution
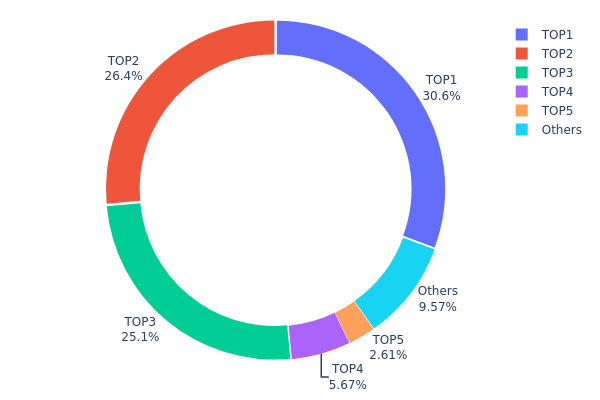
The token holding distribution chart reflects the concentration of ERA tokens across different wallet addresses, revealing the degree of decentralization and the potential influence of large holders (whales) on market dynamics. By analyzing the distribution pattern, we can assess whether the token is subject to excessive centralization, which could pose risks to price stability and market manipulation.
According to the current data, ERA exhibits significant concentration among top holders. The top three addresses collectively control 82.14% of the total token supply, with the largest holder possessing 30.64%, the second 26.41%, and the third 25.09%. The top five addresses account for 90.42% of all tokens, while the remaining addresses hold only 9.58%. This highly concentrated distribution pattern suggests that ERA's on-chain structure is predominantly controlled by a small number of entities, which raises concerns about centralization risks.
Such extreme concentration can significantly impact market structure and price volatility. Large holders possess substantial power to influence token prices through coordinated selling or buying activities. This concentration increases the potential for market manipulation and heightens volatility risks, as any significant movement by top holders could trigger dramatic price swings. Additionally, the limited distribution among smaller addresses indicates relatively low retail participation, which may constrain organic trading volume and liquidity depth. From a decentralization perspective, ERA's current holding structure falls short of the ideal distributed ownership model typically associated with blockchain projects, potentially affecting long-term market confidence and sustainable development.
Click to view current ERA Token Holding Distribution
| Top |
Address |
Holding Qty |
Holding (%) |
| 1 |
0xb92d...59f983 |
306447.21K |
30.64% |
| 2 |
0x0306...516551 |
264173.87K |
26.41% |
| 3 |
0xf214...d499cd |
250900.00K |
25.09% |
| 4 |
0x1669...9f7cf3 |
56707.17K |
5.67% |
| 5 |
0xf977...41acec |
26100.75K |
2.61% |
| - |
Others |
95671.00K |
9.58% |
II. Core Factors Affecting ERA's Future Price
Based on the current available information, there is insufficient data to provide a comprehensive analysis of ERA's price-influencing factors. The core elements that typically drive cryptocurrency valuations—including supply mechanisms, institutional dynamics, macroeconomic conditions, and technical developments—require specific project data that is not present in the provided materials.
For a thorough assessment of ERA's price trajectory, investors should monitor official project announcements, on-chain metrics, and verified ecosystem developments as they become available.
III. 2026-2031 ERA Price Prediction
2026 Outlook
- Conservative prediction: $0.192 - $0.198
- Neutral prediction: $0.198 - $0.230
- Optimistic prediction: $0.230 (requires favorable market conditions and increased adoption)
2027-2029 Mid-term Outlook
- Market stage expectation: The market may enter a recovery and growth phase, with ERA potentially benefiting from broader crypto market trends and technological developments.
- Price range prediction:
- 2027: $0.150 - $0.315
- 2028: $0.169 - $0.370
- 2029: $0.193 - $0.438
- Key catalysts: Market maturity, potential technological upgrades, increasing ecosystem participation, and favorable regulatory developments could drive price appreciation.
2030-2031 Long-term Outlook
- Baseline scenario: $0.343 - $0.513 (assuming steady ecosystem growth and stable market conditions)
- Optimistic scenario: $0.377 - $0.512 (assuming accelerated adoption and positive market sentiment)
- Transformative scenario: Above $0.520 (requires exceptional market conditions, breakthrough technological innovations, or significant institutional adoption)
- 2026-01-21: ERA shows potential for gradual price appreciation over the forecast period, with predicted increases ranging from moderate growth in 2026 to potential 89%-124% gains by 2030-2031 under favorable conditions.
| Year |
Predicted High Price |
Predicted Average Price |
Predicted Low Price |
Price Change |
| 2026 |
0.2298 |
0.1981 |
0.19216 |
0 |
| 2027 |
0.3145 |
0.21395 |
0.14976 |
7 |
| 2028 |
0.36992 |
0.26423 |
0.1691 |
33 |
| 2029 |
0.43756 |
0.31707 |
0.19341 |
59 |
| 2030 |
0.51315 |
0.37731 |
0.34336 |
89 |
| 2031 |
0.51202 |
0.44523 |
0.3829 |
124 |
IV. ERA Professional Investment Strategy and Risk Management
ERA Investment Methodology
(1) Long-term Holding Strategy
- Suitable for: Investors with a multi-year investment horizon who believe in the development potential of Rollup infrastructure and seek exposure to blockchain interoperability solutions
- Operational Recommendations:
- Consider accumulating positions gradually during periods of price consolidation, particularly when the token trades below its 30-day moving average
- Monitor key ecosystem metrics such as Total Value Locked (TVL), transaction volume, and unique address growth to assess network adoption trajectory
- Implement a secure storage solution using Gate Web3 Wallet for convenient access combined with hardware wallet backup for larger holdings
(2) Active Trading Strategy
- Technical Analysis Tools:
- Moving Averages: Utilize 7-day and 30-day moving averages to identify short-term trend reversals and potential entry/exit points based on crossover signals
- Volume Analysis: Monitor 24-hour trading volume relative to historical averages to confirm price movements and identify potential breakout or breakdown scenarios
- Swing Trading Considerations:
- Given the token's demonstrated volatility (24-hour change of -2.31%, 7-day change of -10.7%), swing traders should implement strict stop-loss orders at 5-8% below entry points
- Consider taking partial profits during periods of rapid appreciation, as the token has shown susceptibility to short-term pullbacks
ERA Risk Management Framework
(1) Asset Allocation Principles
- Conservative Investors: 1-3% of cryptocurrency portfolio allocation
- Moderate Investors: 3-7% of cryptocurrency portfolio allocation
- Aggressive Investors: 7-15% of cryptocurrency portfolio allocation
(2) Risk Mitigation Approaches
- Portfolio Diversification: Maintain exposure to multiple blockchain infrastructure projects rather than concentrating solely in ERA to reduce project-specific risk
- Dollar-Cost Averaging: Consider implementing systematic purchase plans to smooth out the impact of price volatility over time
(3) Secure Storage Solutions
- Hot Wallet Option: Gate Web3 Wallet provides convenient access for active trading and interaction with decentralized applications while maintaining reasonable security standards
- Cold Storage Approach: For holdings intended for long-term storage, consider transferring a significant portion to hardware wallet solutions with secure backup of recovery phrases
- Security Considerations: Always verify contract addresses when interacting with ERA tokens (ETH contract: 0xe2ad0bf751834f2fbdc62a41014f84d67ca1de2a), enable two-factor authentication on all exchange accounts, and never share private keys or seed phrases
V. ERA Potential Risks and Challenges
ERA Market Risks
- Price Volatility: ERA has demonstrated significant price fluctuations, with a 7-day decline of 10.7% and a one-year decline of 55.44%, indicating substantial downside risk during unfavorable market conditions
- Limited Circulating Supply: With only 14.85% of total supply currently circulating (148.5 million out of 1 billion tokens), future token unlocks could create substantial selling pressure
- Market Cap Concentration: With a market capitalization of approximately $29.49 million and market dominance of only 0.0062%, ERA remains a relatively small-cap asset susceptible to low liquidity and significant price swings
ERA Regulatory Risks
- Cryptocurrency Regulation Evolution: Changes in regulatory frameworks across major jurisdictions could impact the operational capabilities of Rollup platforms and affect ERA token utility
- Securities Classification Uncertainty: Evolving regulatory guidance on token classifications may affect ERA's trading availability or compliance requirements
- Cross-Chain Transaction Scrutiny: As regulatory bodies increase focus on cross-chain asset transfers, platforms facilitating such transactions may face additional compliance burdens
ERA Technical Risks
- Smart Contract Vulnerabilities: As an ERC-20 token on Ethereum, ERA is subject to potential smart contract exploits or bugs that could affect token functionality or user funds
- Rollup Technology Competition: The Layer 2 scaling solution space is highly competitive, with established players and new entrants potentially offering superior technology or economics
- Interoperability Challenges: While Caldera aims to create seamless cross-chain connectivity, technical complexities in achieving true interoperability may hinder adoption or introduce unforeseen issues
VI. Conclusion and Action Recommendations
ERA Investment Value Assessment
Caldera (ERA) presents a speculative investment opportunity in the blockchain infrastructure sector, specifically targeting the Rollup ecosystem and cross-chain interoperability. The project has demonstrated early traction with over 850 million transactions processed and 25 million unique addresses served, indicating meaningful network activity. However, investors should carefully weigh this operational success against significant market headwinds, including a 55.44% decline over the past year and current trading levels substantially below the all-time high of $1.85.
The long-term value proposition centers on Caldera's vision of creating an interconnected "Internet of Rollups" that could address fundamental blockchain scalability and interoperability challenges. With only 14.85% of tokens currently in circulation, the project retains substantial room for ecosystem expansion and potential value appreciation if adoption accelerates. Nevertheless, the low market dominance (0.0062%) and relatively modest market capitalization suggest ERA remains an early-stage, high-risk asset requiring careful position sizing and active risk management.
ERA Investment Recommendations
✅ Beginners: Consider limiting initial exposure to no more than 1-2% of total cryptocurrency holdings, focusing on understanding Rollup technology fundamentals before increasing position size. Use Gate.com's user-friendly interface to make small, exploratory purchases while dedicating time to monitoring ecosystem developments
✅ Experienced Investors: Allocate 3-7% of cryptocurrency portfolio to ERA as part of a diversified Layer 2 infrastructure thesis, implementing dollar-cost averaging during periods of market consolidation. Actively monitor on-chain metrics, transaction volume trends, and competitive positioning relative to other Rollup solutions
✅ Institutional Investors: Conduct comprehensive due diligence on Caldera's technology stack, team credentials, and tokenomics structure before establishing positions. Consider ERA as a tactical allocation within a broader blockchain infrastructure portfolio, with position sizing determined by risk tolerance and correlation analysis with existing holdings
ERA Trading Participation Methods
- Spot Trading on Gate.com: Access ERA through Gate.com's spot trading platform, which offers competitive liquidity and trading pairs for both entry and exit positions
- Dollar-Cost Averaging Programs: Establish recurring purchase schedules to accumulate ERA systematically over time, reducing the impact of short-term price volatility on overall position cost basis
- Risk-Managed Position Building: Implement phased entry strategies with clearly defined price targets and stop-loss levels, adjusting position size based on market conditions and personal risk tolerance
Cryptocurrency investments carry extremely high risk, and this article does not constitute investment advice. Investors should make prudent decisions based on their own risk tolerance and are advised to consult professional financial advisors. Never invest more than you can afford to lose.
FAQ
What is the current price of ERA token, and what are its all-time high and all-time low prices?
ERA token's current price fluctuates based on market conditions. Historical data shows it has reached notable highs and lows since launch. For real-time pricing, check major trading platforms. ERA has demonstrated volatility typical of emerging crypto assets, with significant price movements reflecting market sentiment and adoption growth.
What is the potential future price of ERA tokens? What factors will influence ERA's price trajectory?
ERA's future price depends on adoption rates, market demand, ecosystem development, and broader crypto market conditions. Strong fundamentals and increasing utility could drive significant growth, while market volatility and competition present challenges to price appreciation.
What are the advantages and disadvantages of ERA tokens compared to similar projects?
ERA offers superior scalability and lower transaction costs through its innovative layer-2 solution. Key advantages include faster settlement times and community-driven governance. Disadvantages include newer market presence and smaller liquidity compared to established competitors, requiring time to build ecosystem maturity.
What is ERA token's team background and project progress? How will this affect long-term price?
ERA's experienced team has delivered strong technical milestones and ecosystem growth. Continuous development, partnerships, and community expansion position ERA for sustained appreciation. Market sentiment and adoption trends suggest positive long-term price trajectory.
What are the main risks of investing in ERA tokens? How should I evaluate the credibility of price predictions?
ERA token risks include market volatility, liquidity fluctuations, and regulatory changes. Evaluate predictions by analyzing on-chain metrics, trading volume trends, developer activity, and community sentiment. Consider historical price patterns and fundamental project developments for comprehensive assessment.
Why does ERA token price differ across exchanges? Where is it safer to buy?
ERA price variations stem from differences in trading volume, liquidity, and market conditions across platforms. Choose established exchanges with strong security measures, regulatory compliance, and high trading volume to ensure safety and optimal pricing.
* The information is not intended to be and does not constitute financial advice or any other recommendation of any sort offered or endorsed by Gate.