This comprehensive article analyzes Ergo (ERG) as a DeFi infrastructure platform with EUTXO model and PoW consensus, currently trading at $0.44 with $36.55M market cap. It examines ERG's historical trajectory from 2017 inception through current market positioning at rank 636, addressing key investment considerations for cryptocurrency investors. The article reviews 2026-2031 price scenarios ranging from $0.26-$0.86 based on market conditions, ecosystem development, and adoption metrics. It provides actionable investment strategies including long-term holding, active trading approaches, and portfolio allocation frameworks for conservative, experienced, and institutional investors. Risk management protocols cover liquidity constraints, regulatory scrutiny of PoW mechanisms, and technical security considerations. Storage solutions via Gate Web3 Wallet are recommended for secure asset custody. The guide concludes with differentiated recommendations for investor profiles and emphasizes conducting thorough due dili
Introduction: ERG's Market Position and Investment Value
Ergo (ERG), positioned as a highly adaptable contract currency platform designed to provide efficient, secure, and user-friendly implementation of financial contracts, has achieved notable recognition since its inception in 2017. As of 2026, Ergo maintains a market capitalization of approximately $36.55 million, with a circulating supply of around 82.75 million tokens, and its price hovers around $0.44. This asset, recognized as a "true decentralized DeFi underlying public chain," is playing an increasingly vital role in the decentralized finance ecosystem through its innovative EUTXO model and Autolykos PoW consensus mechanism.
This article will comprehensively analyze ERG's price trajectory from 2026 to 2031, incorporating historical patterns, market supply-demand dynamics, ecosystem development, and macroeconomic conditions, to provide investors with professional price forecasts and practical investment strategies.
I. ERG Price History Review and Market Status
ERG Historical Price Evolution Trajectory
- 2019: Ergo mainnet launched on July 1st, marking the beginning of ERG trading activity in the cryptocurrency market.
- 2020: The token reached its all-time low price of $0.094191 on March 13th, reflecting early-stage market price discovery.
- 2021: ERG achieved its all-time high of $18.72 on September 3rd, representing a significant appreciation during the broader cryptocurrency bull market.
- 2025-2026: The token experienced a decline of 72.86% over the past year, with the price falling from approximately $1.63 to the current level.
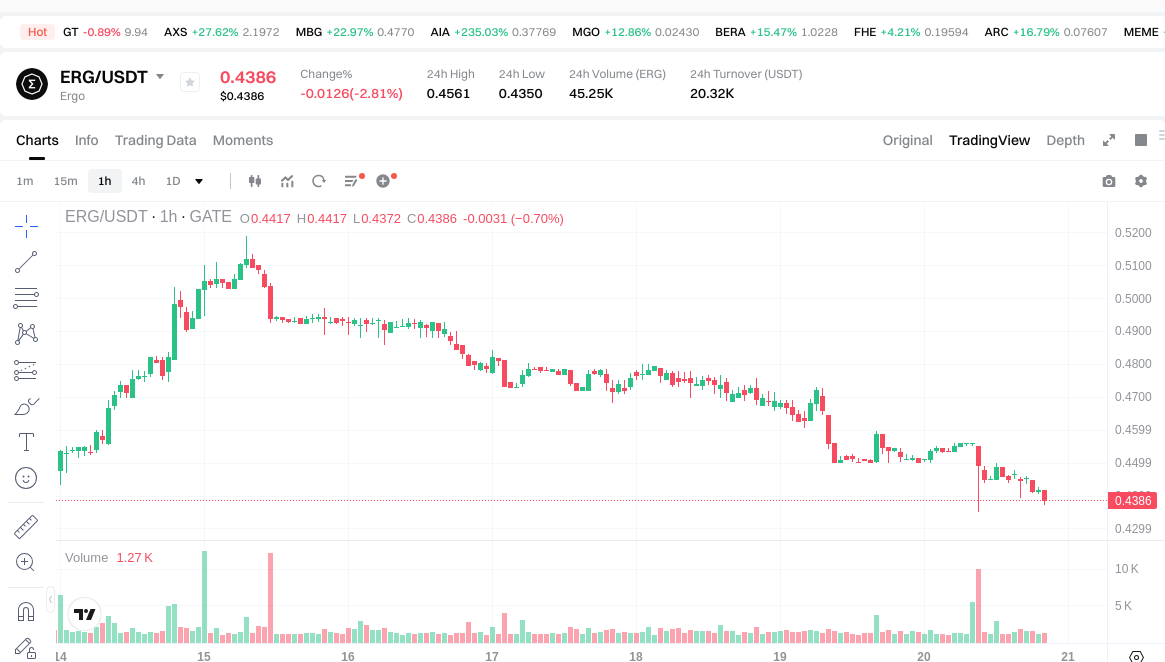
ERG Current Market Status
As of January 20th, 2026, ERG is trading at $0.4417, with a 24-hour trading volume of $20,074.46. The token has experienced a 2.12% decrease over the past 24 hours, with an intraday high of $0.4561 and low of $0.435. Over the past hour, ERG declined by 0.16%, while the 7-day performance shows a 0.61% decrease. The 30-day trend indicates a more substantial decline of 10.39%.
ERG currently holds a market ranking of 636, with a circulating supply of 82,751,478 tokens out of a maximum supply of 97,739,924, representing approximately 84.66% of the total supply. The circulating market capitalization stands at $36,551,327.83, while the fully diluted market cap is $43,171,724.43. The token's market dominance is 0.0013%.
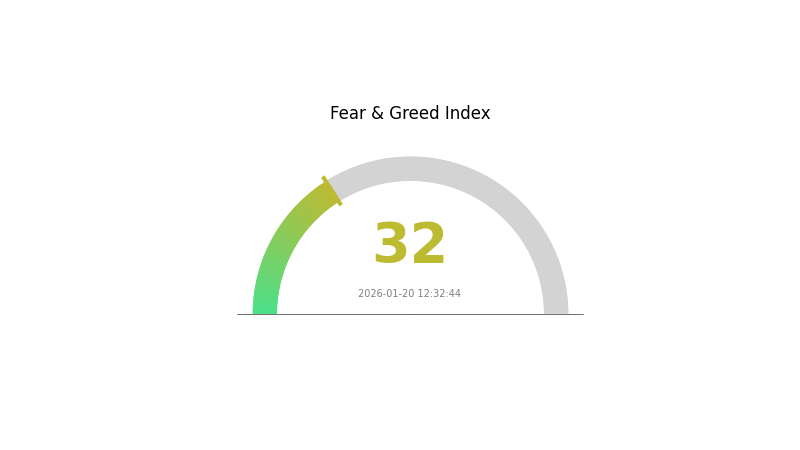
The cryptocurrency market is currently experiencing a "Fear" sentiment with a VIX index of 32, which may be influencing short-term price movements across digital assets, including ERG.
Click to view the current ERG market price
ERG Market Sentiment Indicator
2026-01-20 Fear and Greed Index: 32 (Fear)
Click to view current Fear & Greed Index
The cryptocurrency market is currently showing significant fear sentiment. With the Fear and Greed Index at 32, market participants are displaying heightened caution and risk aversion. This level typically indicates that investors are concerned about potential downside risks and market volatility. During periods of fear, experienced traders often view this as a potential opportunity to accumulate assets at lower valuations, while risk-averse investors may prefer to maintain defensive positions. Market participants should monitor key support levels and overall market conditions closely during this sentiment phase.
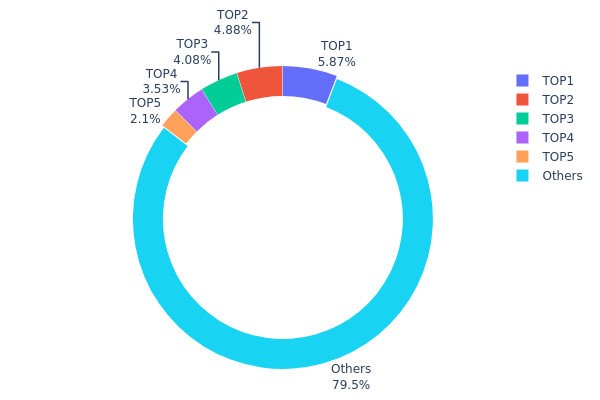
ERG Holding Distribution
The holding distribution chart reveals the concentration of asset ownership across different addresses within the blockchain network. This metric serves as a crucial indicator for assessing the degree of decentralization and potential market manipulation risks. For ERG, the current on-chain data demonstrates a relatively moderate concentration pattern. The top five addresses collectively hold approximately 20.44% of the total supply, with the largest single address (9iKFBB...D4VykC) accounting for 5.86%, followed by the second-largest at 4.87%. The remaining 79.56% is distributed among other addresses, suggesting a reasonably dispersed ownership structure.
This distribution pattern indicates that ERG maintains a healthy level of decentralization compared to projects where top holders control over 40-50% of the supply. The absence of any single address holding more than 6% of total tokens reduces the risk of significant price manipulation or sudden market impact from large-scale sell-offs. However, the combined influence of the top five addresses still warrants attention during periods of market volatility, as coordinated movements could potentially affect short-term price dynamics.
From a structural perspective, ERG's current holding distribution reflects a maturing ecosystem with growing participation from diverse stakeholders. The substantial 79.56% held by smaller addresses suggests active community engagement and broader token circulation, which typically contributes to improved liquidity and market stability. This balanced distribution pattern also indicates reduced vulnerability to whale-driven volatility, positioning ERG favorably within the proof-of-work blockchain sector in terms of on-chain governance and economic security.
Click to view current ERG Holding Distribution
| Top |
Address |
Holding Qty |
Holding (%) |
| 1 |
9iKFBB...D4VykC |
4853.83K |
5.86% |
| 2 |
9gD9kh...MRgd8i |
4038.01K |
4.87% |
| 3 |
9fpUtN...aBar1Z |
3376.48K |
4.08% |
| 4 |
HNJiaJ...Gpd9sL |
2924.37K |
3.53% |
| 5 |
9fu1mL...EAJENo |
1740.25K |
2.10% |
| - |
Others |
65816.18K |
79.56% |
II. Core Factors Affecting ERG's Future Price
Based on the available information, there is insufficient data in the provided materials to comprehensively analyze the core factors affecting ERG's future price. The reference materials do not contain specific information about supply mechanisms, institutional holdings, macroeconomic impacts, or technical developments related to ERG.
Without verifiable data from credible sources, we cannot provide accurate analysis on supply dynamics, major holder activities, macroeconomic environment influences, or technological ecosystem developments for this cryptocurrency. Any projections or analyses would require substantial additional research and verified information sources.
III. 2026-2031 ERG Price Predictions
2026 Outlook
- Conservative Prediction: $0.26 - $0.44
- Neutral Prediction: $0.44 (average scenario)
- Optimistic Prediction: $0.53 (requires favorable market conditions and increased adoption)
2027-2029 Outlook
- Market Stage Expectation: Gradual growth phase with potential consolidation periods as the project establishes stronger market presence
- Price Range Predictions:
- 2027: $0.25 - $0.61, with approximately 10% growth anticipated
- 2028: $0.49 - $0.61, reflecting approximately 23% growth potential
- 2029: $0.47 - $0.76, showing approximately 31% growth trajectory
- Key Catalysts: Technology development progress, ecosystem expansion, and broader cryptocurrency market trends
2030-2031 Long-term Outlook
- Baseline Scenario: $0.44 - $0.67 (assuming steady market development)
- Optimistic Scenario: $0.67 - $0.82 (with enhanced adoption and favorable regulatory environment)
- Transformative Scenario: $0.57 - $0.86 (under conditions of significant breakthrough in technology implementation and mainstream acceptance)
- 2026-01-20: ERG trading range expected between $0.26 - $0.53 (early-stage market positioning)
| Year |
Predicted High Price |
Predicted Average Price |
Predicted Low Price |
Price Change |
| 2026 |
0.53446 |
0.4417 |
0.25619 |
0 |
| 2027 |
0.60522 |
0.48808 |
0.2538 |
10 |
| 2028 |
0.61225 |
0.54665 |
0.49198 |
23 |
| 2029 |
0.76487 |
0.57945 |
0.46935 |
31 |
| 2030 |
0.82003 |
0.67216 |
0.44362 |
52 |
| 2031 |
0.85801 |
0.7461 |
0.57449 |
69 |
IV. ERG Professional Investment Strategy and Risk Management
ERG Investment Methodology
(1) Long-term Holding Strategy
- Suitable for: Investors seeking exposure to DeFi infrastructure and PoW consensus mechanisms
- Operational Recommendations:
- Consider accumulation during market corrections while monitoring the support level around $0.44
- Establish position limits based on personal risk tolerance, given the -72.86% annual decline
- Storage Solution: Utilize Gate Web3 Wallet for secure custody with multi-signature options
(2) Active Trading Strategy
- Technical Analysis Tools:
- Support/Resistance Levels: Monitor the 24-hour range between $0.435 (low) and $0.4561 (high) for trading boundaries
- Volume Analysis: Track daily trading volume ($20,074.46) relative to market cap ($36.55M) to assess liquidity conditions
- Swing Trading Considerations:
- Short-term volatility presents opportunities, with 24-hour change at -2.12%
- Weekly performance (-0.61%) suggests potential consolidation phase
ERG Risk Management Framework
(1) Asset Allocation Principles
- Conservative Investors: 1-3% of crypto portfolio allocation
- Aggressive Investors: 3-7% of crypto portfolio allocation
- Professional Investors: Up to 10% with active hedging strategies
(2) Risk Hedging Approaches
- Portfolio Diversification: Balance ERG exposure with established cryptocurrencies to mitigate concentration risk
- Position Sizing: Implement stop-loss mechanisms given the 98.8% distance from all-time high of $18.72
(3) Security Storage Solutions
- Hot Wallet Recommendation: Gate Web3 Wallet for active trading positions
- Cold Storage Approach: Consider hardware wallet solutions for long-term holdings exceeding 30% of position
- Security Precautions: Enable two-factor authentication and regularly review wallet permissions
V. ERG Potential Risks and Challenges
ERG Market Risks
- Liquidity Constraints: With market cap of $36.55M and ranking at 636, ERG exhibits limited trading depth compared to major assets
- Volatility Exposure: Annual decline of -72.86% demonstrates significant price instability
- Market Share: Currently represents only 0.0013% of total crypto market capitalization
ERG Regulatory Risks
- PoW Consensus Scrutiny: Proof-of-Work mechanisms may face increasing regulatory examination regarding energy consumption
- DeFi Compliance: Evolving regulatory frameworks for decentralized finance platforms could impact operational models
- Cross-border Operations: Regulatory uncertainty across different jurisdictions may affect platform accessibility
ERG Technical Risks
- Network Security: As a PoW-based system, vulnerability to potential 51% attacks if hash rate concentration occurs
- Smart Contract Complexity: EUTXO model implementation requires specialized development expertise, potentially limiting ecosystem growth
- Competition Pressure: Established DeFi platforms on alternative blockchains present significant competitive challenges
VI. Conclusion and Action Recommendations
ERG Investment Value Assessment
Ergo presents a unique value proposition through its EUTXO model and Autolykos PoW consensus mechanism, targeting sophisticated DeFi applications. However, the substantial 72.86% annual decline and modest market capitalization of $36.55M indicate considerable risk factors. The platform's technical innovation and experienced development team offer long-term potential, but short-term volatility and limited market adoption remain significant concerns. With 84.66% of maximum supply already circulating and no inflation mechanism, tokenomics provide scarcity dynamics, though this has not translated to price appreciation in recent periods.
ERG Investment Recommendations
✅ Beginners: Limit exposure to 1-2% of total crypto portfolio; prioritize education about EUTXO model and PoW mechanisms before investment
✅ Experienced Investors: Consider 3-5% allocation as speculative DeFi infrastructure play; implement strict stop-loss parameters
✅ Institutional Investors: Evaluate as potential portfolio diversification component within alternative Layer-1 blockchain thesis; conduct thorough due diligence on development roadmap
ERG Trading Participation Methods
- Spot Trading: Execute purchases through Gate.com with careful attention to entry points during consolidation phases
- Dollar-Cost Averaging: Implement systematic purchase strategy to mitigate timing risk given current volatility patterns
- Research-Based Approach: Monitor platform development updates and ecosystem growth metrics before position establishment
Cryptocurrency investment carries extremely high risk, and this article does not constitute investment advice. Investors should make cautious decisions based on their own risk tolerance and are advised to consult professional financial advisors. Never invest more than you can afford to lose.
FAQ
What are the main factors affecting ERG price prediction?
ERG price is influenced by network activity, developer adoption, market sentiment, Bitcoin correlation, transaction volume, protocol upgrades, and broader cryptocurrency market trends.
How to analyze ERG's technical and fundamental aspects to predict price trends?
Analyze ERG's technical aspects by examining price charts, moving averages, and resistance levels. For fundamentals, monitor network activity, development updates, and transaction volume. Combine both indicators: rising transaction volume with positive technical signals suggests upward momentum, while declining metrics may indicate downside pressure.
ERG has demonstrated resilience through market cycles, with strong fundamentals in blockchain security and smart contracts. The protocol's growing ecosystem and developer adoption position it well for long-term growth. Future potential remains substantial as adoption accelerates and utility expands across DeFi applications.
What are the professional institutions' price predictions for ERG?
Major crypto analysts project ERG could reach $2-5 range by 2026-2027, driven by ecosystem development and increased adoption. However, market conditions and technological progress significantly impact actual outcomes.
How is ERG's price correlation with mainstream cryptocurrencies like Bitcoin and Ethereum?
ERG shows moderate positive correlation with Bitcoin and Ethereum, typically moving in similar market directions. During bull markets, ERG tends to outperform, while in downturns it may experience sharper declines. The correlation varies based on market conditions and trading volume, but generally strengthens during major market movements.
* The information is not intended to be and does not constitute financial advice or any other recommendation of any sort offered or endorsed by Gate.