This comprehensive analysis examines FITFI's price trajectory from 2026 to 2031, providing expert forecasts for investors in the FitFi sector. Currently trading at $0.0007388 with a market cap of $3.29 million, FITFI faces extreme market fear (Fear Index: 16) but shows 30-day recovery of 40.2%. The article reviews historical price evolution, analyzes core market drivers including supply-demand dynamics and ecosystem development, and forecasts potential growth to $0.00124 by 2031—representing a 68% increase from baseline. Key sections cover long-term holding strategies, active trading methodologies, and comprehensive risk management frameworks tailored for different investor types. Investors can trade FITFI on Gate and other supported exchanges, with recommendations emphasizing dollar-cost averaging, portfolio diversification, and secure storage solutions to mitigate volatility risks in this speculative, high-potential asset class.
Introduction: FITFI's Market Position and Investment Value
Step.app (FITFI), positioned as a pioneering FitFi (Fitness Finance) governance token built on Step Protocol, has been developing location-based "x-to-earn" products utilizing NFT and geolocation technology since its launch in 2021. As of 2026, FITFI maintains a market capitalization of approximately $3.29 million, with a circulating supply of around 4.45 billion tokens, and the price hovering near $0.0007388. This asset, recognized as an innovative player in the fitness and blockchain integration space, is playing an increasingly significant role in incentivizing physical activity through blockchain-based reward mechanisms.
This article will comprehensively analyze FITFI's price trends from 2026 to 2031, combining historical patterns, market supply-demand dynamics, ecosystem development, and macroeconomic conditions to provide investors with professional price forecasts and practical investment strategies.
I. FITFI Price History Review and Current Market Status
FITFI Historical Price Evolution Trajectory
- 2022: FITFI reached its peak price of $0.731881 on May 5, 2022, during the early phase of the project's launch
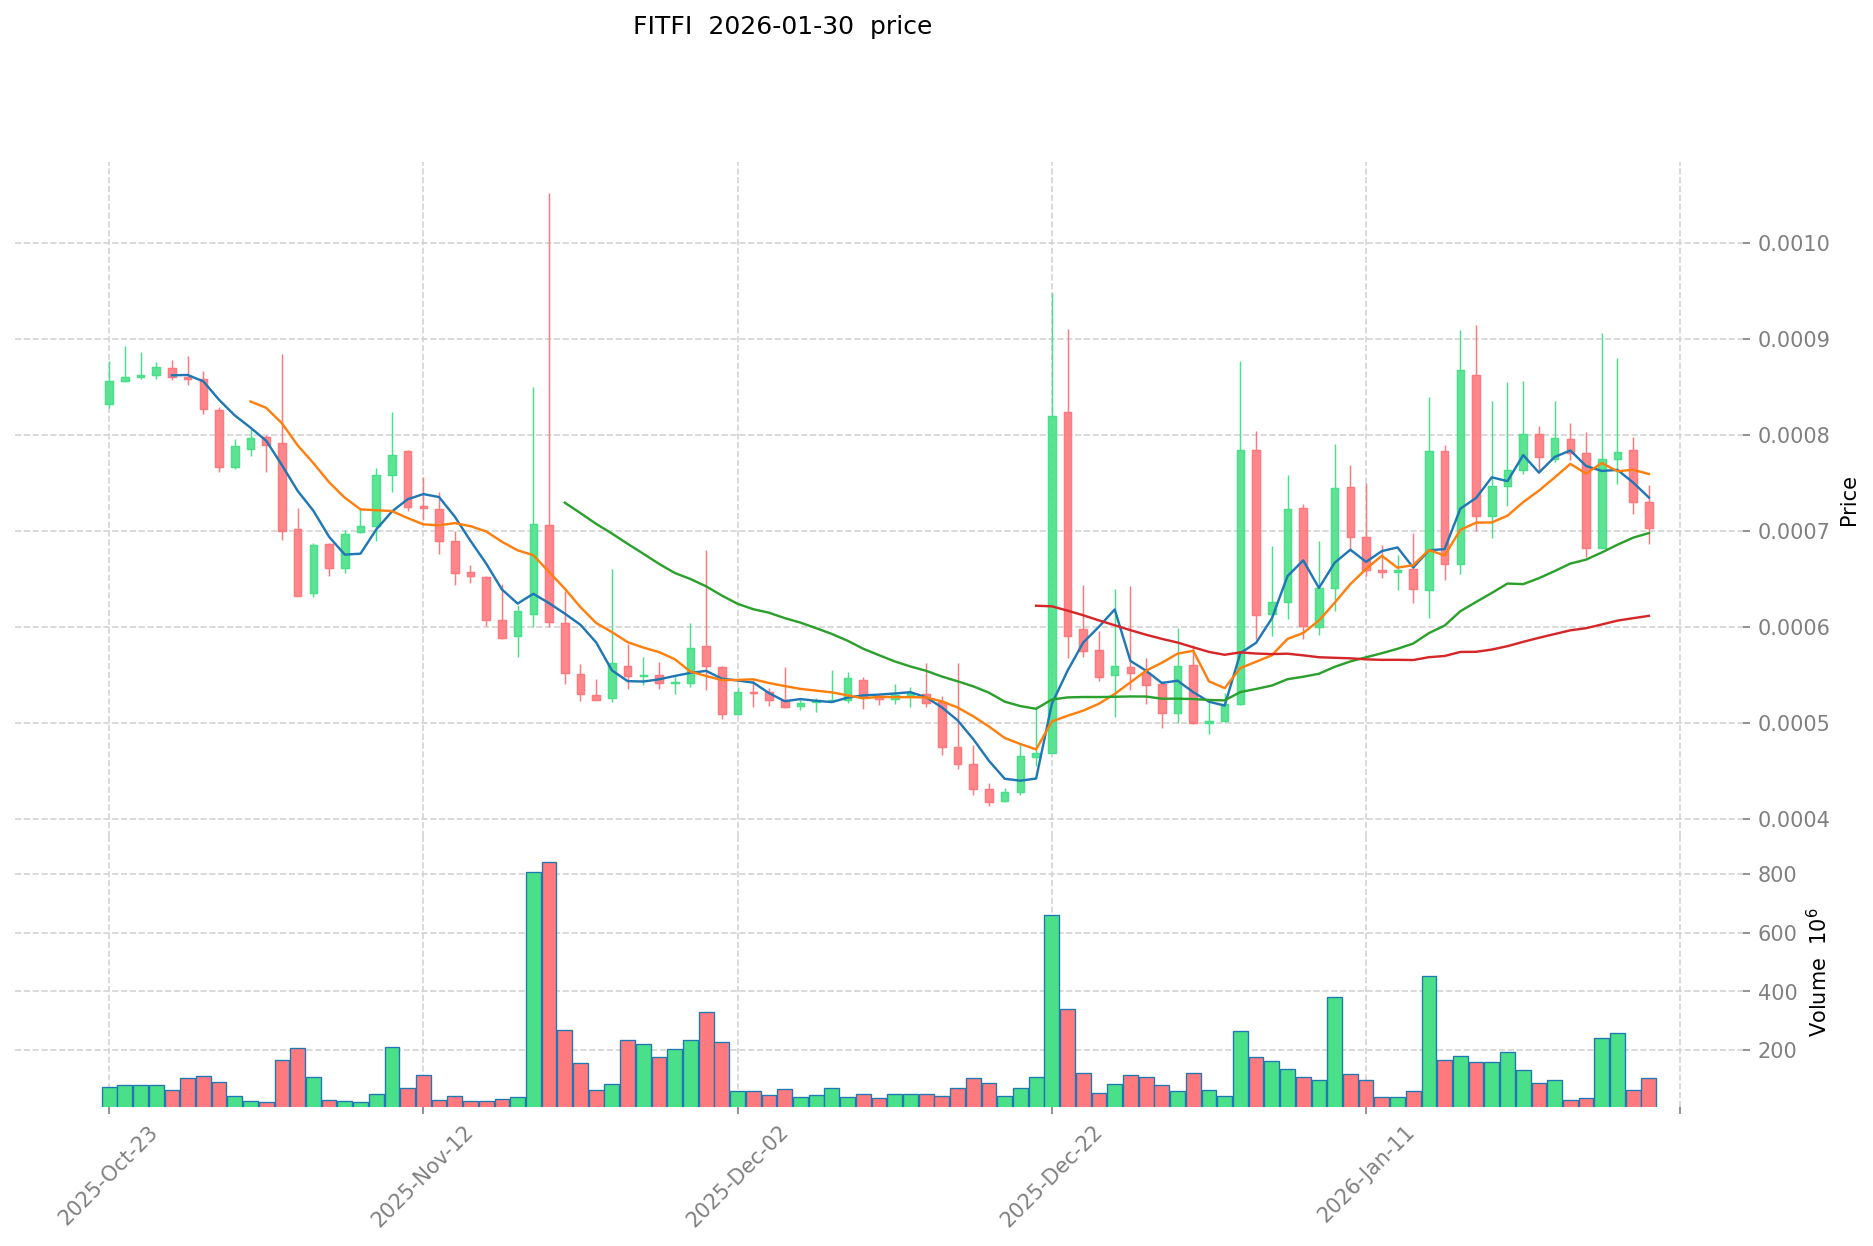
- 2025: The token experienced significant downward pressure, with the price declining to its historical low of $0.00039699 on December 18, 2025
- Recent period: The price has shown some recovery momentum, with a 30-day increase of approximately 40.2%
FITFI Current Market Situation
As of January 31, 2026, FITFI is trading at $0.0007388, with a 24-hour trading volume of $108,358.08. The token has demonstrated notable short-term volatility, recording a 7.22% increase over the past 24 hours, though it remains down 7.57% over the past week.
The circulating supply stands at 4.45 billion FITFI tokens out of a maximum supply of 4.6 billion, representing a circulation rate of 96.74%. The current market capitalization is approximately $3.29 million, with a fully diluted valuation of $3.40 million. The token's market dominance is 0.00011%.
FITFI is currently ranked #1773 in the cryptocurrency market. The 24-hour price range shows fluctuation between $0.0006858 and $0.000761. Despite recent monthly gains, the token has experienced a decline of 75.06% over the past year, reflecting broader market conditions and project-specific developments.
The token is available for trading on 6 exchanges and maintains a presence on the Avalanche C-Chain network. Market sentiment indicators suggest a period of extreme fear in the broader market, which may be influencing short-term price movements.
Click to view the current FITFI market price
FITFI Market Sentiment Index
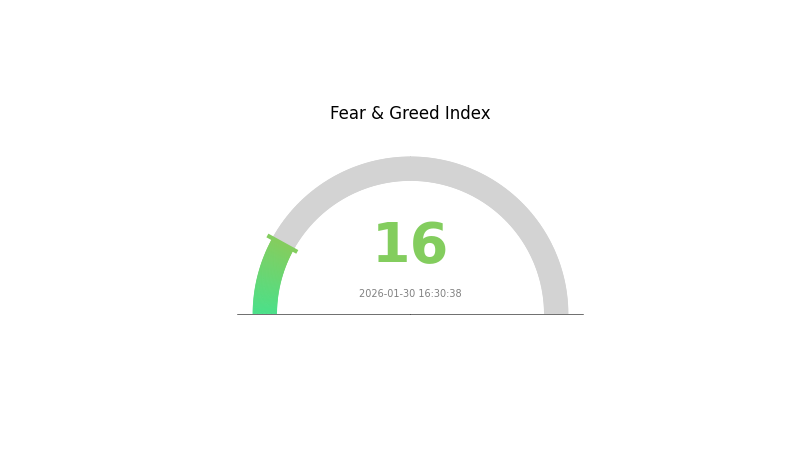
2026-01-30 Fear and Greed Index: 16 (Extreme Fear)
Click to view the current Fear & Greed Index
The cryptocurrency market is currently experiencing extreme fear, with the Fear and Greed Index dropping to 16. This historically low reading indicates intense market pessimism and risk aversion among investors. Such extreme fear conditions often present contrarian opportunities for long-term investors, as assets are typically oversold. However, caution is advised, as markets may continue declining before stabilizing. Monitor key support levels and consider dollar-cost averaging strategies to mitigate volatility risks during this volatile period.
FITFI Token Holdings Distribution
The holdings distribution chart measures the concentration of token ownership across different wallet addresses, revealing the degree of decentralization in token circulation. For FITFI, the current data shows a highly concentrated ownership structure. The top address alone holds 2.499 billion tokens, accounting for 54.32% of the total supply, while the top five addresses collectively control approximately 75% of the circulating tokens. This concentration level significantly exceeds the healthy threshold typically observed in mature crypto assets, where top holders usually account for less than 40% of total supply.
Such extreme concentration poses considerable risks to market stability and price dynamics. When a single entity controls over half of the circulating supply, it creates potential vulnerabilities including heightened price manipulation risk, increased volatility during large transactions, and diminished liquidity depth. The "Others" category, representing all remaining holders, accounts for only 25.06% of supply, suggesting limited distribution among retail participants and smaller institutional investors. This distribution pattern indicates that FITFI's market structure remains heavily influenced by a small number of major stakeholders.
From a decentralization perspective, FITFI's current holdings structure reflects an early-stage or centralized ecosystem characteristic. While concentration isn't inherently negative—it can provide price stability during bear markets—it fundamentally contradicts the decentralization principles of blockchain technology and may deter institutional investors seeking assets with robust liquidity and distributed ownership. The on-chain structural stability remains fragile, as any significant movement from top holders could trigger substantial market reactions.
Click to view current FITFI Holdings Distribution

| Top |
Address |
Holding Qty |
Holding (%) |
| 1 |
0xcd9e...8ac436 |
2498996.63K |
54.32% |
| 2 |
0xa893...3213b3 |
322410.20K |
7.00% |
| 3 |
0xb890...2c5f53 |
266954.48K |
5.80% |
| 4 |
0x7aad...f695fa |
201446.91K |
4.37% |
| 5 |
0x0d07...b492fe |
158939.06K |
3.45% |
| - |
Others |
1151252.73K |
25.06% |
II. Core Factors Influencing FITFI's Future Price
Supply and Demand Dynamics
- Token Supply Mechanism: FITFI and KCAL tokens operate within Step App's Move-to-Earn ecosystem. The price volatility of these tokens is primarily driven by market supply and demand relationships, which can experience significant fluctuations based on user participation levels.
- Price Volatility Pattern: Token prices fluctuate within a certain range around their intrinsic value, following general economic principles where commodity prices are determined by value and influenced by supply-demand dynamics.
- Current Market Impact: The availability and circulation of FITFI tokens in the market directly affect price movements, with higher demand potentially driving price appreciation during favorable market conditions.
Market Sentiment and Adoption
- Overall Market Sentiment: Market sentiment plays a crucial role in determining Step App's price trajectory. During bearish market phases, prices may face downward pressure, while more favorable market environments can support price growth.
- User Adoption Rate: The level of user adoption and application participation directly impacts FITFI's value proposition. Higher engagement within the Step App ecosystem tends to correlate with stronger price performance.
- Application Engagement: Active participation levels within the Move-to-Earn platform serve as a key indicator of the token's utility and potential price momentum.
Competitive Landscape
- Market Competition Intensity: Following the successful validation of the Move-to-Earn concept, the market has seen an influx of new competitors, including projects with more advanced technologies or optimized economic models.
- User and Capital Distribution: Intensifying competition may divert users and capital flows to alternative platforms, potentially impacting FITFI's market position and price stability.
- Innovation Pressure: The emergence of competitors with enhanced technical capabilities or superior tokenomics creates ongoing pressure for Step App to maintain its competitive edge through continuous innovation.
Ecosystem Development
- Move-to-Earn Model Evolution: The development and refinement of the Move-to-Earn mechanism within Step App continues to influence user engagement and token utility.
- Community Growth: The expansion of the user community and ecosystem participants contributes to the long-term sustainability and value proposition of FITFI tokens.
- Platform Enhancements: Ongoing improvements to the Step App platform and user experience may support sustained adoption and positive price sentiment.
III. 2026-2031 FITFI Price Forecast
2026 Outlook
- Conservative prediction: $0.00072
- Neutral prediction: $0.00074
- Optimistic prediction: $0.00086
Based on the forecast data, FITFI is expected to maintain relatively stable price levels throughout 2026, with the average price hovering around $0.00074. The token may experience limited volatility during this period, with a narrow trading range between the predicted low and high prices.
2027-2029 Outlook
- Market stage expectation: Gradual accumulation phase with moderate growth potential
- Price range predictions:
- 2027: $0.00069 - $0.00086
- 2028: $0.00050 - $0.00114
- 2029: $0.00059 - $0.00103
- Key catalysts: Market adoption expansion and ecosystem development
During the mid-term period, FITFI may demonstrate increased price fluctuations. The 2028 projection suggests a wider price range, indicating potential market volatility. By 2029, the average price could reach $0.00098, representing a 33% increase from the baseline period, suggesting growing market interest and broader adoption.
2030-2031 Long-term Outlook
- Baseline scenario: $0.00081 - $0.00148 (assuming steady ecosystem growth)
- Optimistic scenario: Up to $0.00148 in 2030 (driven by favorable market conditions)
- Progressive scenario: $0.00075 - $0.00137 in 2031 (with continued development)
The long-term forecast indicates potential upward momentum, with 2030 showing a possible 36% price change and an average price of $0.00101. By 2031, the predicted average price could reach $0.00124, marking a 68% increase from the initial period. However, investors should note that these projections remain subject to market conditions, technological developments, and broader cryptocurrency ecosystem dynamics.
January 31, 2026: FITFI trading within the predicted range of $0.00072 - $0.00086 (early accumulation phase)
| Year |
Predicted High Price |
Predicted Average Price |
Predicted Low Price |
Price Change |
| 2026 |
0.00086 |
0.00074 |
0.00072 |
0 |
| 2027 |
0.00086 |
0.0008 |
0.00069 |
8 |
| 2028 |
0.00114 |
0.00083 |
0.0005 |
12 |
| 2029 |
0.00103 |
0.00098 |
0.00059 |
33 |
| 2030 |
0.00148 |
0.00101 |
0.00081 |
36 |
| 2031 |
0.00137 |
0.00124 |
0.00075 |
68 |
IV. FITFI Professional Investment Strategies and Risk Management
FITFI Investment Methodology
(I) Long-term Holding Strategy
- Target Investors: Investors who believe in the FitFi concept and are willing to support the project's long-term development
- Operational Recommendations:
- Consider accumulating positions during market corrections to establish a cost-effective entry point
- Monitor the project's ecosystem development and user adoption metrics for fundamental analysis
- Store FITFI tokens in secure wallets such as Gate Web3 Wallet for long-term storage
(II) Active Trading Strategy
- Technical Analysis Tools:
- Volume Analysis: Monitor 24-hour trading volume (currently at $108,358) to identify potential breakout or breakdown signals
- Support and Resistance Levels: Track the 24-hour high ($0.000761) and low ($0.0006858) as short-term reference points
- Swing Trading Considerations:
- Pay attention to the token's volatility, noting the 40.2% increase over 30 days suggests potential trading opportunities
- Set appropriate stop-loss levels given the token's historical volatility range
FITFI Risk Management Framework
(I) Asset Allocation Principles
- Conservative Investors: 1-2% of crypto portfolio allocation
- Aggressive Investors: 3-5% of crypto portfolio allocation
- Professional Investors: Up to 10% with active risk monitoring
(II) Risk Hedging Solutions
- Portfolio Diversification: Spread investments across multiple crypto assets to reduce concentration risk
- Position Sizing: Implement gradual entry strategies rather than deploying full capital at once
(III) Secure Storage Solutions
- Hot Wallet Recommendation: Gate Web3 Wallet for active trading and quick access
- Cold Storage Solution: Consider hardware wallet solutions for long-term holdings exceeding trading needs
- Security Precautions: Enable two-factor authentication, verify contract addresses (0x714f020C54cc9D104B6F4f6998C63ce2a31D1888 on Avalanche C-Chain), and never share private keys
V. FITFI Potential Risks and Challenges
FITFI Market Risks
- High Volatility: The token has demonstrated significant price fluctuations, with a 75.06% decline over the past year, indicating substantial market risk
- Limited Trading Volume: With 24-hour trading volume of approximately $108,000 and market capitalization of $3.29 million, liquidity constraints may impact order execution
- Market Cap Ranking: Currently ranked at #1773, suggesting limited mainstream market recognition and potential delisting risks on smaller exchanges
FITFI Regulatory Risks
- FitFi Sector Scrutiny: Move-to-earn and similar incentive models may face regulatory examination regarding their operational structure
- Token Classification: Governance tokens like FITFI may be subject to evolving securities regulations in various jurisdictions
- Cross-border Operations: Geographic location-based features may trigger compliance requirements in different regions
FITFI Technical Risks
- Smart Contract Vulnerabilities: As with any blockchain project, potential bugs or exploits in smart contracts could affect token security
- NFT Integration Complexity: The project's reliance on NFT and geolocation technology introduces additional technical dependencies
- Ecosystem Dependency: FITFI's value proposition relies heavily on the continued development and adoption of the Step App ecosystem
VI. Conclusion and Action Recommendations
FITFI Investment Value Assessment
FITFI represents a specialized play in the FitFi sector, combining fitness incentives with blockchain technology. While the project demonstrates innovation through its dual-token model (FITFI for governance, KCAL for in-game utility) and geographic location-based features, investors should note the significant challenges. The token has experienced a 75.06% decline over the past year, operates with relatively low trading volume, and faces competitive pressures in the move-to-earn space. The recent 30-day performance showing a 40.2% increase may indicate renewed interest, but this should be evaluated within the context of overall market conditions and project fundamentals rather than as a standalone indicator.
FITFI Investment Recommendations
✅ Beginners: Approach with extreme caution; allocate only small amounts you can afford to lose completely, and prioritize learning about FitFi mechanics before investing
✅ Experienced Investors: Consider FITFI as a high-risk, speculative position within a diversified portfolio; monitor ecosystem development and user metrics closely
✅ Institutional Investors: Conduct thorough due diligence on the project's technology stack, team, and competitive positioning; assess regulatory implications in target markets
FITFI Trading Participation Methods
- Spot Trading: Purchase FITFI directly on Gate.com and other supporting exchanges for straightforward exposure
- Gradual Accumulation: Implement dollar-cost averaging to mitigate timing risk given the token's volatility profile
- Ecosystem Participation: Engage with the Step App platform to understand the utility value proposition firsthand before making investment decisions
Cryptocurrency investments carry extremely high risks. This article does not constitute investment advice. Investors should make prudent decisions based on their own risk tolerance and are advised to consult professional financial advisors. Never invest more than you can afford to lose.
FAQ
What is the historical price trend of FITFI tokens?
FITFI launched in 2021 with significant volatility. It peaked around 0.002 USD and bottomed near 0.0002 USD. As of January 2026, FITFI trades around 0.001 USD, reflecting moderate market consolidation.
What are the main factors affecting FITFI price?
FITFI price is primarily influenced by market demand, team strength, trading volume, overall crypto market conditions, and ecosystem development. These factors collectively determine its market performance and price movement.
What is the future price prediction trend for FITFI?
FITFI is predicted to trade between $0.0004922 and $0.0013 in 2025, with long-term forecasts suggesting potential growth to $0.0114 by 2030, depending on market conditions and user adoption rates.
What are the advantages of FITFI compared to other fitness tokens?
FITFI offers decentralized governance with fair token distribution across the Step App ecosystem, prioritizing transparency and user participation. It focuses on fitness-to-earn rewards through movement, delivering unique value in the fitness finance sector.
What risks should I note when investing in FITFI tokens?
FITFI investment involves market volatility and price fluctuations. Consider your risk tolerance carefully. Conduct thorough research on project fundamentals, tokenomics, and market conditions before investing.
What is the development roadmap for the FITFI project?
FITFI's roadmap includes launching an in-app dashboard, new monetization tools, and staking rewards. The project incorporates deflationary mechanisms and plans continuous improvements over the coming years to enhance user experience and ecosystem growth.
* The information is not intended to be and does not constitute financial advice or any other recommendation of any sort offered or endorsed by Gate.