This comprehensive analysis explores FORT's price dynamics from 2026 to 2031, offering detailed forecasts and investment strategies for blockchain security infrastructure investors. The article examines FORT's current market position with a circulating supply of 629.29 million tokens and market cap of $12.9 million, tracing its trajectory from a $0.25 launch price to current levels around $0.0205. Combining historical patterns, market supply-demand dynamics, and ecosystem developments, the analysis provides conservative, neutral, and optimistic price forecasts across multiple timeframes. The guide presents tailored investment methodologies including long-term holding and active trading strategies, comprehensive risk management frameworks with appropriate allocation percentages, and detailed security recommendations for asset storage on Gate Web3 Wallet. Additionally, the article addresses regulatory, technical, and liquidity risks while offering practical action recommendations for beginners, experienced inve
Introduction: FORT's Market Position and Investment Value
Forta (FORT), as a decentralized real-time detection network for blockchain security and operational monitoring, has been serving the Web3 ecosystem since its launch in 2022. As of 2026, Forta has established its presence with a market capitalization of approximately $12.9 million and a circulating supply of around 629.29 million tokens, with the price stabilizing at approximately $0.0205. This asset, recognized as a specialized security monitoring solution, is playing an increasingly vital role in protecting DeFi protocols, NFT platforms, governance systems, and cross-chain bridges.
This article will comprehensively analyze FORT's price trajectory from 2026 to 2031, combining historical patterns, market supply and demand dynamics, ecosystem development, and macroeconomic factors to provide investors with professional price forecasts and practical investment strategies.
I. FORT Price History Review and Market Status
FORT Historical Price Evolution Trajectory
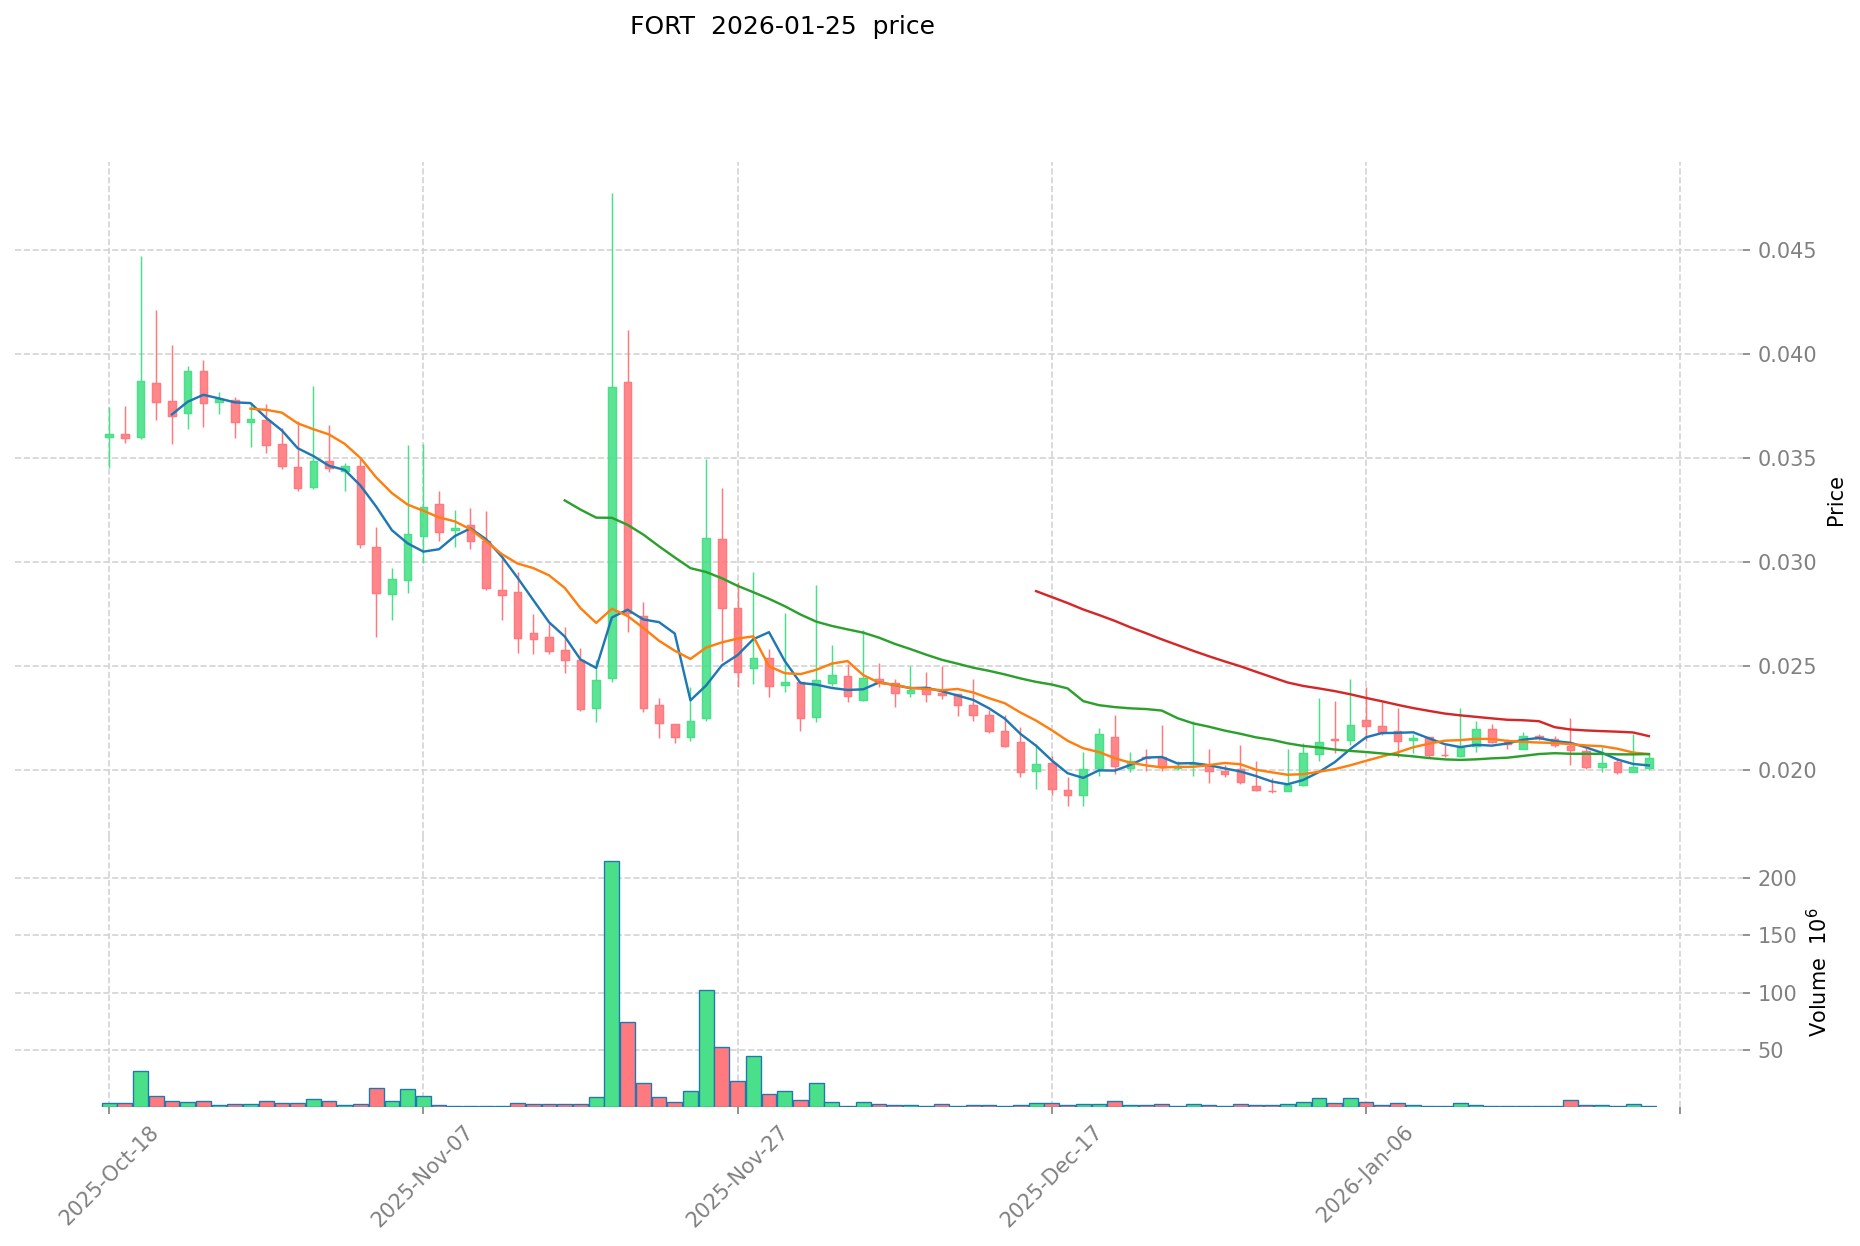
- 2022: FORT launched on Gate.com on June 15, 2022, with an initial offering price of $0.25. The token reached its all-time high of $0.964645 on June 16, 2022, just one day after launch, representing a significant surge from its listing price.
- 2023-2024: Following the initial peak, FORT experienced a prolonged downward trend aligned with broader market conditions, gradually declining from its historical high.
- 2025: The token continued its bearish trajectory, reaching its all-time low of $0.01832485 on December 19, 2025, marking a decline of approximately 98% from its peak value.
FORT Current Market Status
As of January 25, 2026, FORT is trading at $0.0205, showing a modest recovery of approximately 11.9% from its historical low recorded in December 2025. The token has demonstrated mixed short-term performance, with a 1.68% increase over the past 24 hours, though it has declined 4.34% over the past week.
The token's circulating supply stands at 629.29 million FORT tokens, representing 62.93% of the maximum supply of 1 billion tokens. The current market capitalization is approximately $12.90 million, with a fully diluted valuation of $20.50 million. FORT maintains a market dominance of 0.00064% within the broader cryptocurrency ecosystem.
The 24-hour trading volume for FORT is $23,355.14, indicating relatively modest trading activity. The token is currently available on 11 cryptocurrency exchanges, with Gate.com serving as one of the primary trading platforms. The token holder count stands at 5,289 addresses.
Looking at broader timeframes, FORT has shown a 3.59% gain over the past 30 days, suggesting some stabilization after reaching its all-time low. However, the one-year performance reflects a significant decline of 79.84%, indicating substantial bearish pressure throughout 2025.
FORT operates as an ERC-20 token on the Ethereum mainnet, with contract address 0x41545f8b9472D758bB669ed8EaEEEcD7a9C4Ec29, and also maintains presence on the Polygon network at contract address 0x9ff62d1FC52A907B6DCbA8077c2DDCA6E6a9d3e1.
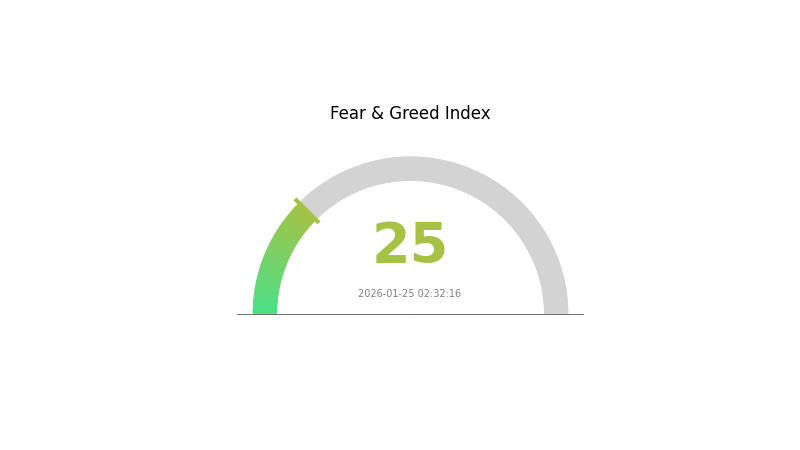
The current market sentiment index stands at 25, indicating "Extreme Fear" conditions in the broader cryptocurrency market, which may be influencing FORT's price action and trading dynamics.
Click to view the current FORT market price
FORT Market Sentiment Indicator
2026-01-25 Fear & Greed Index: 25 (Extreme Fear)
Click to view current Fear & Greed Index
The crypto market is experiencing extreme fear, with the Fear & Greed Index at 25. This level indicates significant market pessimism and heightened risk aversion among investors. During such periods, asset prices typically experience downward pressure as selling pressure outweighs buying interest. Market participants should exercise caution and avoid impulsive trading decisions. This extreme fear sentiment often presents contrarian opportunities for experienced investors, though patience and careful risk management remain essential. Monitor market developments closely before making investment decisions.
FORT Token Holdings Distribution
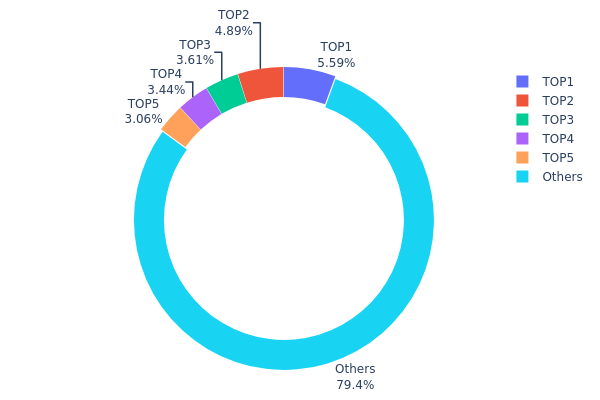
The holdings distribution chart illustrates the concentration of FORT tokens across different wallet addresses, providing insights into the decentralization level and potential market dynamics. This metric is crucial for assessing the risk of price manipulation and understanding the overall health of token distribution within the ecosystem.
Based on the current data, FORT exhibits a relatively moderate concentration pattern. The top 5 addresses collectively hold approximately 20.56% of the total supply, with the largest holder controlling 5.58% (55,869.62K FORT). The second and third positions hold 4.88% and 3.61% respectively, while the remaining addresses in the top 5 each control between 3% to 3.5%. Notably, the vast majority—79.44%—of tokens are distributed among other addresses, suggesting a reasonably broad holder base.
This distribution structure indicates a balanced tokenomics model that mitigates extreme centralization risks. While the top addresses maintain significant positions, no single entity dominates the supply with an overwhelming majority. The relatively even distribution among the top 5 holders, combined with the substantial portion held by other addresses, creates a market structure that is less susceptible to single-entity manipulation. However, the collective influence of these major holders remains considerable, and coordinated actions could still impact price movements. From a market stability perspective, this distribution pattern suggests moderate resilience against sudden supply shocks, though monitoring changes in these top addresses remains essential for understanding potential shifts in market dynamics and investor sentiment.
Click to view current FORT Holdings Distribution
| Top |
Address |
Holding Qty |
Holding (%) |
| 1 |
0xd31e...b8c87e |
55869.62K |
5.58% |
| 2 |
0xc2c8...359564 |
48874.73K |
4.88% |
| 3 |
0x61d0...192762 |
36146.35K |
3.61% |
| 4 |
0x26e1...63e2a9 |
34355.59K |
3.43% |
| 5 |
0x5e1d...86485f |
30632.17K |
3.06% |
| - |
Others |
794121.54K |
79.44% |
II. Core Factors Influencing FORT's Future Price
Based on the available materials, there is insufficient specific information regarding FORT's supply mechanisms, institutional dynamics, macroeconomic positioning, or technical developments to provide a comprehensive analysis at this time. As market conditions evolve and more data becomes available, these factors may become clearer for evaluation.
III. 2026-2031 FORT Price Prediction
2026 Outlook
- Conservative forecast: $0.0172 - $0.02048
- Neutral forecast: $0.02048
- Optimistic forecast: $0.02191 (requires favorable market conditions)
2027-2029 Mid-term Outlook
- Market stage expectation: The token is anticipated to enter a gradual growth phase, with price volatility potentially increasing as adoption expands and market dynamics evolve.
- Price range forecast:
- 2027: $0.01632 - $0.02904
- 2028: $0.01507 - $0.03743
- 2029: $0.02189 - $0.03753
- Key catalysts: Market adoption trends, broader cryptocurrency market sentiment, and potential ecosystem developments may serve as primary drivers for price movement during this period.
2030-2031 Long-term Outlook
- Baseline scenario: $0.02098 - $0.0344 (assuming steady market conditions and moderate adoption growth)
- Optimistic scenario: $0.04094 - $0.04789 (contingent on accelerated ecosystem expansion and favorable regulatory environment)
- Transformational scenario: Above $0.04789 (requires exceptional market conditions, widespread adoption, and significant technological breakthroughs)
- 2026-01-25: FORT exhibits a relatively stable baseline with projected average price around $0.02048, marking the initial phase of its long-term price trajectory.
| Year |
Predicted High Price |
Predicted Average Price |
Predicted Low Price |
Price Change |
| 2026 |
0.02191 |
0.02048 |
0.0172 |
0 |
| 2027 |
0.02904 |
0.0212 |
0.01632 |
3 |
| 2028 |
0.03743 |
0.02512 |
0.01507 |
22 |
| 2029 |
0.03753 |
0.03127 |
0.02189 |
52 |
| 2030 |
0.04747 |
0.0344 |
0.02098 |
67 |
| 2031 |
0.04789 |
0.04094 |
0.02456 |
99 |
IV. FORT Professional Investment Strategies and Risk Management
FORT Investment Methodology
(1) Long-term Holding Strategy
- Suitable for: Investors seeking exposure to blockchain security infrastructure with a 1-3 year investment horizon
- Operational Recommendations:
- Consider accumulating positions during market corrections when FORT trades near support levels
- Monitor network adoption metrics and the expansion of Forta's detection capabilities across different blockchain ecosystems
- Storage Solution: Utilize Gate Web3 Wallet for secure storage of FORT tokens, which supports ERC-20 tokens on Ethereum mainnet
(2) Active Trading Strategy
- Technical Analysis Tools:
- Moving Averages: Track 50-day and 200-day moving averages to identify potential trend reversals and momentum shifts
- Volume Analysis: Monitor 24-hour trading volume patterns to gauge market interest and liquidity conditions
- Swing Trading Key Points:
- Pay attention to FORT's price volatility, particularly during periods of heightened security concerns in the Web3 space
- Set predetermined profit-taking levels and stop-loss orders to manage position risk effectively
FORT Risk Management Framework
(1) Asset Allocation Principles
- Conservative Investors: 1-2% of crypto portfolio allocation
- Aggressive Investors: 3-5% of crypto portfolio allocation
- Professional Investors: 5-8% of crypto portfolio allocation with active monitoring
(2) Risk Hedging Solutions
- Portfolio Diversification: Balance FORT holdings with established cryptocurrencies and other infrastructure tokens to reduce concentration risk
- Position Sizing: Implement gradual accumulation strategies rather than single large purchases to average entry costs
(3) Secure Storage Solutions
- Hot Wallet Recommendation: Gate Web3 Wallet for convenient trading and staking access with built-in security features
- Cold Storage Solution: Consider hardware wallet solutions for long-term holdings exceeding personal risk thresholds
- Security Precautions: Never share private keys or seed phrases; enable two-factor authentication on all exchange accounts; verify contract addresses before transactions
V. FORT Potential Risks and Challenges
FORT Market Risks
- Liquidity Concerns: With a 24-hour trading volume of approximately $23,355 and listing on 11 exchanges, FORT may experience limited liquidity during volatile market conditions
- Price Volatility: FORT has experienced significant price fluctuations, with a 1-year decline of 79.84%, reflecting the inherent volatility in security-focused blockchain projects
- Market Capitalization Position: Ranked at #1087 with a market dominance of 0.00064%, FORT faces challenges in gaining widespread market recognition
FORT Regulatory Risks
- Evolving Compliance Landscape: Blockchain security monitoring services may face increased regulatory scrutiny as governments develop frameworks for Web3 infrastructure
- Cross-border Operations: Forta's decentralized monitoring network operates across multiple jurisdictions, potentially exposing it to varying regulatory requirements
- Token Classification Uncertainty: Changes in how utility tokens are classified by regulatory bodies could impact FORT's market accessibility
FORT Technical Risks
- Smart Contract Vulnerabilities: As an ERC-20 token deployed on Ethereum mainnet and Polygon, FORT is subject to potential smart contract exploits or bugs
- Network Dependency: Forta's effectiveness relies on the continuous operation and security of underlying blockchain networks it monitors
- Competition: The blockchain security monitoring space faces increasing competition from both centralized and decentralized solutions
VI. Conclusion and Action Recommendations
FORT Investment Value Assessment
FORT represents an investment in blockchain security infrastructure, addressing the critical need for real-time threat detection across DeFi, NFT, and Web3 systems. The token's long-term value proposition is tied to the growth and maturation of the Web3 ecosystem, where security monitoring becomes increasingly essential. However, short-term risks include significant price volatility, limited market capitalization, and ongoing market uncertainty. The circulating supply of 629.29 million tokens represents 62.93% of the total supply, with a current market cap of approximately $12.9 million.
FORT Investment Recommendations
✅ Beginners: Start with minimal position sizes (0.5-1% of crypto portfolio) and focus on understanding Forta's role in blockchain security before increasing exposure
✅ Experienced Investors: Consider FORT as a strategic allocation within a diversified Web3 infrastructure portfolio, with position sizes of 2-4% and active monitoring of network adoption metrics
✅ Institutional Investors: Evaluate FORT within the context of broader blockchain security themes, conducting thorough due diligence on network growth, partnership developments, and competitive positioning
FORT Trading Participation Methods
- Spot Trading: Purchase FORT directly on Gate.com and other supported exchanges for immediate ownership and potential staking opportunities
- Dollar-Cost Averaging: Implement systematic purchasing strategies to reduce timing risk and smooth out entry price volatility
- Portfolio Rebalancing: Periodically adjust FORT holdings based on predetermined allocation targets and market performance
Cryptocurrency investment carries extremely high risks, and this article does not constitute investment advice. Investors should make prudent decisions based on their own risk tolerance and are advised to consult professional financial advisors. Never invest more than you can afford to lose.
FAQ
What is FORT token? What are its uses and value?
FORT token is a cryptocurrency asset designed for decentralized finance applications. It provides utility in governance, staking rewards, and ecosystem participation. The token gains value through increased adoption, network utility, and scarcity mechanisms within its protocol ecosystem.
How to predict FORT price? What are the analysis methods?
Analyze FORT price through technical analysis(K-line patterns,moving averages),fundamental analysis(project developments,team),on-chain metrics(transaction volume,holder distribution),and market sentiment. Combine multiple methods for comprehensive predictions.
What are the risks of investing in FORT tokens and what should I pay attention to?
FORT token investment involves market volatility risk, liquidity risk, and regulatory uncertainty. Monitor price fluctuations, diversify your portfolio, and only invest capital you can afford to lose. Stay updated on project developments and market conditions.
What is FORT's position in the cryptocurrency market? What are its future prospects?
FORT holds a strong position in the crypto market with growing transaction volume and community adoption. Its innovative blockchain technology and expanding ecosystem position it for significant growth. Market analysts project robust future prospects as institutional interest increases and real-world applications expand across DeFi and Web3 sectors.
What is FORT's historical price trend? What are the main factors affecting its price fluctuations?
FORT has experienced volatility typical of emerging crypto assets. Key price drivers include market sentiment, trading volume, project developments, Bitcoin market correlation, and broader crypto market cycles. Long-term growth potential depends on protocol adoption and ecosystem expansion.
* The information is not intended to be and does not constitute financial advice or any other recommendation of any sort offered or endorsed by Gate.