This comprehensive analysis examines Fragmetric (FRAG), Solana's innovative liquid restaking and asset management protocol, providing expert price forecasts and investment guidance for 2026-2031. Currently trading at $0.001644 with a market cap of $332,088, FRAG faces challenges from extreme market volatility and concentrated token distribution, yet offers potential upside through ecosystem growth and FRAG-22 standard adoption. The article delivers detailed price predictions ranging from $0.00158 to $0.004 by 2031, professional investment strategies including dollar-cost averaging and active trading approaches, and critical risk management frameworks for different investor profiles. Essential for traders and investors seeking actionable insights on FRAG's market positioning on Gate and strategic allocation recommendations in the DeFi sector.
Introduction: FRAG Market Position and Investment Value
Fragmetric (FRAG), positioned as Solana's pioneering liquid (re)staking protocol that evolved into the advanced FRAG-22 asset management standard, has established itself in the DeFi ecosystem since its launch in 2025. As of 2026, FRAG maintains a market capitalization of approximately $332,088, with a circulating supply of around 202 million tokens, and the price stabilizes at approximately $0.001644. This asset, known as an innovative infrastructure component for sophisticated DeFi strategies, is playing an increasingly important role in multi-asset deposit management, reward distribution mechanisms, and modular yield sourcing.
This article will comprehensively analyze FRAG's price trajectory from 2026 to 2031, combining historical patterns, market supply-demand dynamics, ecosystem developments, and macroeconomic conditions to provide investors with professional price forecasts and practical investment strategies.
I. FRAG Price History Review and Market Status
FRAG Historical Price Evolution Trajectory
- July 2025: FRAG reached a notable price level of $0.189 during its early trading phase, reflecting initial market interest following its launch on Gate.com
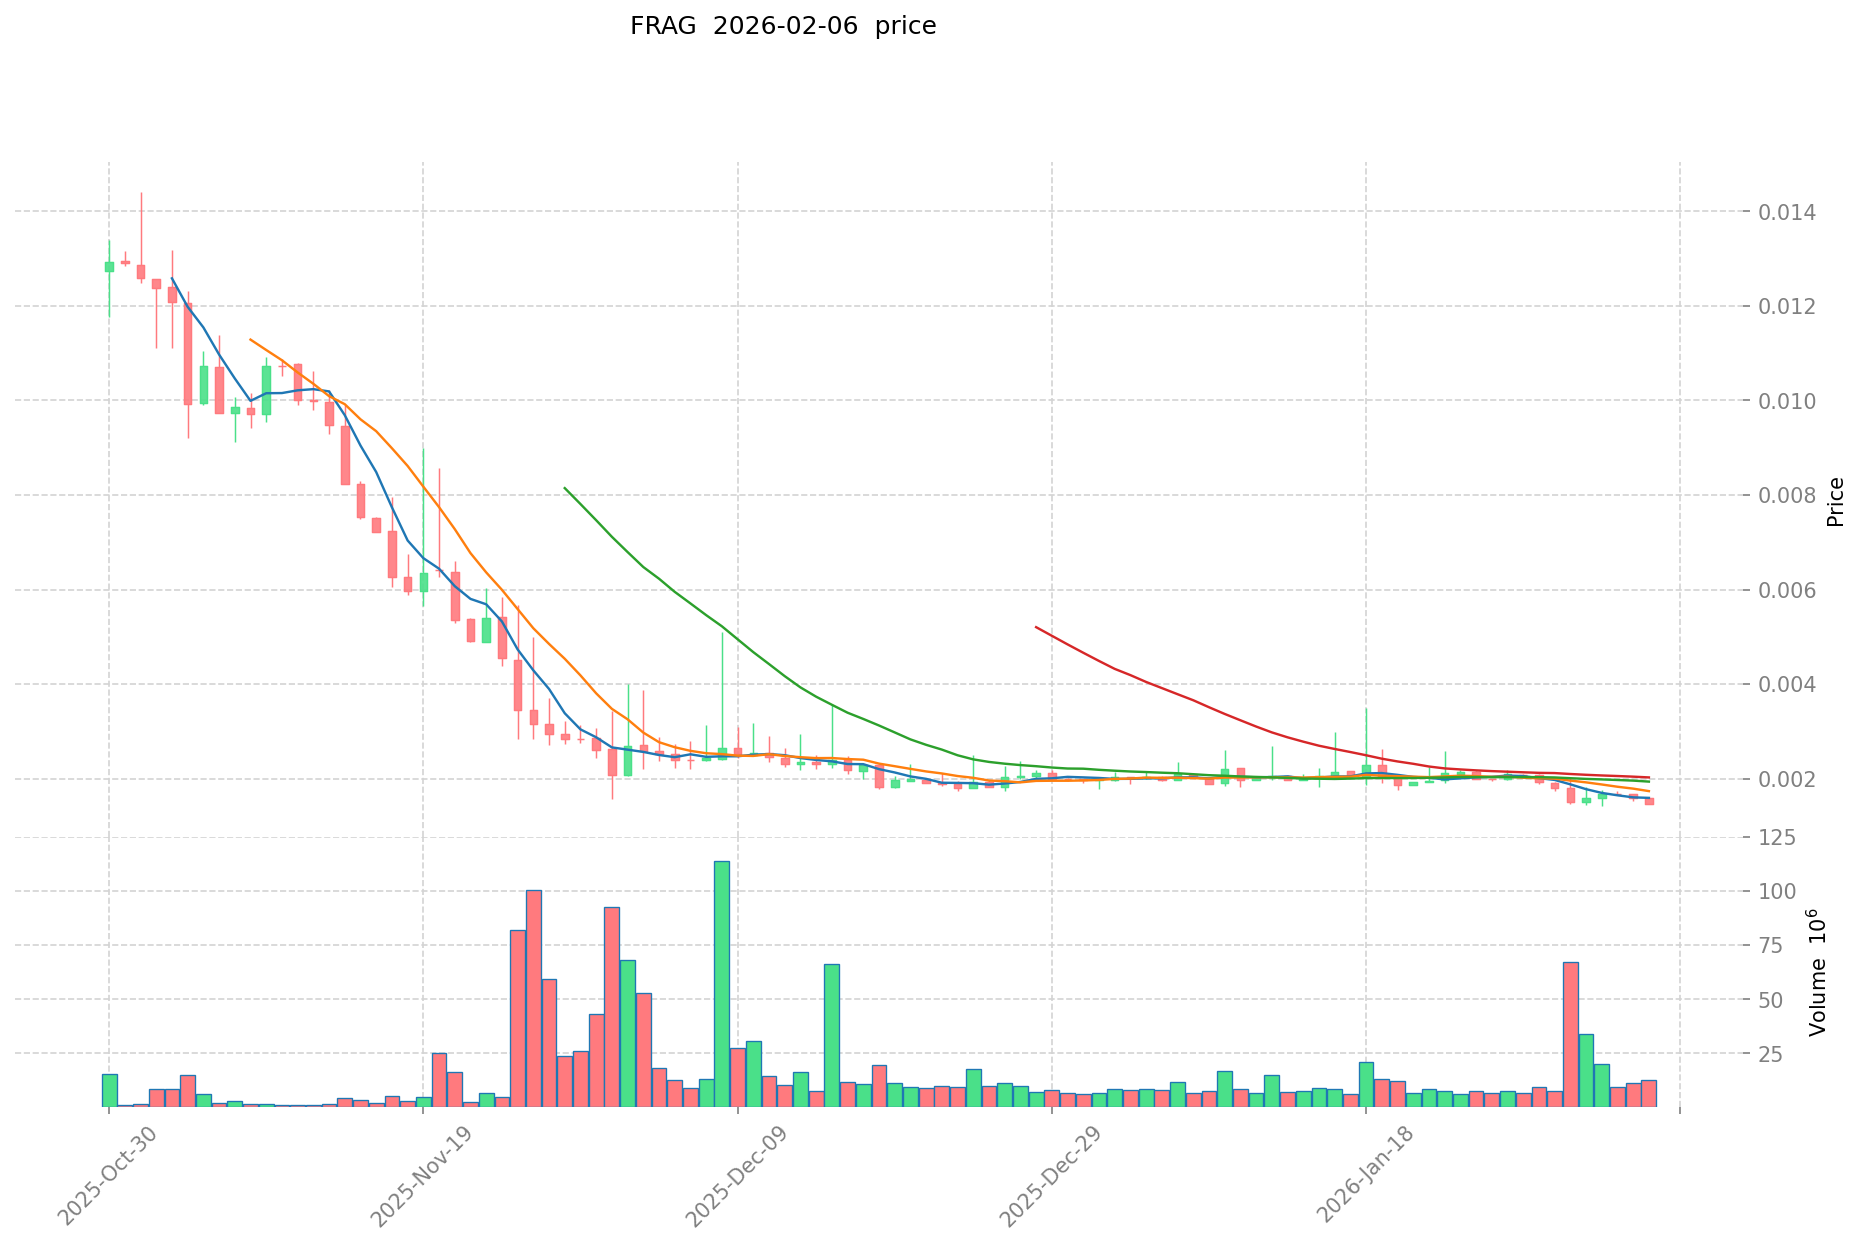
- February 2026: The token experienced significant price compression, with the price declining to $0.001419, representing a substantial adjustment from previous levels
FRAG Current Market Situation
As of February 7, 2026, FRAG is trading at $0.001644, showing a 24-hour increase of 12.06%. The token's 24-hour trading range spans from $0.001439 to $0.001652, with total trading volume reaching $19,965.45.
The current circulating supply stands at 202,000,000 FRAG tokens, representing 20.2% of the maximum supply of 1,000,000,000 tokens. The market capitalization is recorded at $332,088, while the fully diluted market cap is calculated at $1,644,000. The token holds a market dominance of 0.000065%.
Recent price performance shows mixed trends across different timeframes: a 1-hour decline of 0.36%, a 7-day decrease of 9.49%, and a 30-day drop of 18.64%. The token is currently trading approximately 99.13% below its previous peak price level.
Fragmetric operates on the Solana blockchain and has attracted a holder base of 15,276 addresses. The project has evolved from its original focus as a liquid staking protocol into the FRAG-22 asset management standard, which integrates multi-asset deposits, reward distribution mechanisms, and modular yield optimization strategies.
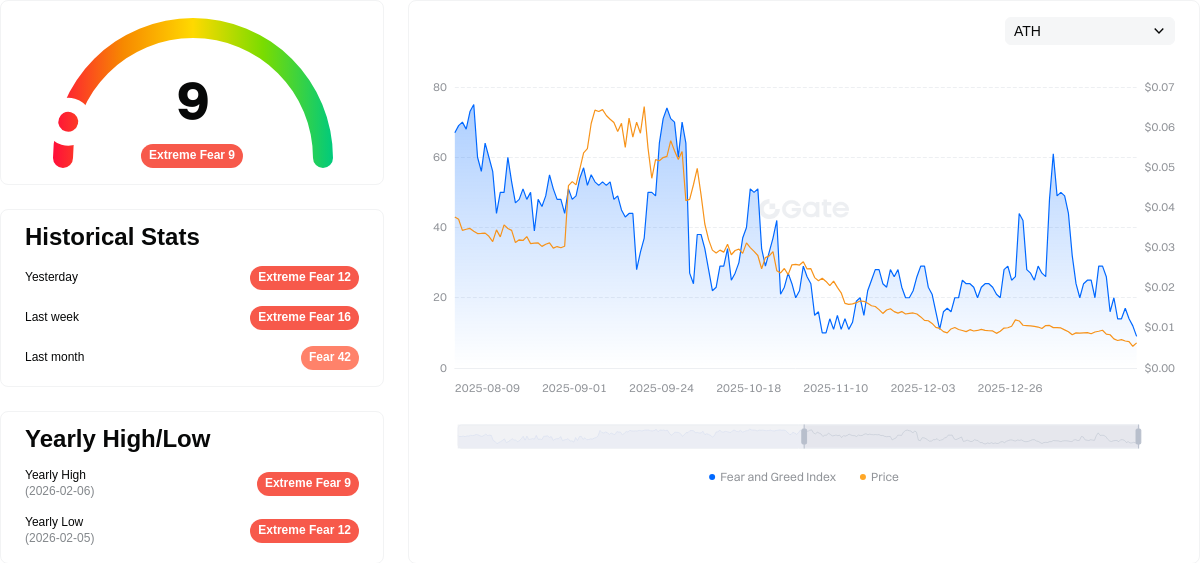
The Fear & Greed Index for the broader crypto market currently registers at 9, indicating an extreme fear sentiment among market participants.
Click to view the current FRAG market price
FRAG Market Sentiment Index
2026-02-06 Fear and Greed Index: 9 (Extreme Fear)
Click to view the current Fear & Greed Index
The crypto market is currently experiencing extreme fear with an index reading of 9. This exceptionally low sentiment level indicates heightened market anxiety and pessimism among investors. When fear reaches such extreme levels, it often signals potential bottoming patterns, as panic selling may have exhausted sellers. Experienced traders sometimes view such periods as contrarian opportunities, though caution remains warranted. Monitor market developments closely on Gate.com for real-time data and trading insights during this volatile period.
FRAG Holdings Distribution
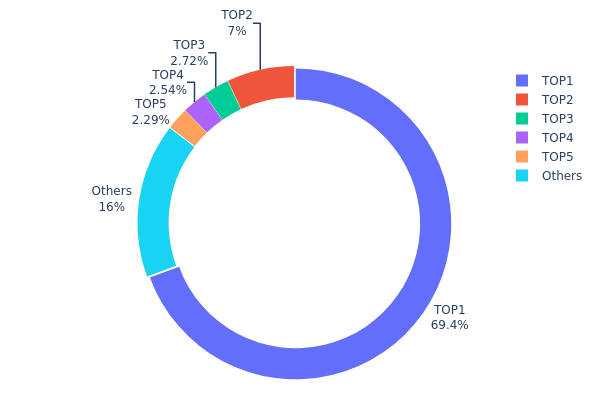
The holdings distribution chart illustrates how FRAG tokens are allocated across different wallet addresses, revealing the degree of concentration or decentralization within the token's ecosystem. This metric serves as a critical indicator of market structure, as it directly influences liquidity patterns, price volatility, and the potential for coordinated market activities.
According to the current data, FRAG exhibits an extremely concentrated holdings structure. The top address alone controls 693,951.21K tokens, representing 69.39% of the total supply—a dominance level that significantly exceeds healthy decentralization thresholds. The second-largest holder accounts for 7.00% with 70,000.00K tokens, while addresses ranked third through fifth collectively hold approximately 7.55% of the supply. The remaining 16.06% is distributed among other addresses, indicating a heavily centralized ownership model.
This concentration profile presents substantial structural risks to the FRAG market. The dominant position held by the top address creates an asymmetric power dynamic, where a single entity possesses sufficient supply to materially impact market pricing through large-scale transactions or strategic withholding. Such centralization typically correlates with elevated volatility, as the market remains vulnerable to the trading decisions of major holders. Additionally, the limited distribution among secondary holders suggests constrained organic market depth, which may impede price discovery mechanisms and reduce resilience against coordinated selling pressure. From an on-chain structural perspective, this distribution pattern reflects a nascent stage of token circulation where true decentralization has yet to materialize, potentially affecting long-term ecosystem sustainability and investor confidence.
Click to view current FRAG Holdings Distribution
| Top |
Address |
Holding Qty |
Holding (%) |
| 1 |
F8ngMX...CXAse4 |
693951.21K |
69.39% |
| 2 |
BTj8Pn...JZbzRu |
70000.00K |
7.00% |
| 3 |
5MQGiz...3Vm7iC |
27207.49K |
2.72% |
| 4 |
7ifeXL...GXSmyX |
25445.23K |
2.54% |
| 5 |
u6PJ8D...ynXq2w |
22908.32K |
2.29% |
| - |
Others |
160482.96K |
16.06% |
II. Core Factors Influencing FRAG's Future Price
Market Demand and Adoption Trends
- Web3 Gaming Ecosystem Positioning: FRAG has consolidated its position within the Web3 gaming ecosystem, with market demand serving as a primary driver of price movements.
- Historical Growth Pattern: As of July 2025, FRAG's price demonstrated significant growth, reaching $0.063 per token, reflecting strong adoption momentum in the gaming sector.
- Current Impact: The token's integration into modular asset management and restaking infrastructure on Solana continues to attract users and developers, supporting sustained demand.
Technical Development and Ecosystem Building
- Modular Asset Management Infrastructure: FRAG operates as part of a modular asset management framework on Solana, enabling flexible and efficient asset handling for users.
- Restaking Infrastructure: The restaking capabilities built into the FRAG ecosystem provide additional utility and value capture mechanisms for token holders.
- Ecosystem Applications: FRAG's presence in the Web3 gaming space positions it to benefit from the growth of decentralized gaming applications and related DApp development.
Macroeconomic Environment
- Broader Economic Factors: FRAG's price outlook is influenced by wider economic conditions, including institutional participation and market sentiment toward digital assets.
- Growth Projections: With an anticipated annual growth rate of approximately 5%, FRAG's price trajectory for 2027 shows significant upward potential based on current market analysis.
- Market Trends: The overall cryptocurrency market environment, including investor appetite for gaming and DeFi tokens, plays a role in shaping FRAG's price movements.
III. 2026-2031 FRAG Price Prediction
2026 Outlook
- Conservative forecast: $0.00158
- Neutral forecast: $0.00165
- Optimistic forecast: $0.00233 (requires favorable market conditions)
2027-2029 Outlook
- Market stage expectation: FRAG is anticipated to enter a gradual growth phase, with price volatility reflecting evolving market sentiment and project developments
- Price range forecast:
- 2027: $0.00125 - $0.00268 (approximately 20% change from 2026)
- 2028: $0.0022 - $0.00245 (approximately 42% change from 2026)
- 2029: $0.00218 - $0.00285 (approximately 45% change from 2026)
- Key catalysts: Market adoption trends, ecosystem expansion, and broader crypto market performance could serve as primary drivers for price movement
2030-2031 Long-term Outlook
- Baseline scenario: $0.00173 - $0.00262 (assuming steady market conditions and moderate adoption)
- Optimistic scenario: $0.00305 - $0.00349 (assuming strong ecosystem growth and favorable market environment)
- Transformative scenario: $0.004 (under exceptionally favorable conditions including widespread adoption and significant technological breakthroughs)
- 2026-02-07: FRAG shows potential for gradual appreciation over the five-year forecast period, with projected increases ranging from 20% to 85% depending on market conditions
| Year |
Predicted High Price |
Predicted Average Price |
Predicted Low Price |
Price Change |
| 2026 |
0.00233 |
0.00165 |
0.00158 |
0 |
| 2027 |
0.00268 |
0.00199 |
0.00125 |
20 |
| 2028 |
0.00245 |
0.00234 |
0.0022 |
42 |
| 2029 |
0.00285 |
0.00239 |
0.00218 |
45 |
| 2030 |
0.00349 |
0.00262 |
0.00173 |
59 |
| 2031 |
0.004 |
0.00305 |
0.00183 |
85 |
IV. FRAG Professional Investment Strategies and Risk Management
FRAG Investment Methodology
(I) Long-term Holding Strategy
- Target Investors: Investors with high risk tolerance seeking exposure to DeFi innovation and asset management protocols on Solana
- Operational Recommendations:
- Consider dollar-cost averaging (DCA) to mitigate entry timing risk, given FRAG's current price volatility
- Monitor protocol development milestones and FRAG-22 standard adoption metrics
- Storage Solution: Utilize Gate Web3 Wallet for secure self-custody with multi-chain support, or hardware wallet solutions for larger holdings
(II) Active Trading Strategy
- Technical Analysis Tools:
- Moving Averages: Monitor 7-day and 30-day moving averages to identify potential trend reversals, particularly relevant given recent price decline
- Volume Analysis: Track 24-hour trading volume ($19,965) relative to historical patterns to gauge market interest
- Swing Trading Considerations:
- Set stop-loss orders to manage downside risk in this high-volatility asset
- Consider taking partial profits during short-term rallies, as evidenced by recent 12.06% 24-hour gain
FRAG Risk Management Framework
(I) Asset Allocation Principles
- Conservative Investors: 1-3% of crypto portfolio allocation
- Aggressive Investors: 5-10% of crypto portfolio allocation
- Professional Investors: Up to 15% with active monitoring and hedging strategies
(II) Risk Hedging Solutions
- Portfolio Diversification: Balance FRAG exposure with established cryptocurrencies and stablecoins
- Position Sizing: Limit individual position size based on personal risk tolerance and market capitalization considerations
(III) Secure Storage Solutions
- Hot Wallet Recommendation: Gate Web3 Wallet for active trading and easy access to DeFi functionalities
- Cold Storage Solution: Hardware wallet storage for long-term holdings to minimize security risks
- Security Precautions: Never share private keys, enable two-factor authentication, and regularly verify wallet addresses before transactions
V. FRAG Potential Risks and Challenges
FRAG Market Risks
- High Volatility: FRAG has experienced a 97.35% decline over one year, indicating substantial price volatility and market uncertainty
- Liquidity Concerns: With a 24-hour trading volume of approximately $19,965 and market capitalization of $332,088, liquidity may be limited during periods of market stress
- Low Market Capitalization: Ranking at #3,423 with minimal market dominance (0.000065%), making FRAG susceptible to significant price swings
FRAG Regulatory Risks
- DeFi Protocol Oversight: Evolving regulatory frameworks for liquid staking and asset management protocols may impact FRAG's operational model
- Jurisdictional Uncertainty: Potential regulatory scrutiny across different jurisdictions could affect protocol adoption and token utility
- Compliance Requirements: Future regulatory requirements for DeFi protocols may necessitate operational adjustments
FRAG Technical Risks
- Smart Contract Vulnerabilities: As with all DeFi protocols, potential smart contract bugs or exploits could impact protocol security and token value
- Protocol Development Risk: The evolution from liquid staking to FRAG-22 standard requires ongoing technical development and successful implementation
- Solana Network Dependencies: FRAG's performance is tied to Solana network stability, scalability, and overall ecosystem health
VI. Conclusion and Action Recommendations
FRAG Investment Value Assessment
Fragmetric represents an innovative approach to asset management within the Solana ecosystem through its FRAG-22 standard. The protocol's evolution from liquid staking to comprehensive asset management demonstrates technical ambition. However, the token faces substantial headwinds, including a 97.35% year-over-year price decline, limited market capitalization ($332,088), and minimal trading volume. While the protocol's technical innovation may offer long-term potential for early adopters, current market metrics suggest heightened risk. The circulating supply of 202 million tokens represents only 20.2% of total supply, which may create future dilution concerns.
FRAG Investment Recommendations
✅ Beginners: Approach with extreme caution; prioritize education about DeFi protocols and asset management standards before considering exposure. If interested, limit allocation to less than 1% of crypto portfolio.
✅ Experienced Investors: Consider small exploratory positions (2-5% of crypto portfolio) while closely monitoring protocol development, adoption metrics, and market liquidity. Implement strict stop-loss levels.
✅ Institutional Investors: Conduct thorough due diligence on FRAG-22 standard adoption, protocol security audits, and competitive positioning within Solana's DeFi ecosystem before allocation.
FRAG Trading Participation Methods
- Spot Trading: Purchase FRAG through supported exchanges with appropriate risk management measures
- DeFi Interaction: Engage directly with Fragmetric protocol to understand utility and functionality
- Gradual Accumulation: Consider phased entry strategies to average cost across different market conditions
Cryptocurrency investment carries extremely high risk. This article does not constitute investment advice. Investors should make prudent decisions based on their own risk tolerance and are advised to consult professional financial advisors. Never invest more than you can afford to lose.
FAQ
What is FRAG token and what is its current use case?
FRAG token is a governance token enabling holders to stake for voting power, earn incentives, and participate in key decisions within the Fragmetric platform ecosystem.
What factors influence FRAG price movements and market trends?
FRAG price movements are driven by trading volume, market sentiment, technological developments, macroeconomic conditions, and industry adoption trends. Investor psychology and global economic events significantly impact price volatility and market direction.
What is the price prediction for FRAG in the next 6-12 months?
Based on market analysis, FRAG is projected to reach approximately $0.002966 in February 2026, $0.002978 in March 2026, and $0.003029 by July 2026. Long-term growth potential depends on market adoption and development progress.
How does FRAG compare to other similar tokens in the market?
FRAG distinguishes itself through multi-reward staking on Solana, offering diverse earning opportunities compared to competitors. As an innovative newer protocol, FRAG provides enhanced yield mechanisms and flexibility, positioning it competitively within the staking token ecosystem.
What are the risks and potential returns of investing in FRAG?
FRAG offers high potential returns through price appreciation and trading volume growth. However, market volatility and cryptocurrency adoption risks exist. Returns depend on market conditions and timing of entry and exit points.
FRAG has demonstrated significant volatility in its price history. Key support levels are identified around $50, while resistance levels stand near $75 as of February 2026. These technical levels are essential for traders analyzing FRAG's market movements and potential price directions.
What is the total supply and tokenomics of FRAG?
FRAG has a total supply of 792,000,000 tokens with a maximum cap of 792,000,000. Circulating supply is currently 0. The tokenomics design ensures controlled distribution and long-term sustainability for the ecosystem.
Where can I buy and trade FRAG safely?
Buy and trade FRAG on major cryptocurrency exchanges offering spot trading with strong security measures, low fees, and deep liquidity. Choose platforms with robust verification systems and insurance coverage to ensure safe transactions.
* The information is not intended to be and does not constitute financial advice or any other recommendation of any sort offered or endorsed by Gate.