This comprehensive FTRB price prediction guide analyzes Faith Tribe's market position and investment opportunities through 2031. The article examines FTRB's current trading dynamics at $0.007868, historical price evolution, and token distribution patterns, identifying both growth catalysts and concentration risks. Expert forecasts project multi-year price ranges from $0.00456 to $0.02349 by 2031, with detailed breakdowns for each year. The guide provides actionable investment strategies for beginners to institutional investors, including dollar-cost averaging, technical analysis approaches, and portfolio allocation frameworks. Critical risk assessments address liquidity constraints, regulatory uncertainties, and market volatility, while offering secure custody solutions through Gate Web3 Wallet. Whether you're exploring Web3 fashion innovation or seeking diversified crypto exposure, this resource delivers professional market analysis and practical risk management tools for informed FTRB investment decisions.
Introduction: FTRB's Market Position and Investment Value
Faith Tribe (FTRB), as an open-source collaborative fashion design platform in the Web3 economy, has been empowering independent designers through reward mechanisms since its launch in 2022. As of 2026, FTRB has achieved a market capitalization of approximately $25.25 million, with a circulating supply of around 3.21 billion tokens, and the price is maintained at approximately $0.007868. This asset, recognized as a "Web3 fashion innovation enabler," is playing an increasingly critical role in decentralized creative economy and fashion industry transformation.
This article will comprehensively analyze FTRB's price trends from 2026 to 2031, combining historical patterns, market supply and demand dynamics, ecosystem development, and macroeconomic environment factors to provide investors with professional price forecasts and practical investment strategies.
I. FTRB Price History Review and Current Market Status
FTRB Historical Price Evolution Trajectory
- 2022: FTRB reached a notable price point of $0.07116 on March 1st, following its initial launch at $0.01 in February 2022, representing significant early trading activity.
- 2024: The token experienced substantial price compression, recording its lowest level at $0.00173617 on June 23rd, reflecting broader market challenges during this period.
- 2025-2026: FTRB demonstrated recovery momentum, with the 30-day period showing considerable upward movement, transitioning from lower price ranges toward the current level of $0.007868.
FTRB Current Market Dynamics
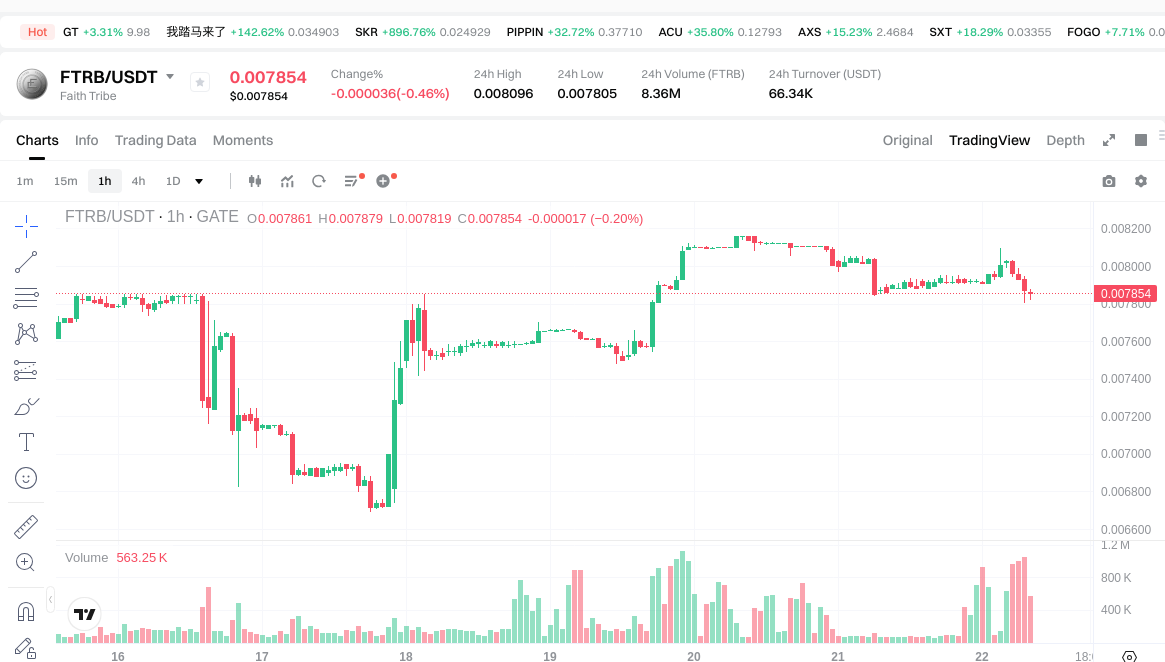
As of January 22, 2026, FTRB is trading at $0.007868, with 24-hour trading volume reaching $64,699.77. The token has shown mixed short-term performance, with a slight decline of 0.44% over the past hour and 0.29% over 24 hours. However, the 7-day trend indicates positive momentum with a 1.73% increase.
The token's recent 30-day performance has been particularly noteworthy, recording a substantial gain of 108.42%, while the yearly performance stands at 70.71%. The 24-hour price range has fluctuated between $0.007805 and $0.008096.
FTRB's market capitalization currently stands at approximately $25.25 million, with a circulating supply of 3.21 billion tokens representing 64.18% of the total supply of 5 billion tokens. The fully diluted market cap is calculated at $39.34 million. The token maintains a market dominance of 0.0012% and is tracked by 11,473 holders across its ecosystem.
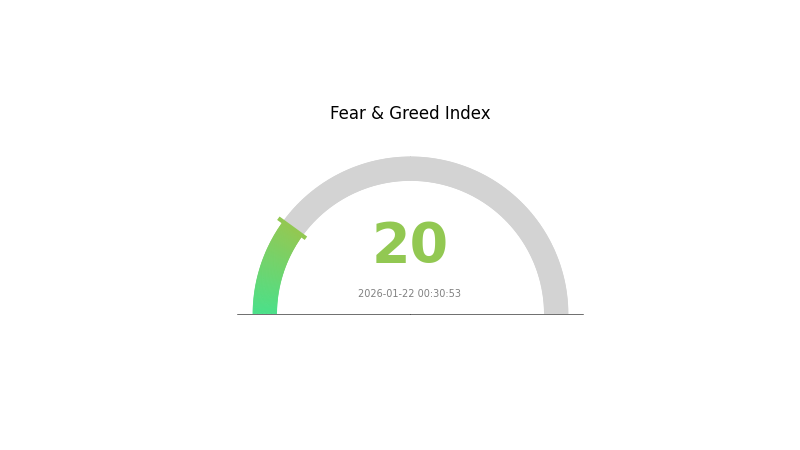
The current market sentiment indicator reflects a reading of 20, suggesting cautious trading conditions in the broader cryptocurrency market environment.
Click to view current FTRB market price
FTRB Market Sentiment Index
2026-01-22 Fear and Greed Index: 20 (Extreme Fear)
Click to view current Fear & Greed Index
The cryptocurrency market is currently in a state of extreme fear, with the FTRB index reading 20. This indicates heightened market anxiety and pessimism among investors. During extreme fear periods, market participants often exhibit risk-averse behavior, leading to potential selling pressure. However, such extreme sentiment levels have historically presented contrarian opportunities for long-term investors. Market participants should exercise caution while considering their risk tolerance and investment strategies during this volatile period.
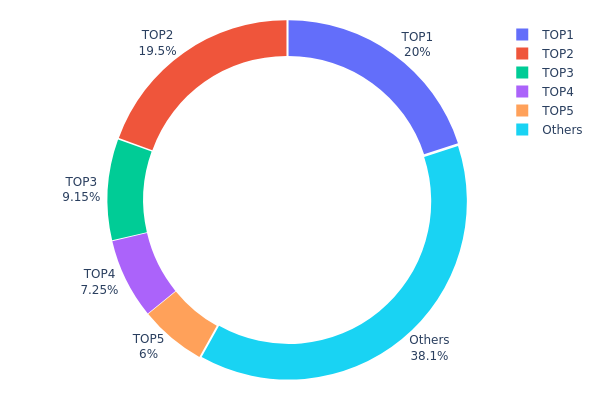
FTRB Holding Distribution
The holding distribution chart reveals the concentration of FTRB tokens across different wallet addresses, serving as a critical indicator of market structure and decentralization level. According to the current data, the top 5 addresses collectively hold approximately 61.84% of the total FTRB supply, with the remaining 38.16% distributed among other addresses. Notably, the largest holder controls 998,584.01K tokens (19.97%), while the second-largest address holds 974,491.49K tokens (19.48%). The third through fifth positions account for 9.15%, 7.24%, and 6.00% respectively, demonstrating a steep decline in concentration beyond the top two addresses.
This distribution pattern suggests a relatively high concentration risk in FTRB's current market structure. The dominance of the top two addresses, which together control nearly 40% of the circulating supply, raises concerns about potential market manipulation and price volatility. Such concentration can significantly impact liquidity dynamics, as large holders possess substantial power to influence price movements through coordinated selling or buying activities. Additionally, the sharp decline in holdings from the third position onwards indicates a potential imbalance in token distribution, which may constrain broader community participation and governance decentralization.
From a market stability perspective, this concentration level presents both opportunities and risks. While large holders may provide initial liquidity and market-making support, their positions also introduce systemic vulnerability. Any significant token movements from these addresses could trigger substantial price fluctuations and affect investor confidence. The current on-chain structure reflects a project still in its early stages of distribution, where achieving broader token dispersion remains a critical challenge for long-term ecosystem health and sustainable growth.
Click to view the current FTRB Holding Distribution
| Top |
Address |
Holding Qty |
Holding (%) |
| 1 |
0x40ec...5bbbdf |
998584.01K |
19.97% |
| 2 |
0x3a94...d390da |
974491.49K |
19.48% |
| 3 |
0xac2d...d68aeb |
457529.40K |
9.15% |
| 4 |
0x9838...d2f679 |
362281.05K |
7.24% |
| 5 |
0x862d...012175 |
300000.00K |
6.00% |
| - |
Others |
1907114.06K |
38.16% |
II. Core Factors Influencing FTRB's Future Price
Based on the available information, there is insufficient data to provide a comprehensive analysis of the core factors that may influence FTRB's future price. The provided materials do not contain specific details regarding supply mechanisms, institutional holdings, macroeconomic contexts, or technical developments related to FTRB.
For a thorough price analysis, information about token economics, major stakeholder activities, broader market conditions, and project-specific developments would be necessary. Readers interested in FTRB should conduct independent research and consult multiple sources before making any investment decisions.
III. 2026-2031 FTRB Price Forecast
2026 Outlook
- Conservative forecast: $0.00456 - $0.00785
- Neutral forecast: $0.00785 (average projection)
- Optimistic forecast: $0.01045 (requires favorable market conditions and increased adoption)
2027-2029 Outlook
- Market stage expectation: Gradual growth phase with moderate volatility, reflecting steady market development and expanding utility
- Price range forecast:
- 2027: $0.00512 - $0.01363 (approximately 16% average increase)
- 2028: $0.0082 - $0.01492 (approximately 44% average increase)
- 2029: $0.0096 - $0.01881 (approximately 67% average increase)
- Key catalysts: Enhanced platform functionality, growing user base, potential technological upgrades, and broader crypto market recovery
2030-2031 Long-term Outlook
- Baseline scenario: $0.01359 - $0.0219 (assuming sustained project development and stable market conditions)
- Optimistic scenario: $0.01894 - $0.02349 (assuming strong ecosystem expansion and favorable regulatory environment)
- Transformative scenario: Prices exceeding $0.02349 (requires exceptional adoption rates, major partnerships, and breakthrough innovations)
- 2026-01-22: FTRB trading within early-stage valuation range, with multi-year growth potential indicated by technical projections
| Year |
Predicted High Price |
Predicted Average Price |
Predicted Low Price |
Price Change |
| 2026 |
0.01045 |
0.00785 |
0.00456 |
0 |
| 2027 |
0.01363 |
0.00915 |
0.00512 |
16 |
| 2028 |
0.01492 |
0.01139 |
0.0082 |
44 |
| 2029 |
0.01881 |
0.01316 |
0.0096 |
67 |
| 2030 |
0.0219 |
0.01599 |
0.01359 |
103 |
| 2031 |
0.02349 |
0.01894 |
0.01156 |
140 |
IV. FTRB Professional Investment Strategy and Risk Management
FTRB Investment Methodology
(1) Long-term Holding Strategy
- Suitable for: Investors who believe in the long-term development potential of Web3 fashion design platforms and can tolerate short-term volatility
- Operational Recommendations:
- Consider dollar-cost averaging during periods of price consolidation to reduce timing risk
- Monitor project development milestones and community growth indicators
- Utilize secure storage solutions like Gate Web3 Wallet for long-term asset custody
(2) Active Trading Strategy
- Technical Analysis Tools:
- Moving Averages: Use 50-day and 200-day moving averages to identify trend directions and potential entry/exit points
- Volume Analysis: Monitor 24-hour trading volume (currently $64,699.77) relative to historical averages to gauge market interest
- Swing Trading Considerations:
- Pay attention to the token's recent 30-day volatility (up 108.42%) when setting position sizes
- Establish clear profit-taking levels and stop-loss thresholds based on technical support and resistance zones
FTRB Risk Management Framework
(1) Asset Allocation Principles
- Conservative Investors: Allocate no more than 1-2% of crypto portfolio to FTRB
- Moderate Investors: Consider 3-5% allocation as part of a diversified Web3 portfolio
- Aggressive Investors: May allocate 5-8% while maintaining strict risk controls
(2) Risk Hedging Approaches
- Portfolio Diversification: Balance FTRB exposure with established cryptocurrencies and stablecoins
- Position Sizing: Adjust exposure based on market volatility and personal risk tolerance
(3) Secure Storage Solutions
- Hot Wallet Recommendation: Gate Web3 Wallet for convenient trading and moderate holdings
- Cold Storage Option: Hardware wallet solutions for long-term holdings exceeding comfort levels for online storage
- Security Considerations: Never share private keys, enable two-factor authentication, and verify contract addresses (0x2596825a84888e8f24b747df29e11b5dd03c81d7 on Ethereum)
V. FTRB Potential Risks and Challenges
FTRB Market Risks
- Liquidity Risk: With a 24-hour trading volume of $64,699.77 and listing on only 4 exchanges, the token may experience significant price slippage during large transactions
- Price Volatility: Historical data shows substantial fluctuations, with the token experiencing both significant gains (108.42% in 30 days) and previous declines from its all-time high of $0.07116
- Market Cap Position: Ranked #775 with a market capitalization of approximately $25.25 million, the project faces competition from larger, more established platforms
FTRB Regulatory Risks
- Fashion Industry Tokenization: Regulatory frameworks for tokenized fashion design platforms remain evolving across different jurisdictions
- Token Classification: Uncertainty regarding how regulatory authorities may classify FTRB could impact trading and usage
- Compliance Requirements: The project's operation at the intersection of fashion and blockchain may face requirements from multiple regulatory bodies
FTRB Technical Risks
- Smart Contract Security: As an ERC-20 token on Ethereum, the project depends on the security of its smart contracts
- Platform Adoption: The success of the Faith Tribe platform relies on attracting and retaining designers, artists, and buyers to its ecosystem
- Competition: The Web3 fashion design space may attract competitors with greater resources or technological advantages
VI. Conclusion and Action Recommendations
FTRB Investment Value Assessment
Faith Tribe (FTRB) represents an innovative approach to fashion design collaboration within the Web3 ecosystem, backed by Faith Connexion's 21-year luxury streetwear heritage. The token's recent 30-day performance of 108.42% demonstrates growing market interest, though its current trading volume of approximately $64,700 and presence on only 4 exchanges suggest it remains in an early adoption phase. With a circulating supply representing 64.18% of maximum supply and 11,473 holders, the project shows moderate distribution. However, investors should consider the inherent volatility, with prices ranging from an all-time high of $0.07116 to a low of $0.00173617.
FTRB Investment Recommendations
✅ Beginners: Start with minimal exposure (under 1% of crypto portfolio), focus on understanding the Web3 fashion design sector, and use Gate Web3 Wallet for secure storage while learning
✅ Experienced Investors: Consider small to moderate position sizing (2-5% allocation) as part of a diversified Web3 portfolio, monitor platform development metrics and community growth, and implement clear entry and exit strategies
✅ Institutional Investors: Conduct thorough due diligence on the project's technology, team, and market positioning, evaluate liquidity constraints given the current trading volume, and consider the token within the context of broader Web3 fashion sector opportunities
FTRB Trading Participation Methods
- Spot Trading: Purchase FTRB directly on Gate.com with cryptocurrency pairs, suitable for long-term holding or swing trading strategies
- Gradual Accumulation: Implement dollar-cost averaging to build positions over time and reduce timing risk
- Portfolio Integration: Include FTRB as part of a broader Web3 or metaverse-focused investment portfolio
Cryptocurrency investment carries extreme risk, and this article does not constitute investment advice. Investors should make cautious decisions based on their own risk tolerance and are advised to consult professional financial advisors. Never invest more than you can afford to lose.
FAQ
What is FTRB? What are its fundamentals and use cases?
FTRB is a blockchain-based utility token designed for decentralized finance applications. It provides governance rights, transaction fee discounts, and access to exclusive DeFi protocols. The token leverages smart contracts to enable efficient capital allocation and reward long-term holders through staking mechanisms.
How to analyze FTRB's historical price trends and technical characteristics?
Analyze FTRB by examining price charts, support/resistance levels, and trading volume patterns. Use technical indicators like moving averages, RSI, and MACD to identify trends. Review market cycles and volatility. Study on-chain metrics and community sentiment for comprehensive analysis.
What are the main factors affecting FTRB price fluctuations?
FTRB price is influenced by market demand, trading volume, project developments, overall crypto market sentiment, regulatory changes, and investor confidence in the ecosystem.
Common FTRB price prediction methods include technical analysis(charting patterns,moving averages),fundamental analysis(project metrics,market sentiment),on-chain analysis(transaction volume,holder distribution),and AI predictive models. Popular tools include TradingView,CoinGecko data analytics,and blockchain explorers for on-chain metrics.
What are the advantages and disadvantages of FTRB compared to other similar tokens?
FTRB advantages: innovative tokenomics, strong community support, and efficient transaction volume. Disadvantages: newer market presence and lower liquidity compared to established competitors. Overall, FTRB positions itself as a competitive option with growth potential.
What risks should I pay attention to when investing in FTRB?
FTRB carries market volatility, liquidity, and regulatory risks. Monitor price fluctuations, ensure adequate trading volume, and stay informed on regulatory changes. Diversify your portfolio and only invest what you can afford to lose.
* The information is not intended to be and does not constitute financial advice or any other recommendation of any sort offered or endorsed by Gate.