This comprehensive analysis examines G token's price trajectory from 2026 to 2031, providing professional forecasts for investors across all experience levels. Currently trading at $0.004362 with a $31.55 million market cap, G serves as the utility token powering Gravity and Galxe ecosystems. The article reviews historical performance, market dynamics, and supply mechanisms before presenting tiered price predictions ranging from conservative ($0.00279-$0.00436) to optimistic scenarios ($0.01052 by 2031). It outlines practical investment strategies including long-term holding and active trading approaches, comprehensive risk management frameworks, and secure storage solutions via Gate Web3 Wallet. The analysis also addresses significant risks including price volatility, market concentration, and staking implementation uncertainties. Suitable for beginners, experienced traders, and institutional investors seeking data-driven guidance on G token investment decisions.
Introduction: G's Market Position and Investment Value
Gravity (G), positioned as the native token powering both Gravity and Galxe ecosystems, has been serving as a critical infrastructure component since its launch in 2024. As of 2026, G maintains a market capitalization of approximately $31.55 million with a circulating supply of around 7.23 billion tokens, trading at $0.004362. This asset, recognized as a utility token driving governance, growth incentives, and payment facilitation, is playing an increasingly vital role in blockchain transaction processing and ecosystem governance.
This article will comprehensively analyze G's price trajectory from 2026 to 2031, incorporating historical patterns, market supply-demand dynamics, ecosystem development, and macroeconomic conditions to provide investors with professional price forecasts and practical investment strategies.
I. G Price History Review and Current Market Status
G Historical Price Evolution Trajectory
- 2024: G token launched in July, reaching a peak price of $0.05764 on July 25th, marking the project's initial market entry phase
- 2025: Market experienced significant volatility, with the token declining from previous highs and touching a low of $0.003997 on December 31st
- 2026: As of January 21st, the token continues to trade within a consolidation range, showing ongoing market adjustment
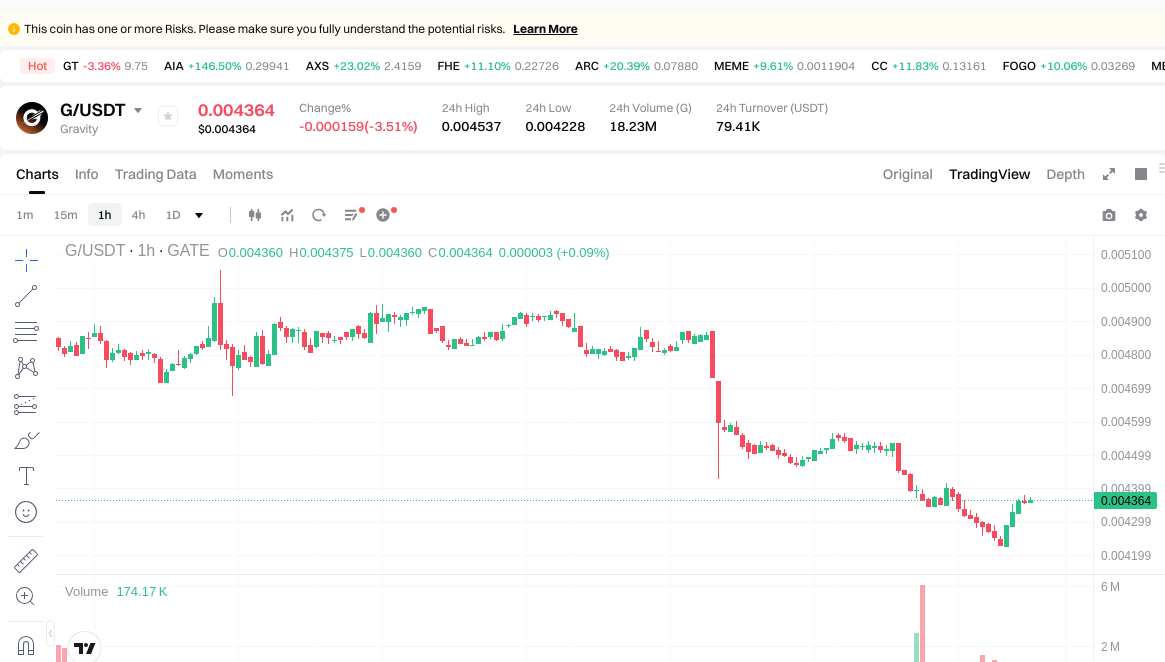
G Current Market Situation
As of January 21, 2026, G is trading at $0.004362, representing a 1-hour decline of 0.25%, a 24-hour decrease of 3.19%, and a 7-day drop of 11.12%. The 24-hour trading range shows a high of $0.004537 and a low of $0.004228, with a trading volume of $79,434.92.
The token currently holds a market ranking of #695, with a circulating market capitalization of approximately $31.55 million and a 24-hour market share of 0.0016%. The circulating supply stands at 7.23 billion G tokens, representing 60.27% of the total supply of 12 billion tokens. The fully diluted market capitalization reaches $52.34 million.
G has been listed on 33 cryptocurrency exchanges and maintains 24,725 holders. The token operates as an ERC20 standard asset on the Ethereum network, with its contract address at 0x9c7beba8f6ef6643abd725e45a4e8387ef260649. The current market sentiment index indicates a reading of 24, reflecting an Extreme Fear environment in the broader cryptocurrency market.
The 30-day price performance shows a relatively modest decline of 1.04%, while the 1-year perspective reveals an 83.46% decrease from previous levels. The gap between the circulating market cap and fully diluted valuation suggests potential token unlock schedules ahead.
Click to view current G market price
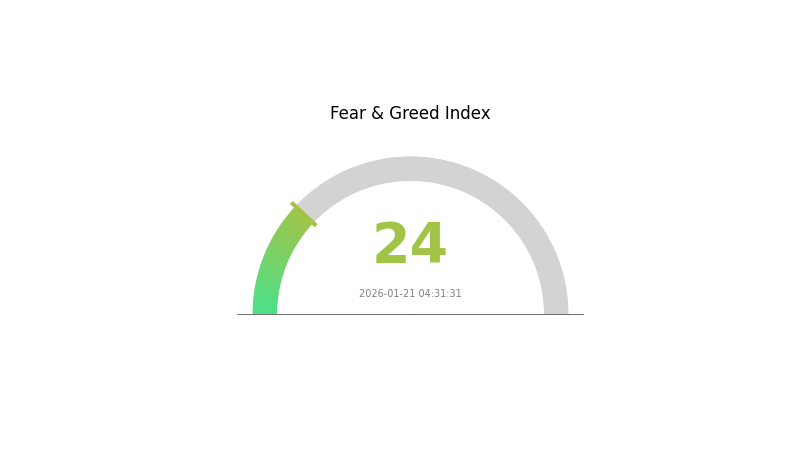
G Market Sentiment Index
2026-01-21 Fear and Greed Index: 24 (Extreme Fear)
Click to view current Fear & Greed Index
The cryptocurrency market is currently experiencing extreme fear, with the Fear and Greed Index standing at 24. This significantly depressed sentiment reflects heightened market uncertainty and investor anxiety. When the index reaches such low levels, it often signals potential capitulation among retail investors. However, historically, periods of extreme fear have presented contrarian opportunities for long-term investors with strong conviction. Market participants should exercise caution while remaining alert to potential reversal signals. Risk management remains paramount during such volatile market conditions.
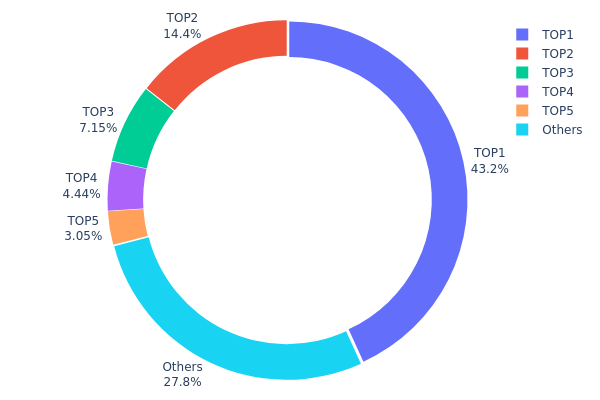
G Holding Distribution
The holding distribution chart reveals the concentration of G tokens across different wallet addresses, serving as a critical indicator of decentralization and market structure stability. Current data shows that the top 5 addresses collectively hold approximately 72.16% of the total G supply, with the largest single address (0x7983...364c42) controlling 43.16% of all tokens. This high concentration level suggests a relatively centralized distribution pattern, where a small number of entities possess substantial control over the token's circulating supply.
This concentrated holding structure presents both opportunities and risks for market participants. The dominance of top holders, particularly the leading address holding over 40% of supply, creates potential vulnerability to significant price movements should these addresses decide to liquidate or redistribute their holdings. The second and third largest holders control 14.38% and 7.15% respectively, further reinforcing the top-heavy distribution. While such concentration is not uncommon in early-stage or utility-focused tokens, it does indicate limited distribution breadth and suggests that G's on-chain governance and price stability may be susceptible to decisions made by a relatively small group of stakeholders.
From a market structure perspective, the current holding distribution reflects moderate centralization risk, with approximately 27.84% of tokens distributed among smaller addresses. This concentration level warrants careful monitoring, as large holder movements could trigger substantial volatility and potentially impact market confidence. The distribution pattern suggests that G's ecosystem maturity and decentralization progress remain areas requiring continued development and broader token distribution efforts.
Click to view current G Holding Distribution
| Top |
Address |
Holding Qty |
Holding (%) |
| 1 |
0x7983...364c42 |
4975518.48K |
43.16% |
| 2 |
0x1a70...1e8800 |
1658152.48K |
14.38% |
| 3 |
0xbd6e...fbfb6d |
824607.98K |
7.15% |
| 4 |
0xf977...41acec |
511431.95K |
4.43% |
| 5 |
0xec9f...a8226b |
351259.99K |
3.04% |
| - |
Others |
3205586.39K |
27.84% |
Since the provided materials contain no information about the cryptocurrency 'G', and there is insufficient data in my knowledge base to accurately complete the required sections regarding supply mechanisms, institutional dynamics, macroeconomic environment, and technical developments for this specific token, I must omit the entire content as per the instructions. No fabricated information or unsupported inferences can be made.
III. 2026-2031 G Price Forecast
2026 Outlook
- Conservative forecast: $0.00279 - $0.00436
- Neutral forecast: $0.00436
- Optimistic forecast: $0.00615 (contingent on favorable market conditions)
2027-2029 Mid-term Outlook
- Market phase expectation: Gradual growth trajectory with moderate volatility as the token establishes broader market presence
- Price range forecast:
- 2027: $0.00479 - $0.00642 (approximately 20% increase from 2026)
- 2028: $0.00502 - $0.00718 (33% cumulative growth)
- 2029: $0.00384 - $0.00794 (49% cumulative growth potential)
- Key catalysts: Market adoption expansion, ecosystem development progress, and overall cryptocurrency market sentiment
2030-2031 Long-term Outlook
- Baseline scenario: $0.00600 - $0.00722 (65% cumulative growth from 2026 baseline)
- Optimistic scenario: $0.00762 - $0.00802 (sustained upward momentum through 2030)
- Growth scenario: $0.01052 (74% cumulative increase by 2031, driven by significant ecosystem maturation and adoption milestones)
- 2026-01-21: G trading within established range as market evaluates long-term potential
| Year |
Predicted High Price |
Predicted Average Price |
Predicted Low Price |
Price Change |
| 2026 |
0.00615 |
0.00436 |
0.00279 |
0 |
| 2027 |
0.00642 |
0.00526 |
0.00479 |
20 |
| 2028 |
0.00718 |
0.00584 |
0.00502 |
33 |
| 2029 |
0.00794 |
0.00651 |
0.00384 |
49 |
| 2030 |
0.00802 |
0.00722 |
0.006 |
65 |
| 2031 |
0.01052 |
0.00762 |
0.00427 |
74 |
IV. G Professional Investment Strategy and Risk Management
G Investment Methodology
(1) Long-term Holding Strategy
- Suitable for: Investors who believe in the long-term development of the Gravity and Galxe ecosystems and are willing to hold through market volatility
- Operational Recommendations:
- Consider establishing positions during market corrections, particularly when G trades near its historical support levels
- Monitor the progress of staking functionality rollout, as this may provide additional incentive mechanisms for long-term holders
- Storage Solution: Use Gate Web3 Wallet for secure storage, enabling easy access to potential staking rewards and governance participation once these features are fully implemented
(2) Active Trading Strategy
- Technical Analysis Tools:
- Support and Resistance Levels: Monitor the 24-hour high of $0.004537 and low of $0.004228 as short-term trading boundaries
- Volume Analysis: Track the 24-hour trading volume of approximately $79,435 to gauge market participation and liquidity
- Swing Trading Considerations:
- Be aware of the token's recent volatility, with a 7-day decline of 11.12% and 30-day decline of 1.04%
- Consider the circulating supply ratio of 60.27%, which may impact price movements as more tokens enter circulation
G Risk Management Framework
(1) Asset Allocation Principles
- Conservative Investors: 1-3% of crypto portfolio allocation
- Aggressive Investors: 5-8% of crypto portfolio allocation
- Professional Investors: May allocate up to 10-15% depending on risk tolerance and ecosystem involvement
(2) Risk Hedging Solutions
- Portfolio Diversification: Balance G holdings with established cryptocurrencies and stablecoins
- Position Sizing: Use dollar-cost averaging to mitigate timing risk, especially given recent market volatility
(3) Secure Storage Solutions
- Hot Wallet Recommendation: Gate Web3 Wallet for active trading and ecosystem participation
- Multi-signature Solution: For larger holdings, consider implementing multi-signature security protocols
- Security Considerations: Always verify contract addresses (ETH: 0x9c7beba8f6ef6643abd725e45a4e8387ef260649), enable two-factor authentication, and never share private keys
V. G Potential Risks and Challenges
G Market Risks
- Significant Price Volatility: G has experienced considerable price fluctuations, with a 1-year decline of 83.46% from its all-time high of $0.05764 recorded in July 2024
- Limited Market Depth: With a current market capitalization of approximately $31.5 million and ranking at #695, liquidity may be constrained during periods of high volatility
- Market Share Concentration: G represents only 0.0016% of the total cryptocurrency market cap, indicating limited market penetration
G Regulatory Risks
- Utility Token Classification: As a utility token serving gas fees and future staking functions, regulatory treatment may vary across jurisdictions
- Ecosystem Dependency: Regulatory actions affecting the Gravity chain or Galxe ecosystem could impact G's utility and value proposition
- Cross-border Compliance: With 33 exchanges listing G and a holder base of 24,725, maintaining compliance across multiple jurisdictions presents ongoing challenges
G Technical Risks
- Staking Mechanism Implementation: The planned staking functionality to secure the network is not yet fully operational, creating uncertainty around network security and token economics
- Smart Contract Vulnerabilities: As an ERC-20 token on Ethereum, G is subject to potential smart contract risks inherent to the blockchain ecosystem
- Scalability Challenges: As gas token usage increases with ecosystem growth, the network may face scalability pressures that could affect transaction costs and user experience
VI. Conclusion and Action Recommendations
G Investment Value Assessment
G presents a dual-ecosystem utility proposition serving both Gravity and Galxe platforms. The token's value is intrinsically linked to the adoption and growth of these ecosystems, with planned staking mechanisms potentially providing additional utility. However, investors should note the significant price decline from historical highs and relatively modest market position. The long-term value proposition depends on successful ecosystem expansion, implementation of staking functionality, and increasing transaction volume requiring gas payments. Short-term risks include continued market volatility and the token's sensitivity to broader cryptocurrency market conditions.
G Investment Recommendations
✅ Beginners: Start with small position sizes (1-2% of crypto portfolio) and focus on understanding the Gravity and Galxe ecosystems before increasing exposure. Consider using Gate.com's educational resources to learn about gas tokens and staking mechanisms.
✅ Experienced Investors: Monitor ecosystem development metrics, particularly transaction volume on Gravity chain and user growth on Galxe platform. Consider accumulating positions during market weakness while maintaining strict risk management protocols.
✅ Institutional Investors: Conduct thorough due diligence on ecosystem partnerships, technical roadmap execution, and token distribution schedule. Evaluate G's role within a broader portfolio of infrastructure and utility tokens.
G Trading Participation Methods
- Spot Trading on Gate.com: Direct purchase and sale of G tokens with access to competitive liquidity across 33 listed exchanges
- Dollar-Cost Averaging: Systematic periodic purchases to mitigate timing risk and volatility exposure
- Ecosystem Participation: Actively engage with Gravity and Galxe platforms to better understand utility value and upcoming features like staking
Cryptocurrency investment carries extremely high risks. This article does not constitute investment advice. Investors should make cautious decisions based on their own risk tolerance and are advised to consult professional financial advisors. Never invest more than you can afford to lose.
FAQ
What factors influence gold price predictions?
Gold price predictions are influenced by multiple factors: global economic conditions, inflation rates, interest rate changes, currency fluctuations, geopolitical tensions, central bank policies, supply and demand dynamics, and market sentiment. Technical analysis of historical price trends and trading volume also play significant roles in forecasting future price movements.
How do geopolitical events affect gold prices?
Geopolitical tensions typically drive gold prices higher as investors seek safe-haven assets. Conflicts, trade disputes, and political instability increase uncertainty, boosting demand for gold as a store of value. Economic sanctions and currency volatility further support gold appreciation during geopolitical crises.
Is gold a good investment in 2024?
Gold remains a strong investment choice in 2024, serving as a reliable hedge against inflation and currency volatility. Its consistent demand and limited supply support sustained value growth, making it attractive for portfolio diversification.
What is the relationship between US dollar and gold prices?
US dollar and gold prices typically move inversely. When the dollar weakens, gold becomes cheaper for foreign buyers, increasing demand and pushing prices higher. Conversely, a stronger dollar makes gold more expensive internationally, reducing demand and lowering prices.
How do interest rates impact gold price forecasts?
Higher interest rates typically lower gold prices as investors favor yield-bearing assets over non-yielding gold. Conversely, lower rates increase gold demand, pushing prices higher. Interest rate expectations significantly influence short-term and long-term gold price forecasts.
What are the main methods for predicting gold price movements?
Main prediction methods include technical analysis of price charts and trends, fundamental analysis of macroeconomic factors like inflation and interest rates, analysis of trading volume and market sentiment, and monitoring geopolitical events affecting supply and demand dynamics.
How does inflation affect gold prices?
Inflation typically drives gold prices higher as investors seek inflation hedges. When currency values decline due to inflation, gold becomes more attractive as a store of value, increasing demand and pushing prices upward.
* The information is not intended to be and does not constitute financial advice or any other recommendation of any sort offered or endorsed by Gate.