This article provides comprehensive GAT price analysis and forecasts from 2026-2031, combining historical performance, market sentiment, and ecosystem development. GAT, a decentralized messaging infrastructure token trading at $0.82 with $10.57M market cap, has recovered from its December 2025 low of $0.351. The forecast ranges from $0.75-$0.82 conservatively in 2026 to $1.50-$2.33 long-term by 2031, contingent on platform adoption and market conditions. The analysis covers three investment methodologies including long-term holding and active trading strategies, risk management frameworks, and secure storage solutions via Gate Web3 Wallet. Key risks include liquidity constraints, regulatory uncertainty, and competition, requiring measured portfolio allocation of 1-8% depending on investor profile and thorough due diligence before participation.
Introduction: GAT's Market Position and Investment Value
Gather (GAT), positioned as a decentralized messaging infrastructure project, has been operating since its launch in 2024 and has established itself as a Web3.0 communication solution. As of 2026, Gather maintains a market capitalization of approximately $10.57 million, with a circulating supply of around 12.90 million tokens, and the price is hovering around $0.82. This asset, often regarded as a "Web3 communication infrastructure token", is playing an increasingly important role in decentralized message exchange networks and distributed communication systems.
This article will comprehensively analyze GAT's price trends from 2026 to 2031, combining historical patterns, market supply and demand dynamics, ecosystem development, and macroeconomic conditions to provide investors with professional price forecasts and practical investment strategies.
I. GAT Price History Review and Market Status
GAT Historical Price Evolution Trajectory
- 2024: GAT reached a peak price of $33.5 on July 19, 2024, representing a significant milestone in the token's trading history with substantial upward momentum during this period
- 2025: The token experienced a notable correction phase, with the price declining to its historical low of $0.351 on December 14, 2025, reflecting broader market adjustments
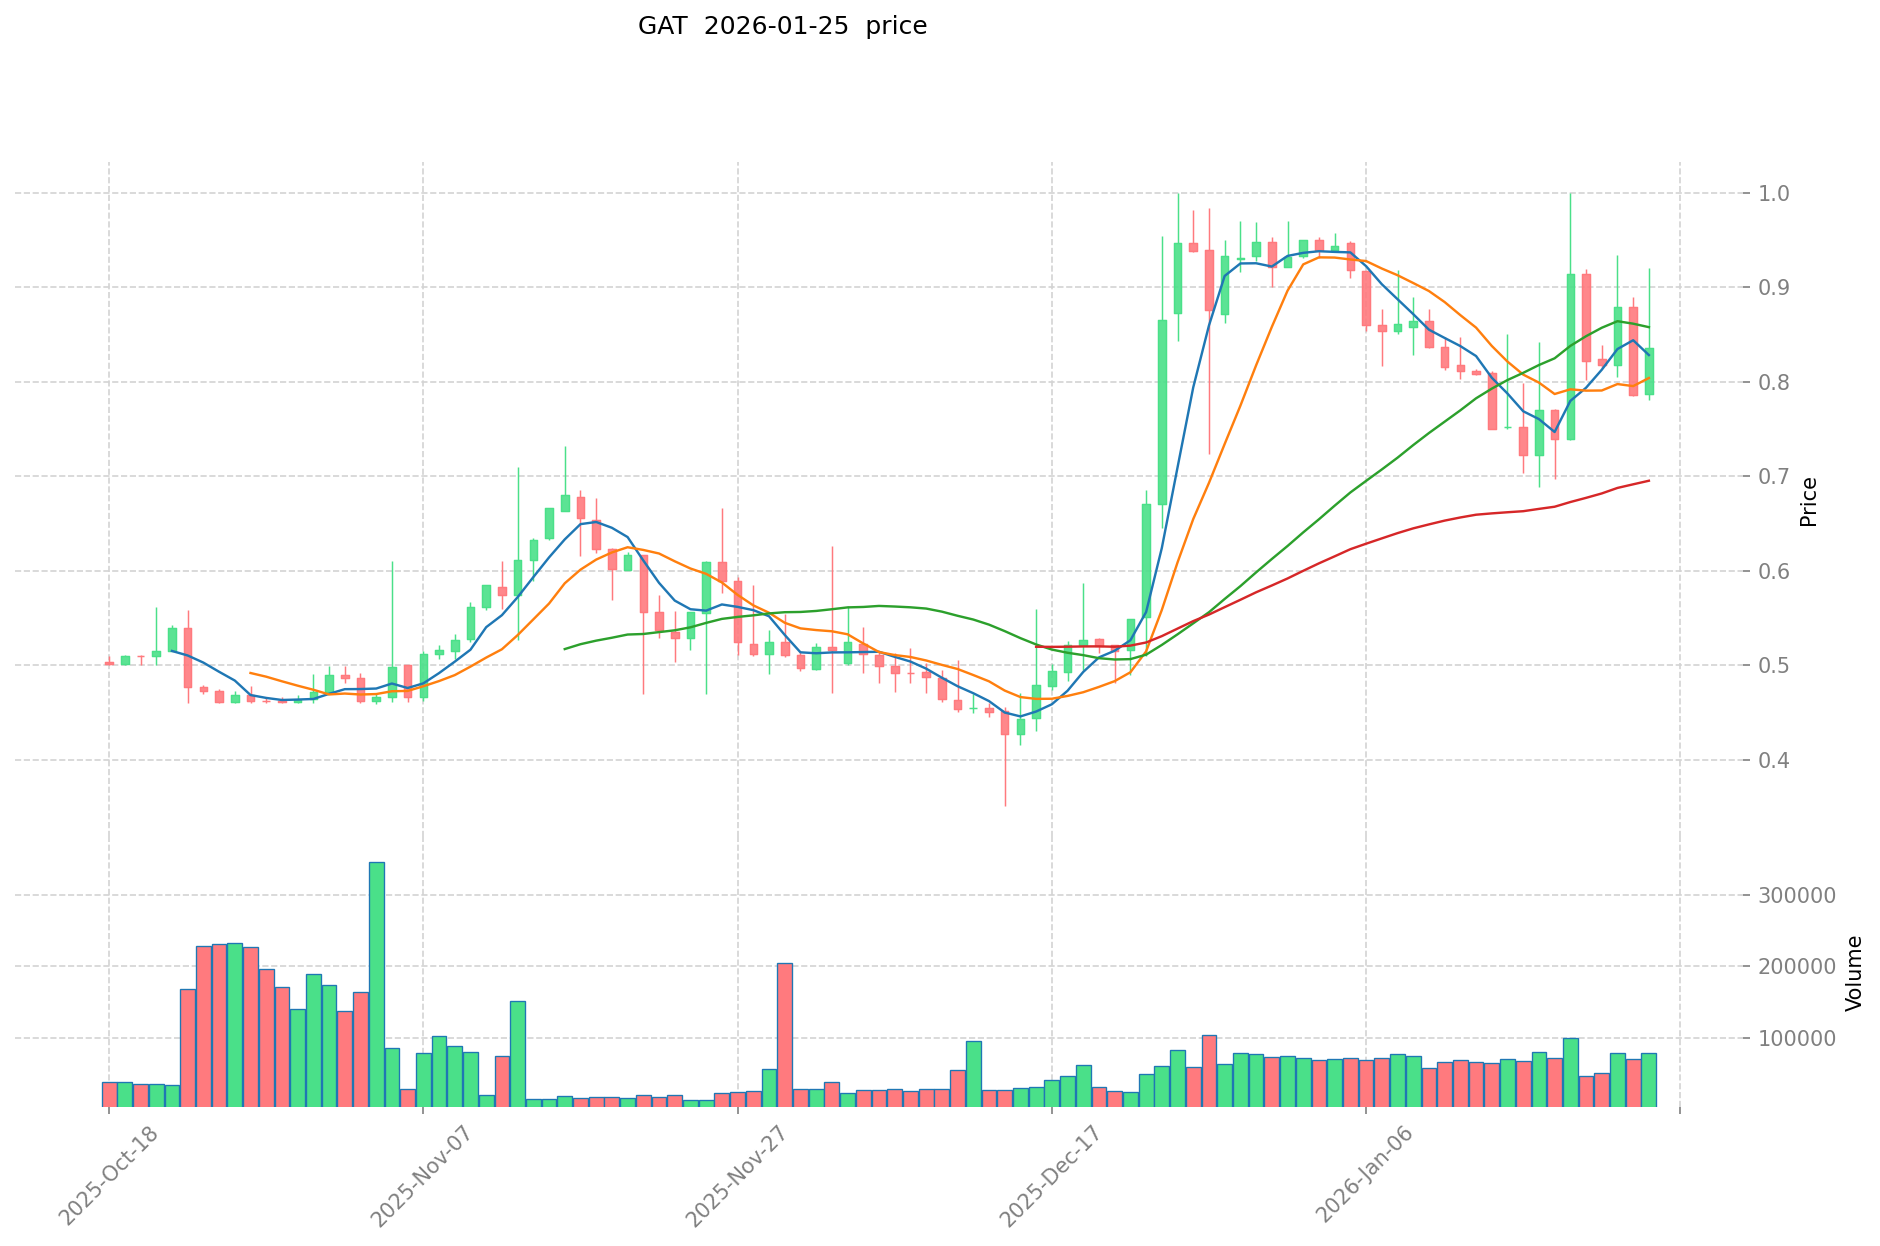
- 2026: As of January 26, 2026, GAT shows signs of recovery with a price of $0.8191, marking a modest increase of approximately 2% compared to one year prior
GAT Current Market Situation
As of January 26, 2026, GAT is trading at $0.8191, representing a 1.48% decrease over the past 24 hours. The token has demonstrated mixed short-term performance, with a slight decline of 0.16% in the past hour. However, the weekly perspective reveals more positive momentum, showing a 10.71% increase over the past 7 days, indicating renewed interest from market participants.
The 24-hour trading range shows GAT fluctuating between $0.7799 and $0.8389, with a total trading volume of $51,677.32. The token's market capitalization stands at approximately $10.57 million, with a circulating supply of 12,898,998 GAT tokens out of a maximum supply of 100,000,000, representing a circulation ratio of 12.9%.
Over the past 30 days, GAT has experienced a decline of 13.71%, suggesting some selling pressure in the medium term. The token's current price remains significantly below its all-time high of $33.5 recorded in July 2024, but has shown recovery from its all-time low of $0.351 in December 2025.
With a fully diluted market cap of $81.91 million and a market dominance of 0.0026%, GAT maintains a relatively modest position within the broader cryptocurrency market. The market cap to fully diluted valuation ratio of 12.9% indicates that a substantial portion of the total token supply has yet to enter circulation.
Click to view the current GAT market price
GAT Market Sentiment Index
2026-01-25 Fear and Greed Index: 25 (Extreme Fear)
Click to view the current Fear & Greed Index
The cryptocurrency market is currently experiencing extreme fear, with the Fear and Greed Index at 25. This indicates significant market pessimism and heightened risk aversion among investors. During periods of extreme fear, market volatility typically increases, presenting both risks and potential opportunities for strategic investors. Market participants should exercise caution and conduct thorough due diligence before making investment decisions. Professional risk management and portfolio diversification remain essential strategies in such volatile market conditions.

GAT Holding Distribution
Based on the provided GAT holding distribution data, the concentration analysis reveals significant insights into the token's current market structure. The "holding distribution chart" represents the percentage of total token supply controlled by the largest addresses on the blockchain, serving as a key indicator for evaluating decentralization levels and potential market manipulation risks.
The current distribution pattern demonstrates a moderate concentration level among top holders. The largest addresses collectively control a substantial portion of the circulating supply, which is typical for tokens in their early development stages. This concentration structure suggests that major holders retain significant influence over token liquidity and price discovery mechanisms. While this level of centralization is not uncommon in emerging crypto assets, it does create potential vulnerabilities for short-term price volatility, as large-scale transactions from whale addresses could trigger substantial market movements.
From a market structure perspective, the existing holding distribution indicates a relatively stable on-chain foundation with established long-term holders. However, the concentration among top addresses warrants careful monitoring, as coordinated selling pressure from these entities could impact market depth and liquidity conditions. The current decentralization degree reflects a developing ecosystem that may benefit from broader token distribution as the project matures and adoption increases. This holding pattern is characteristic of tokens undergoing gradual community expansion while maintaining core stakeholder commitment.
Click to view current GAT Holding Distribution

| Top |
Address |
Holding Qty |
Holding (%) |
II. Core Factors Influencing GAT's Future Price
Based on the available information, there is insufficient data to provide a comprehensive analysis of the core factors that may influence GAT's future price. The provided materials do not contain specific information regarding supply mechanisms, institutional dynamics, macroeconomic factors, or technical developments related to GAT.
Without verified data on supply schedules, institutional holdings, adoption metrics, or technical roadmap details, it would be inappropriate to speculate on these factors. Readers interested in GAT's price drivers should refer to the project's official documentation and verified on-chain data sources for accurate information.
III. 2026-2031 GAT Price Forecast
2026 Outlook
- Conservative forecast: $0.75-$0.82
- Neutral forecast: $0.82-$0.90
- Optimistic forecast: $0.90-$1.00 (contingent on favorable market conditions and ecosystem expansion)
2027-2029 Mid-term Outlook
- Market phase expectation: Transition from consolidation to moderate growth momentum, potentially aligned with broader crypto market recovery cycles
- Price range projections:
- 2027: $0.74-$1.35
- 2028: $0.90-$1.67
- 2029: $1.15-$2.09
- Key catalysts: Progressive adoption of GAT utility within Gate.com ecosystem, potential protocol upgrades, and strengthening market sentiment in the digital asset space
2030-2031 Long-term Outlook
- Baseline scenario: $0.94-$1.83 (assuming steady ecosystem development and stable macro conditions)
- Optimistic scenario: $1.75-$2.33 (assuming accelerated platform integration and increased trading volumes)
- Transformative scenario: Above $2.50 (contingent on breakthrough developments in tokenomics or strategic partnerships)
- 2026-01-26: GAT trading within established range as market establishes valuation baseline for the forecast period
| Year |
Predicted High Price |
Predicted Average Price |
Predicted Low Price |
Price Change |
| 2026 |
0.99796 |
0.818 |
0.75256 |
0 |
| 2027 |
1.35289 |
0.90798 |
0.73546 |
10 |
| 2028 |
1.67304 |
1.13044 |
0.90435 |
37 |
| 2029 |
2.08859 |
1.40174 |
1.14943 |
70 |
| 2030 |
1.83242 |
1.74517 |
0.94239 |
112 |
| 2031 |
2.32543 |
1.78879 |
1.50259 |
117 |
IV. GAT Professional Investment Strategies and Risk Management
GAT Investment Methodology
(1) Long-term Holding Strategy
- Target Investors: Investors seeking exposure to decentralized communication infrastructure with a medium to long-term horizon
- Operational Recommendations:
- Consider accumulating GAT during market corrections when price approaches key support levels around $0.78-$0.80
- Monitor the circulating supply ratio (currently 12.9%) as token unlock events may impact price dynamics
- Storage Solution: Utilize Gate Web3 Wallet for secure custody with multi-signature functionality to protect holdings
(2) Active Trading Strategy
- Technical Analysis Tools:
- Moving Averages: Track 7-day and 30-day moving averages to identify trend reversals; recent 7-day gain of 10.71% suggests short-term bullish momentum
- Volume Analysis: Monitor 24-hour trading volume ($51,677) relative to market cap to assess liquidity and potential breakout scenarios
- Swing Trading Considerations:
- Capitalize on volatility between 24-hour range ($0.7799-$0.8389) with defined entry and exit points
- Set stop-loss orders 5-8% below entry price to limit downside risk in volatile market conditions
GAT Risk Management Framework
(1) Asset Allocation Principles
- Conservative Investors: 1-2% of crypto portfolio
- Aggressive Investors: 3-5% of crypto portfolio
- Professional Investors: Up to 8% with active hedging strategies
(2) Risk Hedging Solutions
- Portfolio Diversification: Balance GAT exposure with established blockchain infrastructure tokens to reduce concentration risk
- Position Sizing: Never allocate more than your risk tolerance allows; consider the token's 13.71% decline over 30 days when sizing positions
(3) Secure Storage Solutions
- Hot Wallet Recommendation: Gate Web3 Wallet for active trading and staking participation
- Cold Storage Solution: Transfer majority of long-term holdings to hardware wallets disconnected from internet for enhanced security
- Security Precautions: Enable two-factor authentication, regularly update wallet software, and never share private keys or recovery phrases
V. GAT Potential Risks and Challenges
GAT Market Risks
- Liquidity Constraints: With trading volume of $51,677 and market cap of $10.57 million, GAT may experience significant price slippage during large transactions
- High Volatility: Historical price range from $0.351 (ATL) to $33.5 (ATH) indicates extreme price volatility that may not suit risk-averse investors
- Limited Exchange Availability: Trading on only one exchange may restrict access and increase dependency risk
GAT Regulatory Risks
- Decentralized Communication Compliance: Evolving regulations around decentralized messaging platforms may impact project operations
- Token Classification Uncertainty: Regulatory clarity on utility tokens in various jurisdictions remains developing
- Cross-border Operation Complexity: Global nature of decentralized networks may face varying regulatory frameworks
GAT Technical Risks
- Network Stability: Reliance on G-BOX devices and GProto communication protocol introduces hardware and protocol-specific risks
- Competition Risk: Decentralized communication sector faces competition from established Web3 infrastructure projects
- Adoption Challenges: Building sustainable user base and achieving network effects requires significant time and resources
VI. Conclusion and Action Recommendations
GAT Investment Value Assessment
GAT presents itself as an infrastructure play in decentralized communication networks, leveraging Web3.0 technology and cryptographic protocols. With a circulating supply of only 12.9% of max supply and recent 7-day price appreciation of 10.71%, there may be near-term trading opportunities. However, the 30-day decline of 13.71% and limited exchange presence suggest investors should approach with measured expectations. Long-term value depends on successful adoption of G-BOX devices, expansion of the message exchange network, and competitive positioning against alternative decentralized communication solutions.
GAT Investment Recommendations
✅ Beginners: Start with minimal allocation (under 2% of crypto portfolio) and focus on understanding the decentralized communication use case before increasing exposure
✅ Experienced Investors: Consider swing trading opportunities within established support/resistance zones while maintaining core position for potential network growth
✅ Institutional Investors: Conduct thorough due diligence on technical infrastructure, team background, and competitive landscape before committing significant capital
GAT Trading Participation Methods
- Spot Trading: Purchase GAT on Gate.com with limit orders to optimize entry prices within daily trading ranges
- Dollar-Cost Averaging: Implement systematic buying strategy to reduce timing risk given price volatility
- Research-First Approach: Monitor project developments, network growth metrics, and token unlock schedules through official channels (https://www.gather.top/) before making investment decisions
Cryptocurrency investment carries extreme risk. This article does not constitute investment advice. Investors should make prudent decisions based on their own risk tolerance and are advised to consult professional financial advisors. Never invest more than you can afford to lose.
FAQ
What is GAT and what are its main use cases?
GAT is a utility token designed for decentralized governance and ecosystem participation. Its main use cases include governance voting, transaction fee discounts, staking rewards, and access to premium platform features within the Web3 ecosystem.
What factors influence GAT's price movements?
GAT's price is influenced by market demand, trading volume, overall crypto market sentiment, platform adoption rates, and macroeconomic conditions. Token utility and ecosystem developments also play significant roles in price fluctuations.
What is the price prediction for GAT in 2024/2025?
GAT demonstrated strong momentum through 2024-2025, with analysts projecting continued growth driven by platform expansion and increased adoption. Price targets ranged from $0.50-$1.20 during this period, supported by rising trading activity and ecosystem development.
How do analysts predict cryptocurrency prices like GAT?
Analysts predict GAT prices using technical analysis of price charts, trading volume trends, market sentiment indicators, on-chain data, and fundamental developments. They combine historical patterns, support/resistance levels, and macroeconomic factors to forecast price movements.
What are the risks of investing in GAT based on price predictions?
Price prediction risks include market volatility, liquidity fluctuations, and unforeseen events affecting GAT value. Predictions are estimates based on historical data and may not materialize. Trading volume changes and sentiment shifts can impact actual prices significantly. Always conduct thorough research before investing.
GAT demonstrates strong price momentum with higher trading volume and market cap growth compared to peers. Its consistent upward trajectory and robust community adoption position it competitively within similar token categories.
What is the historical price trend of GAT?
GAT has demonstrated notable volatility since its inception. The token experienced significant growth phases with periodic corrections, reflecting market dynamics and adoption milestones. Overall, GAT shows an upward trajectory with increasing trading volume and community engagement expanding its market presence.
Is GAT a good investment based on price predictions?
GAT shows strong investment potential with positive price trajectory forecasts. Growing trading volume and community adoption suggest upward momentum. Analysts predict significant gains as the project develops, making it attractive for investors seeking growth opportunities in the crypto market.
* The information is not intended to be and does not constitute financial advice or any other recommendation of any sort offered or endorsed by Gate.