This comprehensive analysis examines Goldfinch (GFI) token's price trajectory and investment potential through 2031. Currently trading at $0.1865 with extreme market fear (index: 24), GFI faces significant headwinds following its 84.6% annual decline. The article synthesizes historical price patterns, market supply-demand dynamics, and ecosystem developments to project price ranges: $0.15139-$0.20559 in 2026, escalating to $0.20564-$0.45452 by 2031. Key analysis covers GFI's concentrated token distribution (top 5 holders control 48.35%), limited liquidity ($23,631 daily volume), and DeFi protocol adoption drivers. Professional investment strategies incorporate long-term holding, dollar-cost averaging, and secure storage via Gate Web3 Wallet, alongside robust risk management frameworks for conservative, aggressive, and institutional investors navigating this decentralized credit protocol's volatility and regulatory uncertainties.
Introduction: GFI's Market Position and Investment Value
Goldfinch (GFI), as a decentralized credit protocol enabling commercial lending without collateral, has been pioneering innovative DeFi lending solutions since its launch in 2022. As of 2026, GFI maintains a market capitalization of approximately $17.43 million, with a circulating supply of about 93.43 million tokens, and its price holding around $0.1865. This asset, recognized as a "collateral-free credit protocol," is playing an increasingly vital role in expanding cryptocurrency lending to real-world businesses and emerging markets.
This article will comprehensively analyze GFI's price trajectory from 2026 to 2031, combining historical patterns, market supply-demand dynamics, ecosystem development, and macroeconomic conditions to provide investors with professional price forecasts and practical investment strategies.
I. GFI Price History Review and Market Status
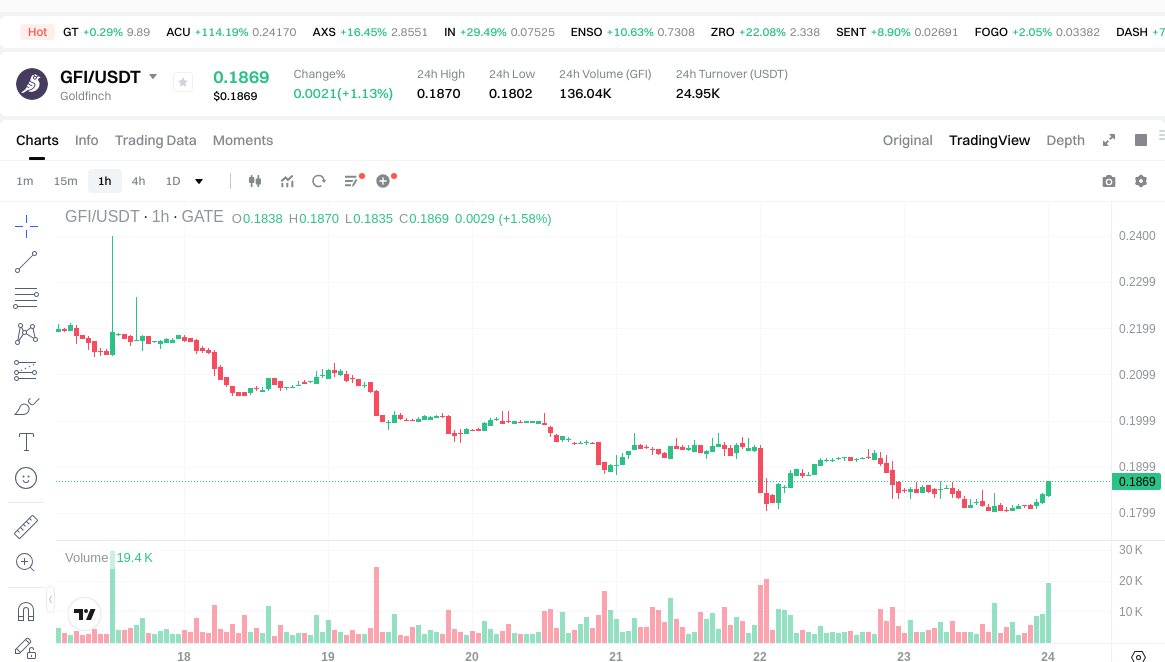
GFI Historical Price Evolution Trajectory
- 2022: Goldfinch (GFI) reached its all-time high on January 12, 2022, with the price climbing to $32.94, marking a significant milestone during the broader cryptocurrency market rally period.
- 2025: The token experienced substantial downward pressure throughout the year, culminating in its all-time low of $0.172749 on December 18, 2025, reflecting challenging market conditions and broader sector headwinds.
- 2025-2026: Following the historical low point, the price has shown some recovery momentum, moving from the December bottom to the current trading level of $0.1865.
GFI Current Market Status
As of January 24, 2026, Goldfinch (GFI) is trading at $0.1865, positioning it at rank #932 in the cryptocurrency market. The token has demonstrated mixed short-term performance, with a 2.03% increase over the past hour and a modest 0.27% gain in the 24-hour period. However, the broader trend indicates continued pressure, with a 15.93% decline over the past week and a 1.29% decrease across the 30-day timeframe.
The market capitalization stands at approximately $17.43 million, with a circulating supply of 93.43 million GFI tokens, representing 81.75% of the maximum supply of 114.29 million tokens. The 24-hour trading volume registers at $23,631.64, suggesting relatively limited liquidity in current market conditions. The fully diluted market cap reaches $21.31 million, with the market cap to FDV ratio at 81.75%, indicating that a substantial portion of the total token supply is already in circulation.
Goldfinch maintains a market dominance of 0.00067%, with the token currently trading significantly below its historical peak, down approximately 99.43% from the all-time high. The current price represents a modest recovery from the December 2025 low point, showing an 8% increase from that level. Market sentiment analysis indicates an extreme fear reading of 24 on the volatility index, reflecting cautious positioning among market participants.
The token has experienced considerable volatility over the past year, with the annual performance showing an 84.6% decline. Despite recent intraday strength, the week-over-week performance decline of nearly 16% suggests ongoing challenges in sustaining upward momentum. Trading activity remains concentrated across 6 exchanges, with approximately 15,963 token holders recorded on-chain.
Click to check the current GFI market price
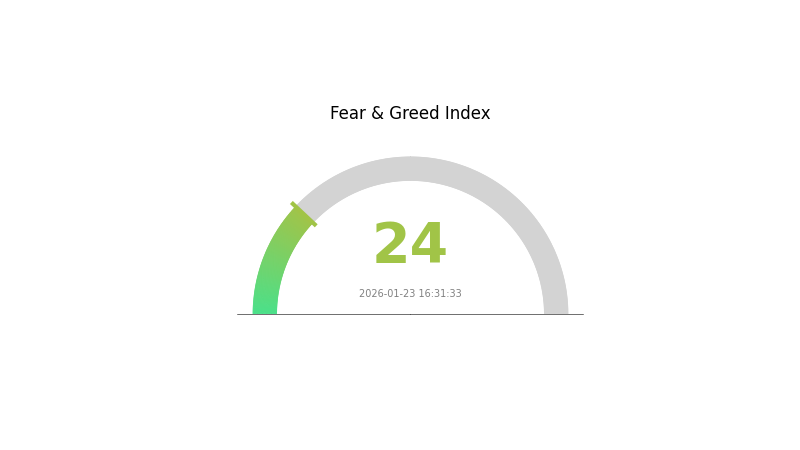
GFI Market Sentiment Index
2026-01-23 Fear and Greed Index: 24 (Extreme Fear)
Click to view current Fear & Greed Index
The cryptocurrency market is currently experiencing extreme fear, with the Fear and Greed Index dropping to 24. This level indicates significant market pessimism and investor anxiety. During extreme fear periods, market volatility typically intensifies as panic selling increases. Experienced traders often view such conditions as potential buying opportunities, as oversold assets may present attractive entry points. However, investors should exercise caution and conduct thorough analysis before making investment decisions, as the market may experience further downside before stabilizing.
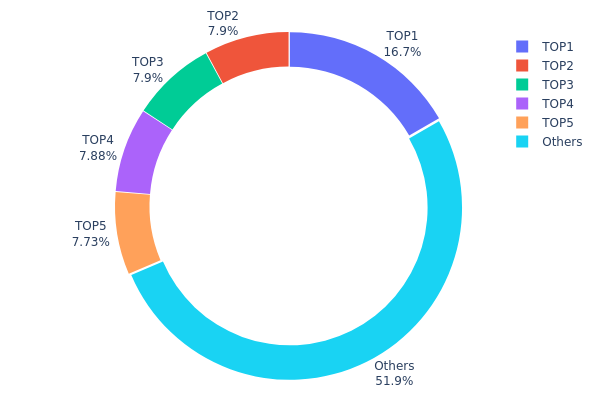
GFI Holding Distribution
The holding distribution chart reflects the concentration of token holdings across different addresses on the blockchain, providing crucial insights into the decentralization level and potential market manipulation risks. By analyzing the distribution pattern, we can assess whether the token is widely dispersed among numerous holders or concentrated in the hands of a few major addresses, which directly impacts market stability and liquidity characteristics.
Based on current data, GFI exhibits a moderate to high concentration pattern. The top address holds approximately 19.04 million tokens, representing 16.66% of the total supply, while the top five addresses collectively control 55.29 million tokens, accounting for 48.35% of the circulating supply. This concentration level indicates that nearly half of GFI tokens are controlled by a small group of major holders. Although the remaining 51.95% is distributed among other addresses, the significant holdings of the top five addresses suggest that these major players possess considerable influence over market price movements.
This concentration structure presents both opportunities and risks for the GFI market. On one hand, major holders may have long-term confidence in the project and could provide price stability support. On the other hand, the concentrated holdings create potential risks for sudden large-scale sell-offs, which could trigger significant price volatility. From a market microstructure perspective, this distribution pattern suggests that GFI's price discovery mechanism may be partially influenced by the trading decisions of major holders, potentially increasing short-term price volatility and making the market more susceptible to coordinated actions by large holders.
Click to view current GFI Holding Distribution
| Top |
Address |
Holding Qty |
Holding (%) |
| 1 |
0xbeb2...a6981f |
19042.95K |
16.66% |
| 2 |
0xac9a...1c2f35 |
9025.53K |
7.89% |
| 3 |
0x930d...88b6b8 |
9025.53K |
7.89% |
| 4 |
0x1dfe...04e165 |
9006.95K |
7.88% |
| 5 |
0x8ac7...71ed70 |
8835.88K |
7.73% |
| - |
Others |
59348.88K |
51.95% |
II. Core Factors Influencing GFI's Future Price
Based on the available information, there is insufficient data to provide a comprehensive analysis of the core factors that may influence GFI's future price trajectory. Without specific details regarding supply mechanisms, institutional dynamics, macroeconomic correlations, or technical developments related to GFI, a meaningful assessment cannot be constructed at this time.
Investors interested in GFI should conduct independent research and monitor official project announcements, on-chain metrics, and broader market conditions to form their own informed perspectives on potential price drivers.
III. 2026-2031 GFI Price Prediction
2026 Outlook
- Conservative estimate: $0.15139 - $0.1869
- Neutral estimate: $0.1869
- Optimistic estimate: $0.20559 (subject to favorable market conditions)
2027-2029 Medium-term Outlook
- Market stage expectation: GFI may enter a gradual growth phase during this period, with price volatility reflecting broader crypto market cycles and project development progress
- Price range predictions:
- 2027: $0.16288 - $0.23942
- 2028: $0.11109 - $0.29189
- 2029: $0.16566 - $0.35936
- Key catalysts: Protocol upgrades, expansion of DeFi ecosystem adoption, institutional participation growth, and overall crypto market sentiment
2030-2031 Long-term Outlook
- Baseline scenario: $0.23033 - $0.45452 (assuming steady ecosystem development and sustained market interest)
- Optimistic scenario: $0.30711 - $0.45452 (contingent upon significant protocol adoption and favorable regulatory environment)
- Transformative scenario: Potential to reach upper boundaries if DeFi sector experiences substantial growth and GFI achieves widespread institutional adoption
- 2026-01-24: GFI trading within the predicted early-year range, establishing foundation for potential multi-year growth trajectory
| Year |
Predicted High Price |
Predicted Average Price |
Predicted Low Price |
Price Change |
| 2026 |
0.20559 |
0.1869 |
0.15139 |
0 |
| 2027 |
0.23942 |
0.19625 |
0.16288 |
5 |
| 2028 |
0.29189 |
0.21783 |
0.11109 |
16 |
| 2029 |
0.35936 |
0.25486 |
0.16566 |
36 |
| 2030 |
0.45452 |
0.30711 |
0.23033 |
64 |
| 2031 |
0.4189 |
0.38082 |
0.20564 |
104 |
IV. GFI Professional Investment Strategies and Risk Management
GFI Investment Methodology
(I) Long-Term Holding Strategy
- Suitable for: Investors who believe in decentralized credit protocols and have a long-term outlook on the DeFi lending sector
- Operational Recommendations:
- Consider accumulating positions during market downturns, particularly when prices approach support levels
- Implement dollar-cost averaging to mitigate timing risk and reduce the impact of short-term volatility
- Storage Solution: Utilize Gate Web3 Wallet for secure self-custody, ensuring private key control and enhanced security
(II) Active Trading Strategy
- Technical Analysis Tools:
- Moving Averages: Monitor 50-day and 200-day moving averages to identify trend direction and potential entry/exit points
- Volume Analysis: Analyze trading volume patterns to confirm price movements and detect potential reversals
- Swing Trading Key Points:
- Set clear stop-loss levels to limit downside risk, typically 5-8% below entry price
- Take profits in stages during upward movements to lock in gains while maintaining exposure
GFI Risk Management Framework
(I) Asset Allocation Principles
- Conservative Investors: 1-3% of crypto portfolio
- Aggressive Investors: 5-10% of crypto portfolio
- Professional Investors: Up to 15% of crypto portfolio with active risk monitoring
(II) Risk Hedging Solutions
- Portfolio Diversification: Combine GFI with stablecoins and established cryptocurrencies to reduce concentration risk
- Position Sizing: Scale positions according to market conditions and personal risk tolerance
(III) Secure Storage Solutions
- Software Wallet Recommendation: Gate Web3 Wallet provides convenient access with robust security features
- Hardware Wallet Solution: For larger holdings, consider transferring to hardware wallets for enhanced offline security
- Security Precautions: Never share private keys, enable two-factor authentication, and regularly verify wallet addresses before transactions
V. GFI Potential Risks and Challenges
GFI Market Risks
- Price Volatility: GFI has experienced a 84.6% decline over the past year, demonstrating high volatility typical of altcoins
- Liquidity Risk: With a 24-hour trading volume of approximately $23,631 and market cap of $17.4 million, liquidity may be limited during market stress
- Market Sentiment: Trading at approximately 99.4% below its all-time high of $32.94, recovery depends on broader market conditions and project developments
GFI Regulatory Risks
- DeFi Lending Regulations: Decentralized credit protocols face evolving regulatory scrutiny regarding uncollateralized lending practices
- Compliance Requirements: Potential changes in regulatory frameworks could impact protocol operations and token utility
- Jurisdictional Uncertainty: Different regions may impose varying requirements on decentralized lending platforms
GFI Technical Risks
- Smart Contract Vulnerabilities: As an Ethereum-based protocol, GFI is subject to smart contract risks that could affect protocol security
- Governance Mechanism: Token holder governance decisions may not always align with individual investor interests
- Protocol Dependency: GFI's value is tied to the adoption and success of the Goldfinch protocol's lending activities
VI. Conclusion and Action Recommendations
GFI Investment Value Assessment
GFI represents a specialized play in the decentralized credit sector, offering governance rights and staking opportunities within the Goldfinch protocol. The token's long-term value proposition depends on the adoption of uncollateralized crypto lending and the protocol's ability to maintain credit quality. However, short-term risks include significant price volatility, limited liquidity, and regulatory uncertainties surrounding DeFi lending. The current circulating supply represents 81.75% of maximum supply, suggesting limited inflationary pressure.
GFI Investment Recommendations
✅ Beginners: Start with small allocations (under 2% of crypto portfolio) and focus on understanding the protocol mechanics before increasing exposure
✅ Experienced Investors: Consider GFI as a tactical allocation within a diversified DeFi portfolio, monitoring protocol metrics and governance developments
✅ Institutional Investors: Conduct thorough due diligence on credit risk management and regulatory compliance before considering strategic positions
GFI Trading Participation Methods
- Spot Trading: Trade GFI on Gate.com and other supported exchanges with 6 trading pairs currently available
- Staking Participation: Stake GFI tokens to participate in protocol auditing and earn potential rewards
- Portfolio Integration: Incorporate GFI as part of a broader DeFi lending sector exposure strategy
Cryptocurrency investment carries extremely high risks, and this article does not constitute investment advice. Investors should make cautious decisions based on their own risk tolerance and are advised to consult professional financial advisors. Never invest more than you can afford to lose.
FAQ
What is the historical price trend of GFI tokens?
GFI tokens have experienced significant volatility since launch. The token saw initial growth during the 2021-2022 bull market, followed by corrections during the broader crypto downturn. Recently, GFI has shown recovery momentum with increasing trading volume and strengthening market sentiment, demonstrating resilience in the Web3 ecosystem.
What are the main factors affecting GFI price?
GFI price is influenced by market demand, trading volume, ecosystem development, protocol updates, DeFi market trends, liquidity conditions, and overall crypto market sentiment.
What is a reasonable price prediction range for GFI in the future?
Based on current market trends and GFI's fundamentals, a reasonable price prediction range for GFI could be $8-15 in the next 12-24 months, depending on market conditions, adoption rates, and overall cryptocurrency market sentiment.
What advantages does GFI have compared to other DeFi governance tokens?
GFI offers superior governance efficiency through optimized voting mechanisms, lower transaction costs via Layer 2 integration, and stronger community engagement. Its unique tokenomics provide better long-term value retention compared to traditional DeFi governance tokens.
What are the main risks of investing in GFI?
GFI investment risks include market volatility, liquidity fluctuations, regulatory changes in crypto sector, and project execution risks. Token price can be significantly affected by market sentiment and macroeconomic factors. Investors should conduct thorough research before participation.
How is GFI's liquidity and trading volume?
GFI maintains strong liquidity with consistent daily trading volume. The token benefits from widespread adoption across multiple platforms, ensuring efficient price discovery and minimal slippage. Growing institutional interest continues to enhance market depth and trading activity.
* The information is not intended to be and does not constitute financial advice or any other recommendation of any sort offered or endorsed by Gate.