This comprehensive analysis examines Moonbeam's GLMR token valuation and investment outlook from 2026 through 2031. Covering market fundamentals including current trading at $0.02277 with $23.72 million market capitalization, the article evaluates price dynamics, ecosystem development, and token supply distribution. Detailed price forecasts across multiple scenarios address investor needs at all experience levels—from beginners to institutional participants. The guide provides practical strategies for long-term holders and active traders, combined with essential risk management frameworks including asset allocation guidelines and security solutions via Gate trading platform. Key sections analyze parachain economics, volatility factors, regulatory considerations, and competitive positioning within the Polkadot ecosystem. Actionable recommendations help investors align GLMR exposure with their risk tolerance while understanding technological dependencies and market correlation risks inherent in blockchain infra
Introduction: GLMR's Market Position and Investment Value
Moonbeam Network (GLMR), as an EVM-compatible blockchain operating as a parachain on the Polkadot network, has been facilitating Ethereum-based application deployment since its launch in 2021. As of 2026, GLMR maintains a market capitalization of approximately $23.72 million, with a circulating supply of around 1.04 billion tokens, and the price hovering at $0.02277. This asset, recognized for its cross-chain interoperability capabilities, is playing an increasingly important role in decentralized finance and smart contract execution.
This article will comprehensively analyze GLMR's price trends from 2026 to 2031, combining historical patterns, market supply and demand dynamics, ecosystem development, and macroeconomic conditions to provide investors with professional price forecasts and practical investment strategies.
I. GLMR Price History Review and Market Status
GLMR Historical Price Evolution Trajectory
- 2022: Moonbeam launched on Polkadot mainnet in January after winning the second parachain slot auction through crowdfunding, with GLMR experiencing significant price movement from its all-time high of $19.5 on January 11, 2022.
- 2022-2025: The token underwent a substantial correction period, declining alongside broader market trends as the cryptocurrency market experienced cyclical downturns.
- 2026: GLMR reached its historical low point of $0.02190599 on January 22, 2026, reflecting continued bearish pressure in the market.
GLMR Current Market Situation
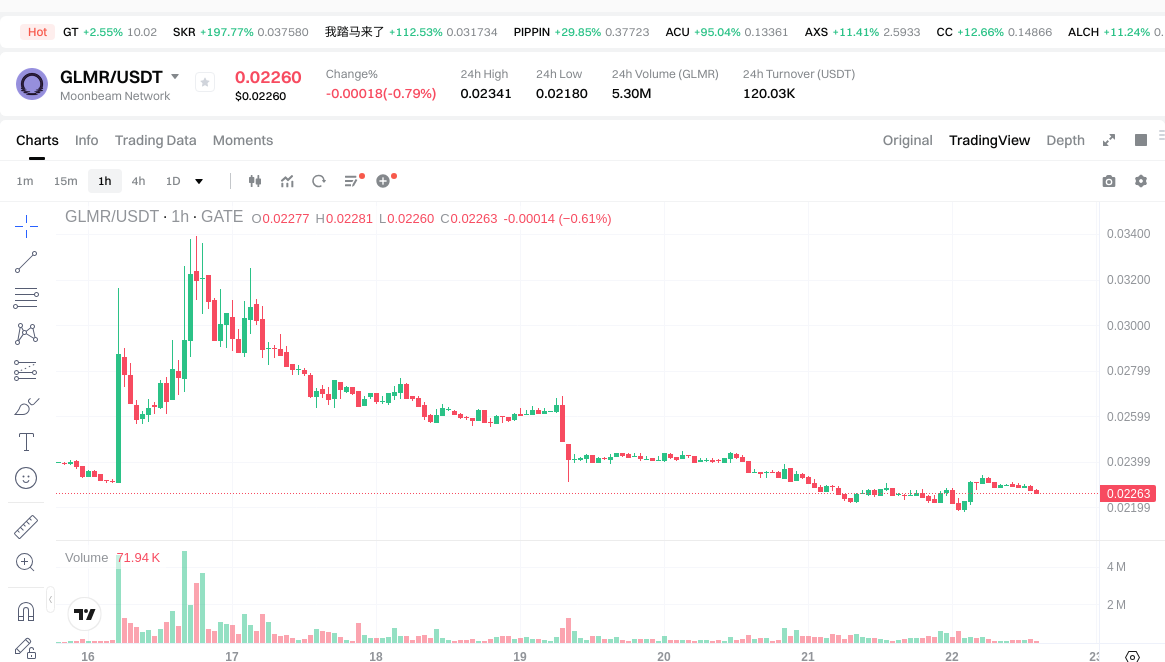
As of January 22, 2026, GLMR is trading at $0.02277, showing minimal price fluctuation with a 24-hour decrease of 0.04%. The token has experienced varied performance across different timeframes, with a 1-hour decline of 0.52%, a 7-day decrease of 4.25%, and a 30-day drop of 2.86%. Over the past year, GLMR has declined by 87.64%.
The 24-hour trading range spans from $0.0218 to $0.02341, with a trading volume of $119,304.33. The token maintains a market capitalization of approximately $23.72 million, ranking 801st in the cryptocurrency market with a market share of 0.00086%. The circulating supply stands at 1,041,568,940 GLMR tokens, representing 85.85% of the total supply of 1,213,204,141 tokens.
The fully diluted market capitalization is approximately $27.62 million, with the market cap to FDV ratio at 85.85%. GLMR has a holder base of approximately 1,802,757 addresses and is listed on 23 exchanges. The current market sentiment indicator shows a reading of 20, reflecting extreme fear in the market.
Click to view current GLMR market price
Market Sentiment Indicator
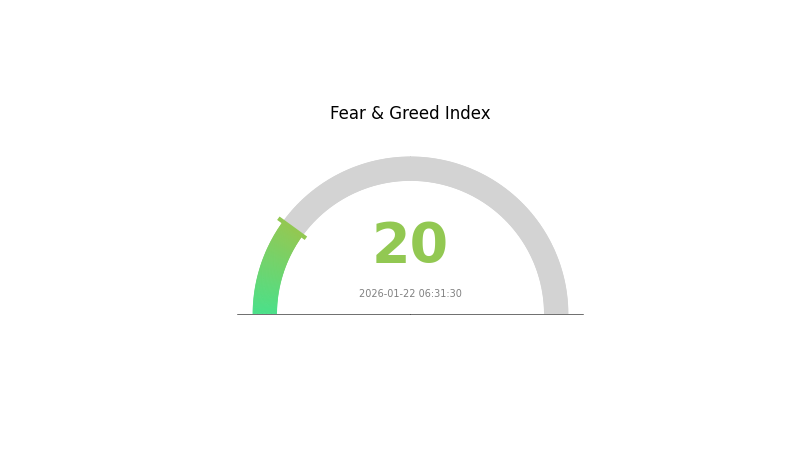
01-22-2026 Fear and Greed Index: 20(Extreme Fear)
Click to view current Fear & Greed Index
The cryptocurrency market is currently experiencing extreme fear, with the Fear and Greed Index at 20. This indicates strong bearish sentiment among investors, suggesting heightened uncertainty and risk aversion in the market. Such extreme fear conditions often present contrarian opportunities for long-term investors, as panic selling may have pushed prices to attractive levels. However, traders should exercise caution and conduct thorough due diligence before making investment decisions. Monitor market developments closely during this volatile period.
GLMR Holding Distribution
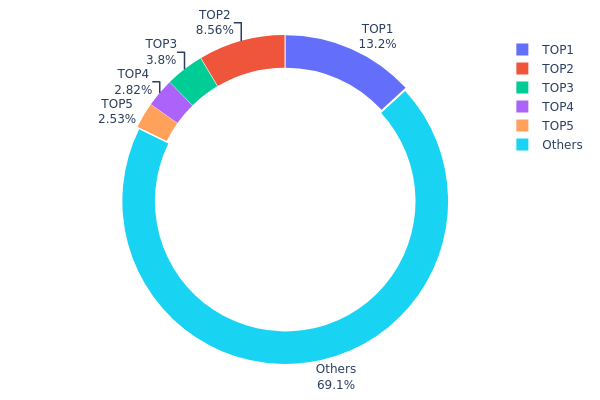
The holding distribution chart reveals the concentration of GLMR tokens across different wallet addresses, providing crucial insights into the market structure and potential centralization risks. According to the latest on-chain data, the top 5 addresses collectively hold approximately 30.87% of the total GLMR supply, with the largest single address controlling 13.17% (159.82 million tokens). This concentration level suggests a moderately centralized distribution pattern, where the remaining 69.13% is distributed among other market participants.
From a market structure perspective, this distribution presents both opportunities and risks. The significant holdings by top addresses, particularly the leading holder with over 13% of supply, could potentially exert considerable influence over price movements through large-scale transactions. However, the fact that nearly 70% remains distributed among the broader market provides a reasonable degree of decentralization, preventing complete control by a small group of entities. The gradual decline in holding percentages from the top address (13.17%) to the fifth-largest (2.52%) demonstrates a relatively balanced concentration gradient.
This current distribution pattern indicates that GLMR maintains acceptable on-chain structural stability while facing moderate concentration risks. Investors should monitor potential movements from these major addresses, as significant transfers could trigger market volatility. The ecosystem's health would benefit from continued efforts to broaden token distribution and enhance decentralization over time.
Click to view current GLMR Holding Distribution
| Top |
Address |
Holding Qty |
Holding (%) |
| 1 |
0xf977...41acec |
159818.15K |
13.17% |
| 2 |
0xf391...ce28ce |
103888.90K |
8.56% |
| 3 |
0x8ebb...6c4c34 |
46150.87K |
3.80% |
| 4 |
0x76ec...78fbd3 |
34239.17K |
2.82% |
| 5 |
0xa557...a556f9 |
30679.05K |
2.52% |
| - |
Others |
838382.77K |
69.13% |
II. Core Factors Influencing GLMR's Future Price
Due to the absence of specific data in the provided materials regarding GLMR's supply mechanisms, institutional dynamics, macroeconomic correlations, and technical developments, a comprehensive analysis of the core factors influencing GLMR's future price cannot be completed at this time. Market participants are advised to conduct their own research and consult multiple information sources before making any investment decisions related to GLMR.
III. 2026-2031 GLMR Price Forecast
2026 Outlook
- Conservative estimate: $0.02017 - $0.02266
- Neutral estimate: $0.02266
- Optimistic estimate: $0.03104 (subject to favorable market conditions)
2027-2029 Mid-term Outlook
- Market stage expectation: Gradual recovery and growth phase, with potential volatility as the cryptocurrency market matures and adoption increases
- Price range forecast:
- 2027: $0.0188 - $0.03034
- 2028: $0.02231 - $0.03918
- 2029: $0.03152 - $0.05049
- Key catalysts: Continued development of the Moonbeam ecosystem, increased cross-chain interoperability adoption, potential partnerships with major DeFi protocols, and broader institutional interest in Polkadot-based projects
2030-2031 Long-term Outlook
- Baseline scenario: $0.03713 - $0.04599 (assuming steady ecosystem growth and sustained market interest)
- Optimistic scenario: $0.04219 - $0.05114 (assuming significant adoption of Moonbeam's EVM compatibility features and strong Polkadot network effects)
- Transformational scenario: Prices potentially exceeding $0.05114 (contingent upon breakthrough technological advancements, major institutional adoption, and favorable regulatory developments in the blockchain space)
| Year |
Predicted High Price |
Predicted Average Price |
Predicted Low Price |
Price Change |
| 2026 |
0.03104 |
0.02266 |
0.02017 |
0 |
| 2027 |
0.03034 |
0.02685 |
0.0188 |
17 |
| 2028 |
0.03918 |
0.0286 |
0.02231 |
25 |
| 2029 |
0.05049 |
0.03389 |
0.03152 |
48 |
| 2030 |
0.04599 |
0.04219 |
0.03713 |
85 |
| 2031 |
0.05114 |
0.04409 |
0.03483 |
93 |
IV. GLMR Professional Investment Strategy and Risk Management
GLMR Investment Methodology
(I) Long-term Holding Strategy
- Suitable for: Investors seeking exposure to Polkadot parachain infrastructure and EVM-compatible blockchain solutions
- Operational Recommendations:
- Consider accumulating positions during market corrections when the price approaches significant support levels
- Monitor network development milestones, ecosystem growth metrics, and parachain slot renewal timelines
- Store assets in secure wallets such as Gate Web3 Wallet for enhanced security and convenient management
(II) Active Trading Strategy
- Technical Analysis Tools:
- Moving Averages: Observe 50-day and 200-day moving averages to identify potential trend reversals and momentum shifts
- Volume Analysis: Monitor 24-hour trading volume ($119,304) relative to historical averages to gauge market interest and liquidity conditions
- Key Considerations for Swing Trading:
- Track price movements within the recent range between $0.0218 and $0.02341 to identify entry and exit opportunities
- Consider correlation with broader Polkadot ecosystem developments and parachain activity levels
GLMR Risk Management Framework
(I) Asset Allocation Principles
- Conservative Investors: 1-3% of crypto portfolio allocation
- Active Investors: 3-7% of crypto portfolio allocation
- Professional Investors: 5-10% of crypto portfolio allocation with hedging strategies
(II) Risk Hedging Solutions
- Portfolio Diversification: Combine GLMR holdings with other Layer 1 tokens and stable positions to reduce concentration risk
- Position Sizing: Implement staged entry strategies to average down cost basis during volatile periods
(III) Secure Storage Solutions
- Hot Wallet Solution: Gate Web3 Wallet for active trading and convenient access to DeFi applications
- Cold Storage Option: Hardware wallet solution for long-term holdings exceeding portfolio allocation thresholds
- Security Precautions: Enable two-factor authentication, maintain backup recovery phrases in secure offline locations, and regularly review wallet permissions for connected applications
V. GLMR Potential Risks and Challenges
GLMR Market Risks
- High Volatility: The token has experienced significant price fluctuations, with a 1-year decline of approximately 87.64%, indicating substantial volatility exposure
- Limited Market Depth: With 24-hour trading volume of approximately $119,304 and market capitalization around $23.7 million, liquidity constraints may impact large position executions
- Correlation Risk: As a Polkadot parachain token, GLMR performance may be influenced by broader Polkadot ecosystem sentiment and DOT price movements
GLMR Regulatory Risks
- Smart Contract Platform Oversight: Evolving regulatory frameworks for blockchain platforms enabling smart contract deployment may impact operational flexibility
- Cross-chain Bridge Regulations: Potential regulatory scrutiny of cross-chain interoperability features and bridge mechanisms connecting to Ethereum and other networks
- Token Classification Uncertainty: Ongoing regulatory developments regarding utility token classifications in various jurisdictions may affect trading accessibility
GLMR Technical Risks
- Parachain Slot Dependency: Continued operation relies on maintaining parachain slot on Polkadot through crowdloan mechanisms or auction participation
- Smart Contract Vulnerabilities: As an EVM-compatible platform, potential security risks from deployed smart contracts may impact network reputation and token value
- Competitive Pressure: Increasing competition from other EVM-compatible chains and Polkadot parachains may dilute market share and developer attention
VI. Conclusion and Action Recommendations
GLMR Investment Value Assessment
GLMR represents exposure to the Polkadot parachain ecosystem with EVM compatibility features. The token's utility includes transaction fee payments, staking participation, governance rights, and liquidity provision incentives. However, the significant price decline over the past year and relatively modest market capitalization suggest investors should approach with caution. Long-term value depends on continued ecosystem development, parachain slot retention, and successful attraction of developers and applications to the Moonbeam platform.
GLMR Investment Recommendations
✅ Beginners: Consider limiting initial exposure to 1-2% of crypto portfolio allocation, focus on understanding Polkadot ecosystem fundamentals before committing significant capital
✅ Experienced Investors: Evaluate GLMR within broader Layer 1 and parachain investment thesis, implement staged entry strategies to manage volatility risk
✅ Institutional Investors: Conduct comprehensive due diligence on parachain economics, network metrics, and competitive positioning before establishing positions
GLMR Trading Participation Methods
- Spot Trading: Access GLMR trading pairs on Gate.com with competitive liquidity and trading conditions
- Staking Participation: Delegate GLMR tokens to validators or operate validator nodes to earn network rewards while supporting consensus
- DeFi Integration: Utilize GLMR in ecosystem DEX platforms and liquidity pools built on Moonbeam blockchain infrastructure
Cryptocurrency investment carries extremely high risk, and this article does not constitute investment advice. Investors should make prudent decisions based on their own risk tolerance and are advised to consult professional financial advisors. Never invest more than you can afford to lose.
FAQ
What is GLMR? What is the purpose of Moonbeam token?
GLMR is the native token of Moonbeam, a Polkadot parachain enabling Ethereum-compatible smart contracts. It's used for transaction fees, governance voting, and collator staking to secure the network.
What is the historical price trend of GLMR? What are the main factors affecting its price fluctuations?
GLMR has experienced volatility since launch, influenced by Moonbeam network developments, DeFi adoption, market sentiment, and broader crypto cycles. Key factors include ecosystem growth, parachain performance, and macro market conditions.
How to predict GLMR price? What technical analysis methods can be referenced?
Analyze GLMR using moving averages, RSI, and MACD indicators. Monitor trading volume trends, support/resistance levels, and market sentiment. Track on-chain metrics and correlation with broader crypto markets for comprehensive price forecasting.
What are the risks of investing in GLMR and what should I pay attention to?
GLMR, as a cryptocurrency asset, carries market volatility risk. Price fluctuations can be significant due to market conditions and sentiment shifts. Ensure you only invest what you can afford to lose, conduct thorough research before investing, and maintain a diversified portfolio strategy.
What are the differences between GLMR and other Layer 2 solution tokens such as Arbitrum and Optimism?
GLMR powers Moonbeam, a Polkadot parachain offering Ethereum compatibility with faster finality. Unlike Arbitrum and Optimism which are Ethereum Layer 2s, GLMR provides cross-chain interoperability and lower transaction costs through Polkadot's architecture, enabling unique DeFi and multi-chain applications.
What are GLMR's circulating supply, total supply, and inflation rate?
GLMR has a circulating supply of approximately 1.4 billion tokens with a total supply capped at 3 billion. The inflation rate decreases over time through a deflationary mechanism, with annual emissions reducing as the network matures, creating long-term scarcity.
* The information is not intended to be and does not constitute financial advice or any other recommendation of any sort offered or endorsed by Gate.