This comprehensive analysis examines GraphLinq Protocol (GLQ), a blockchain automation solution currently trading at $0.006235 with a $2.12 million market cap. The article provides detailed price analysis across 2026-2031, incorporating historical trends, supply-demand dynamics, and ecosystem developments to guide investment decisions. Core sections cover GLQ's market position, influencing factors including macroeconomic conditions and technology advancement, and multi-year price projections ranging from $0.00511 to $0.01178. The guide presents professional investment methodologies for different investor types, including long-term holding and active trading strategies with specific entry/exit points on Gate exchange. Risk management frameworks address market volatility, liquidity constraints, and regulatory challenges facing this micro-cap DeFi protocol, concluding with actionable recommendations tailored to beginner, experienced, and institutional investors seeking exposure to blockchain automation opportuni
Introduction: GLQ's Market Position and Investment Value
GraphLinq Protocol (GLQ), positioned as a blockchain automation solution for decentralized DeFi data monitoring and execution across multiple chains, has been developing its ecosystem since its launch in 2021. As of 2026, GLQ maintains a market capitalization of approximately $2.12 million with a circulating supply of around 340 million tokens, trading at approximately $0.006235. This asset, designed to bridge blockchain networks with external systems without requiring coding skills, is playing an increasingly notable role in the automation and integration space within the decentralized finance sector.
This article will comprehensively analyze GLQ's price trends from 2026 to 2031, incorporating historical patterns, market supply and demand dynamics, ecosystem developments, and macroeconomic factors to provide investors with professional price forecasts and practical investment strategies.
I. GLQ Price History Review and Market Status
GLQ Historical Price Evolution Trajectory
- 2021: GLQ launched in March with an initial price of $0.041159, establishing its presence in the blockchain automation sector
- 2022: Market downturn period saw GLQ reach its historical low of $0.00118009 on June 19, reflecting broader crypto market corrections
- 2024: Network developments and ecosystem growth drove price to reach an all-time high of $0.19361 on March 18, representing growth from its lowest point
- 2025-2026: Price experienced consolidation phase, with notable volatility as the token adjusted to market conditions
GLQ Current Market Status
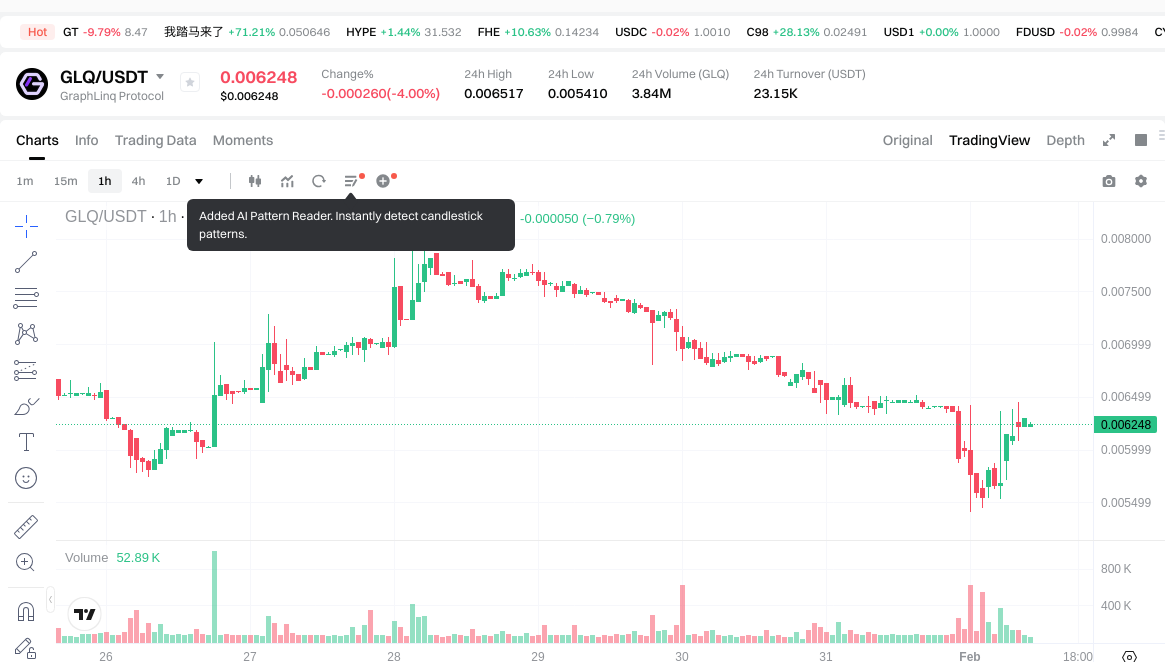
As of February 1, 2026, GLQ is trading at $0.006235, showing a slight decline of 2.09% over the past 24 hours. The token has experienced a modest hourly increase of 0.51%, while demonstrating a 5.58% decrease over the weekly timeframe. However, the monthly performance shows positive momentum with a 24.31% gain over the past 30 days.
The 24-hour trading range has fluctuated between $0.00541 and $0.006517, with a total trading volume of $23,146.40. GLQ currently ranks #2017 in the cryptocurrency market with a circulating market capitalization of approximately $2.12 million, based on 340 million tokens in circulation out of a maximum supply of 500 million tokens. The circulating supply represents 68% of the total supply, with a fully diluted market cap of approximately $3.12 million.
The token holder base has grown to 10,714 addresses, indicating sustained community engagement. GLQ maintains a market dominance of 0.00011% and is available for trading on 3 exchanges, with Gate.com being a primary trading venue. The current Fear & Greed Index stands at 14, suggesting an "Extreme Fear" sentiment in the broader cryptocurrency market.
Click to view current GLQ market price
GLQ Market Sentiment Index
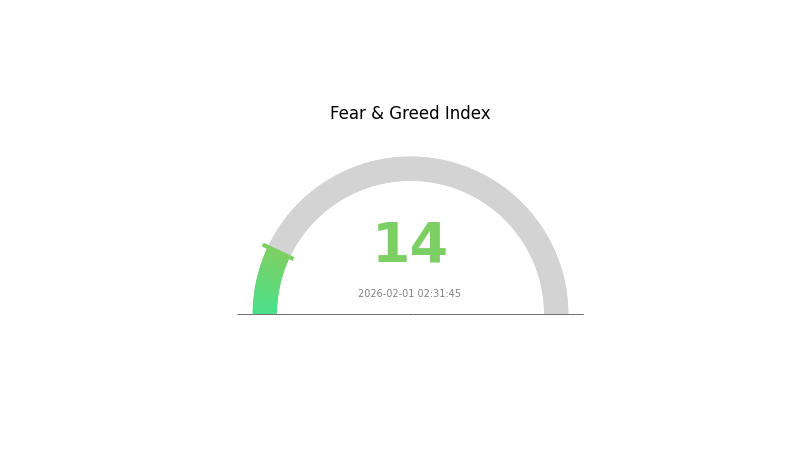
2026-02-01 Fear and Greed Index: 14(Extreme Fear)
Click to view current Fear & Greed Index
The cryptocurrency market is currently experiencing extreme fear, with the Fear and Greed Index at 14. This exceptionally low reading indicates widespread pessimism and risk aversion among investors. Market participants are exhibiting heightened anxiety about price movements and potential downside risks. Such extreme fear conditions often present contrarian opportunities for long-term investors, as panic selling may create attractive entry points. However, traders should exercise caution and maintain disciplined risk management strategies during this volatile period. Monitor market developments closely before making investment decisions.
GLQ Holding Distribution
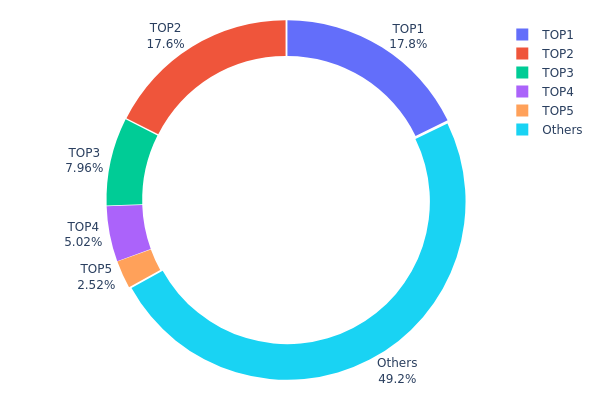
The holding distribution chart illustrates the concentration of token ownership across different wallet addresses, revealing the degree of token centralization within the ecosystem. Based on the current data, the top five addresses collectively hold approximately 50.8% of the total GLQ supply, indicating a moderately high concentration level. Specifically, the largest holder controls 17.77% (88.85M tokens), while the second-largest address holds 17.56% (87.83M tokens). The third through fifth positions account for 7.95%, 5.01%, and 2.51% respectively. The remaining 49.2% of tokens are distributed among other addresses, suggesting a relatively balanced distribution outside the major holders.
This concentration pattern presents both opportunities and risks for GLQ's market structure. On one hand, the presence of large holders may indicate strong institutional confidence or strategic reserves for ecosystem development. On the other hand, such concentration could potentially amplify price volatility, as significant movements by these major addresses might trigger substantial market reactions. The relatively even distribution between the top two holders (17.77% and 17.56%) suggests a degree of balance among major stakeholders, which may help mitigate single-entity manipulation risks.
From a decentralization perspective, GLQ demonstrates a moderate level of token distribution. While nearly half of the supply remains concentrated in the top five addresses, the substantial 49.2% held by other participants indicates meaningful community participation. This balance suggests a developing ecosystem that has not yet achieved full decentralization but maintains sufficient distribution to support organic market dynamics and reduce centralization risks inherent in early-stage projects.
Click to view current GLQ Holding Distribution
| Top |
Address |
Holding Qty |
Holding (%) |
| 1 |
0xd482...a02264 |
88850.46K |
17.77% |
| 2 |
0x379d...cc82ca |
87831.76K |
17.56% |
| 3 |
0xc388...27317c |
39793.44K |
7.95% |
| 4 |
0x0d07...b492fe |
25096.07K |
5.01% |
| 5 |
0x40ec...5bbbdf |
12592.12K |
2.51% |
| - |
Others |
245836.11K |
49.2% |
II. Core Factors Influencing GLQ's Future Price
Supply Mechanism
-
Market Demand and Adoption Trends: GLQ's price trajectory is fundamentally shaped by the level of market demand and the pace at which the protocol gains adoption across blockchain automation use cases. As more developers and enterprises integrate GraphLinq's no-code infrastructure for creating automated workflows, the utility demand for GLQ tokens tends to increase, potentially supporting price appreciation.
-
Historical Patterns: Traditional economic indicators such as interest rates, inflation levels, and GDP performance have historically influenced asset allocation decisions. During periods of economic uncertainty or currency depreciation, investors have occasionally shifted toward alternative digital assets, which can indirectly affect demand dynamics for tokens like GLQ.
-
Current Impact: The current supply-demand balance for GLQ is influenced by ongoing adoption trends and the broader macroeconomic environment. While specific supply adjustment mechanisms were not detailed in the provided materials, market sentiment and speculative activity continue to play a role in short-term price movements.
Institutional and Major Holder Dynamics
-
Institutional Involvement: Institutional interest in GLQ remains a critical factor in shaping its price outlook. The degree to which institutional investors allocate capital to GLQ, whether through direct holdings or participation in related infrastructure projects, can significantly impact liquidity and price stability.
-
Enterprise Adoption: The integration of GraphLinq Protocol by companies seeking to automate blockchain-based processes represents a potential driver of sustained demand. However, specific names of enterprises currently utilizing GLQ were not disclosed in the reference materials.
-
Regulatory Environment: Regulatory changes at the national and international levels can have profound effects on GLQ's accessibility and investor confidence. Policy shifts related to digital asset classification, taxation, and compliance requirements may influence both institutional participation and retail sentiment.
Macroeconomic Environment
-
Monetary Policy Influence: Central bank policies, particularly those related to interest rates and quantitative measures, play an indirect role in shaping risk appetite for digital assets. In environments where traditional safe-haven assets face pressure due to inflation or policy tightening, alternative assets may experience increased attention.
-
Inflation Hedge Characteristics: While digital assets are sometimes viewed as potential hedges against inflation, the correlation is not absolute and varies based on broader market conditions. GLQ's performance in inflationary environments depends on investor perceptions and the relative attractiveness of the protocol's use cases.
-
Geopolitical Factors: International tensions, trade policies, and cross-border financial regulations can influence capital flows into digital assets. Market participants may adjust their exposure to GLQ based on perceptions of geopolitical risk and the stability of traditional financial systems.
Technological Development and Ecosystem Growth
-
Protocol Enhancements: Ongoing technological advancements within the GraphLinq ecosystem, such as improvements to automation tools, scalability upgrades, and integration with additional blockchain networks, have the potential to enhance the protocol's value proposition and drive user adoption.
-
Ecosystem Applications: The development and success of decentralized applications (DApps) and projects built on or integrated with GraphLinq Protocol contribute to the overall utility and demand for GLQ tokens. A growing ecosystem of use cases can support long-term price fundamentals.
-
Market Sentiment and Speculation: Beyond fundamental factors, market psychology and speculative trading behavior remain influential. Sentiment-driven price discovery, particularly in response to news events, partnerships, or broader crypto market trends, can lead to volatility in GLQ's valuation.
III. 2026-2031 GLQ Price Prediction
2026 Outlook
- Conservative forecast: $0.00511 - $0.00624
- Neutral forecast: $0.00624
- Optimistic forecast: $0.00717 (requiring favorable market conditions)
2027-2029 Outlook
- Market stage expectation: Gradual recovery and consolidation phase with potential moderate growth
- Price range forecast:
- 2027: $0.00543 - $0.00697
- 2028: $0.00356 - $0.00793
- 2029: $0.00672 - $0.01004
- Key catalysts: Market sentiment improvement, potential ecosystem development, and broader crypto market trends
2030-2031 Long-term Outlook
- Baseline scenario: $0.00662 - $0.00985 (assuming steady market conditions)
- Optimistic scenario: $0.00798 - $0.01178 (assuming enhanced adoption and positive market dynamics)
- Transformative scenario: Potential to reach upper range targets (under exceptionally favorable conditions including widespread adoption and strong market momentum)
- 2026-02-01: GLQ trading within initial predicted range of $0.00511 - $0.00717 (early stage assessment)
| Year |
Predicted High Price |
Predicted Average Price |
Predicted Low Price |
Price Change |
| 2026 |
0.00717 |
0.00624 |
0.00511 |
0 |
| 2027 |
0.00697 |
0.0067 |
0.00543 |
7 |
| 2028 |
0.00793 |
0.00684 |
0.00356 |
9 |
| 2029 |
0.01004 |
0.00738 |
0.00672 |
18 |
| 2030 |
0.00985 |
0.00871 |
0.00662 |
39 |
| 2031 |
0.01178 |
0.00928 |
0.00798 |
48 |
IV. GLQ Professional Investment Strategy and Risk Management
GLQ Investment Methodology
(1) Long-term Holding Strategy
- Suitable for: Investors who believe in the long-term value proposition of blockchain automation and DeFi data monitoring solutions
- Operational Recommendations:
- Consider accumulating GLQ tokens during market corrections when the price approaches support levels around $0.0054
- Monitor the project's development progress and ecosystem expansion to assess long-term viability
- Storage Solution: Utilize Gate Web3 Wallet for secure storage with multi-signature capabilities and regular security audits
(2) Active Trading Strategy
- Technical Analysis Tools:
- Moving Averages: Track 50-day and 200-day moving averages to identify trend reversals and momentum shifts
- Volume Analysis: Monitor trading volume patterns, noting the current 24-hour volume of $23,146 to identify potential breakout opportunities
- Swing Trading Key Points:
- Consider entry points when GLQ tests the 24-hour low range around $0.0054 with increased volume
- Set profit targets near resistance levels, with the 24-hour high at $0.0065 serving as a near-term reference
GLQ Risk Management Framework
(1) Asset Allocation Principles
- Conservative Investors: 1-2% of crypto portfolio allocation
- Aggressive Investors: 3-5% of crypto portfolio allocation
- Professional Investors: 5-8% of crypto portfolio allocation with active risk monitoring
(2) Risk Hedging Solutions
- Portfolio Diversification: Combine GLQ with established cryptocurrencies and stablecoins to reduce volatility exposure
- Position Sizing: Implement dollar-cost averaging to mitigate timing risk and reduce the impact of price volatility
(3) Secure Storage Solutions
- Hot Wallet Recommendation: Gate Web3 Wallet for active trading and quick access to liquidity
- Cold Storage Solution: For long-term holdings exceeding $1,000, consider hardware wallet solutions with offline private key storage
- Security Precautions: Enable two-factor authentication, never share private keys, regularly update wallet software, and verify contract addresses (0x9f9c8ec3534c3ce16f928381372bfbfbfb9f4d24) before transactions
V. GLQ Potential Risks and Challenges
GLQ Market Risks
- Price Volatility: GLQ has experienced significant price fluctuations, declining 86.74% over the past year, indicating high volatility and potential for substantial losses
- Limited Liquidity: With a 24-hour trading volume of $23,146 and circulation on only 3 exchanges, GLQ may face liquidity constraints during market stress
- Market Cap Concentration: With a market capitalization of approximately $2.12 million and ranking at 2017, GLQ represents a micro-cap asset with elevated risk of manipulation
GLQ Regulatory Risks
- DeFi Compliance Evolution: As global regulators develop frameworks for DeFi protocols, automation platforms like GraphLinq may face new compliance requirements
- Token Classification Uncertainty: Regulatory bodies may classify GLQ differently across jurisdictions, potentially affecting accessibility and trading
- Cross-Chain Regulatory Complexity: Multi-chain operations may create regulatory challenges across different blockchain ecosystems
GLQ Technical Risks
- Smart Contract Vulnerabilities: As an ERC-20 token with automation functionality, GLQ faces potential security risks from smart contract exploits
- Dependency on Ethereum Network: GLQ's reliance on Ethereum exposes it to network congestion, high gas fees, and potential protocol changes
- Adoption Risk: With approximately 10,714 holders, the project faces challenges in achieving broader adoption and network effects
VI. Conclusion and Action Recommendations
GLQ Investment Value Assessment
GraphLinq Protocol (GLQ) presents an interesting value proposition in the blockchain automation and DeFi data monitoring space. The project aims to democratize blockchain integration without coding requirements, addressing a genuine market need. However, the token's performance over the past year, with an 86.74% decline, reflects significant challenges and market skepticism. The current price of $0.006235 represents a substantial discount from its high of $0.19361 in March 2024, potentially offering value for risk-tolerant investors who believe in long-term recovery. The limited liquidity, small market cap, and circulation on only 3 exchanges present considerable risks. While the 30-day performance shows a 24.31% gain, suggesting some renewed interest, investors should approach with caution given the micro-cap nature and high volatility profile.
GLQ Investment Recommendations
✅ Beginners: Avoid or allocate no more than 0.5% of crypto portfolio. Focus on learning about blockchain automation concepts before committing capital. Consider paper trading to understand GLQ's price patterns without risking funds.
✅ Experienced Investors: Consider speculative allocation of 1-3% for diversification into automation protocols. Implement strict stop-loss orders and monitor project development milestones. Employ dollar-cost averaging to reduce timing risk.
✅ Institutional Investors: Conduct thorough due diligence on GraphLinq's technology stack and competitive positioning. Consider small exploratory positions (0.5-1% of crypto allocation) with quarterly performance reviews and clear exit criteria.
GLQ Trading Participation Methods
- Spot Trading: Purchase GLQ on Gate.com through spot markets, providing direct token ownership and full control over holdings
- Limit Orders: Utilize limit orders to enter positions at predetermined price levels, particularly near support zones around $0.0054
- Portfolio Integration: Incorporate GLQ as part of a broader DeFi protocol investment thesis, balancing with more established projects
Cryptocurrency investment carries extremely high risks, and this article does not constitute investment advice. Investors should make cautious decisions based on their own risk tolerance and are advised to consult professional financial advisors. Never invest more than you can afford to lose.
FAQ
What is the current price of GLQ token? What are the historical high and low prices?
GLQ's current price fluctuates in real-time. Historical all-time high is $0.196299. The token has experienced significant price variations since launch, with current levels substantially below previous peaks.
What price might GLQ reach within the next 12 months? What are the main factors affecting the price?
GLQ price prediction within 12 months depends on key factors: macroeconomic environment, Federal Reserve monetary policy shifts, inflation hedge properties, market adoption, and overall crypto market sentiment. Potential price appreciation could occur if broader market conditions remain favorable.
What is the fundamentals of Glitch Protocol project? How are its technology and team strength?
Glitch Protocol features advanced technology with an experienced developer team focused on efficient and innovative solutions. The team demonstrates strong technical capabilities and solid foundational strength in the Web3 ecosystem.
What are GLQ's advantages compared to similar tokens like Solana and Polygon?
GLQ offers superior scalability with faster transaction speeds, lower fees, and enhanced privacy features. Its unique consensus mechanism ensures better energy efficiency and network security, positioning it as a next-generation blockchain solution outperforming traditional layer-1 platforms.
What are the main risks and opportunities for investing in GLQ tokens?
Main risks include price volatility and potential investment losses. Key opportunities lie in high return potential and market growth as the ecosystem expands. GLQ offers exposure to emerging Web3 opportunities with significant upside for early adopters.
What are GLQ's circulating supply and total supply? Is the token economic model healthy?
GLQ's circulating and total supply figures lack public transparency. The token's economic model cannot be definitively assessed due to insufficient disclosed data. Investors should seek comprehensive supply and emission schedules from official sources.
What are professional analysts' predictions for GLQ price? How is the trading volume on major exchanges?
Professional analysts predict GLQ price will rise significantly. Trading volume across major platforms continues to grow steadily, reflecting increased market interest and strong momentum in GLQ trading activity.
* The information is not intended to be and does not constitute financial advice or any other recommendation of any sort offered or endorsed by Gate.