This comprehensive analysis examines Gains Network (GNS), a decentralized leverage trading protocol with a current market cap of $24.39 million and price near $0.93. The article reviews GNS's historical performance from its 2021 launch through January 2026, when the token faces extreme fear sentiment despite supporting leveraged trading across 45+ cryptocurrencies. Through detailed market analysis, the guide provides multi-scenario price forecasts spanning 2026-2031, ranging from conservative to transformative scenarios. Key investment strategies include long-term holding for value investors and active trading techniques using technical indicators, complemented by risk management frameworks across asset allocation and secure storage solutions via Gate. The analysis addresses critical factors including token concentration risks, regulatory challenges in DeFi leverage trading, and competitive dynamics, offering tailored recommendations for beginners, experienced investors, and institutional participants seeking
Introduction: GNS Market Position and Investment Value
Gains Network (GNS), as a decentralized leverage trading protocol, has been facilitating advanced trading capabilities since its launch in 2022. As of January 2026, GNS holds a market capitalization of approximately $24.39 million, with a circulating supply of around 26.20 million tokens, and its price maintains at approximately $0.93. This asset, known for its innovative leverage trading features, is playing an increasingly vital role in the decentralized finance (DeFi) trading ecosystem, supporting leveraged trading across 45+ cryptocurrencies, 20+ stocks, and 10 forex pairs with varying leverage ratios.
This article will comprehensively analyze the price trends of GNS from 2026 to 2031, combining historical patterns, market supply and demand dynamics, ecosystem developments, and macroeconomic factors to provide investors with professional price forecasts and practical investment strategies.
I. GNS Price History Review and Market Status
GNS Historical Price Evolution Trajectory
- 2021: The token launched and experienced early-stage price discovery, with the price reaching a historical low of $0.265841 on November 29, 2021.
- 2023: The project gained market attention and reached a significant milestone, with the price climbing to a historical high of $12.48 on February 17, 2023.
- 2024-2026: The market entered an adjustment phase, with the price declining from previous peaks and undergoing considerable volatility.
GNS Current Market Situation
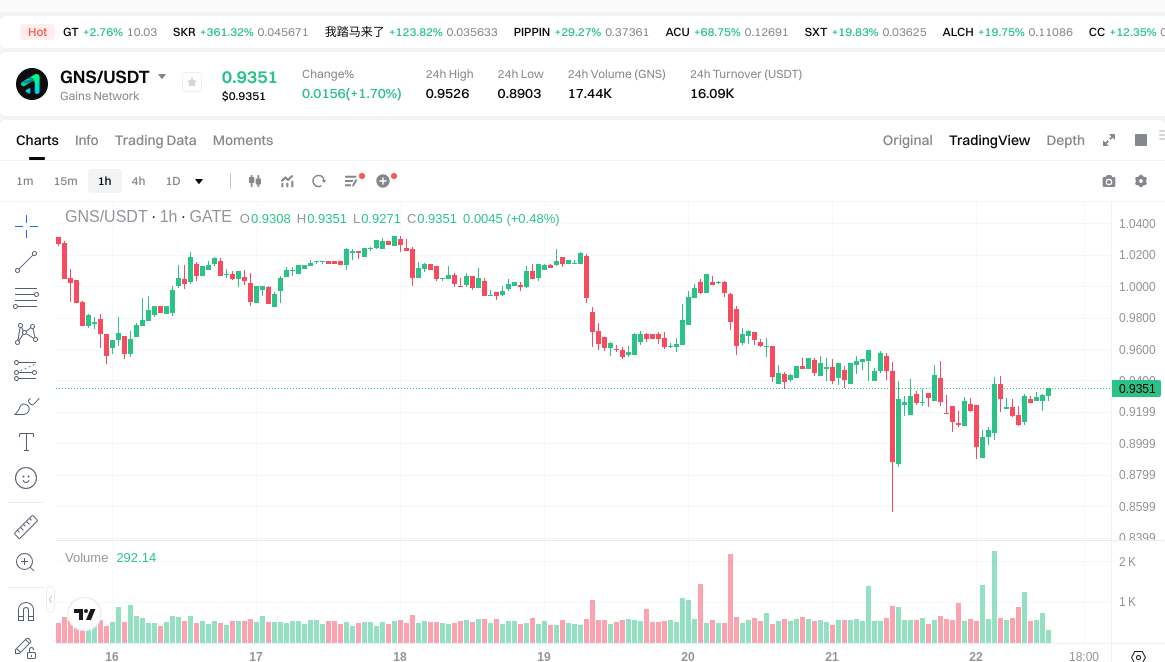
As of January 22, 2026, GNS is trading at $0.9311, representing a 24-hour increase of 1.29%. The intraday price range spans from a low of $0.8903 to a high of $0.9526, reflecting moderate short-term volatility. Over the past hour, the token has shown positive momentum with a 0.64% uptick.
The 24-hour trading volume stands at approximately $16,112.79, while the total market capitalization is recorded at $24,390,766.92, positioning GNS at rank 790 in the cryptocurrency market with a 0.00076% market dominance. The circulating supply consists of 26,195,647 tokens, representing 86.48% of the total supply, with no maximum supply limit defined.
Broader timeframe analysis reveals notable price pressure, with the token declining 10.93% over the past week, 28.13% over the past month, and 37.73% over the past year. The current price represents a substantial decrease from its all-time high of $12.48, while remaining considerably above its all-time low of $0.265841.
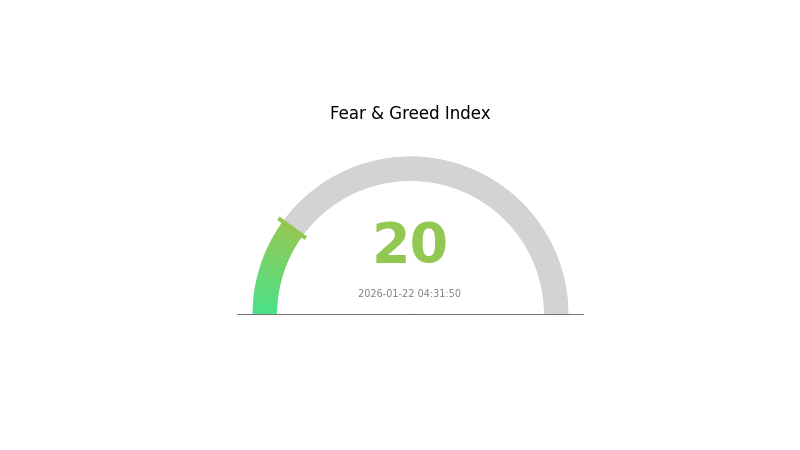
The market sentiment indicator shows a reading of 20, classified as "Extreme Fear," suggesting heightened caution among market participants. The token maintains trading availability on 14 exchanges and has attracted 20,838 holders. GNS is deployed on multiple blockchain networks, including Polygon and Arbitrum, with verified contract addresses on both chains.
Click to view the current GNS market price
GNS Market Sentiment Index
2026-01-22 Fear and Greed Index: 20 (Extreme Fear)
Click to view current Fear & Greed Index
The cryptocurrency market is currently experiencing extreme fear, with the Fear and Greed Index standing at 20. This indicates a significant downturn in market sentiment, driven by negative factors such as regulatory concerns, macroeconomic headwinds, or sharp price declines. During periods of extreme fear, seasoned investors often view this as a buying opportunity, as assets may be oversold. However, retail investors should exercise caution and conduct thorough research before entering positions. Historical data suggests that extreme fear levels can precede market recovery, but timing the bottom remains challenging.
GNS Token Distribution
The token distribution analysis of GNS reveals a significant concentration pattern among top holders. Currently, the top 5 addresses collectively control approximately 64.26% of the total supply, with the largest holder alone accounting for 30.30% of all tokens. This high concentration level, particularly with three addresses holding over 10% each, indicates a centralized ownership structure that warrants careful consideration.
Such concentrated holdings can have profound implications for market dynamics. The substantial positions held by top addresses create potential vulnerability to large-scale movements or coordinated actions. When major holders decide to adjust their positions, even minor percentage changes could translate into significant market impacts given the absolute volume involved. This concentration also suggests that price discovery may be influenced by a relatively small group of participants rather than reflecting broader market consensus.
From a structural perspective, the 35.74% held by "Others" provides some degree of distribution, yet the dominance of top holders suggests that GNS operates within a relatively centralized token economy. This structure may offer stability when major holders maintain their positions but could also introduce heightened volatility risks should any significant redistribution occur. The current distribution pattern reflects an ecosystem where governance influence and market control remain concentrated among a limited number of addresses.
Click to view current GNS Holdings Distribution
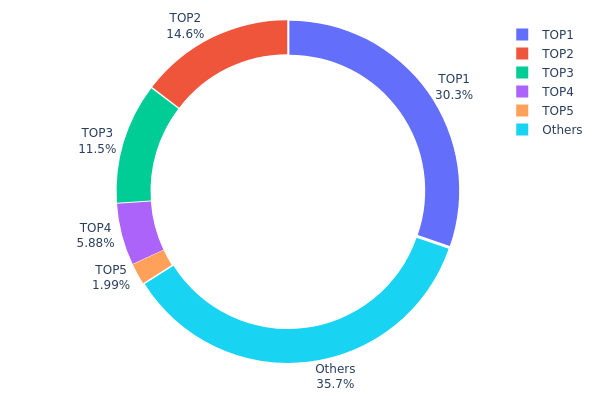
| Top |
Address |
Holding Qty |
Holding (%) |
| 1 |
0xf977...41acec |
1455.77K |
30.30% |
| 2 |
0x5a52...70efcb |
703.36K |
14.64% |
| 3 |
0x8c74...e2beca |
550.82K |
11.46% |
| 4 |
0x98ad...8bba9d |
282.39K |
5.87% |
| 5 |
0x0639...70d206 |
95.81K |
1.99% |
| - |
Others |
1715.39K |
35.74% |
II. Core Factors Influencing GNS Future Price
Based on the available materials, there is insufficient data to provide a comprehensive analysis of the core factors that may influence GNS's future price. Key information regarding supply mechanisms, institutional dynamics, macroeconomic environment impacts, and technical developments is not available in the provided resources.
For investors interested in GNS, it is recommended to conduct independent research through official project channels and consult multiple data sources before making any investment decisions. Market participants should monitor official announcements, on-chain data, and broader market trends to better understand potential price drivers.
For more information about trading digital assets, visit Gate.com.
III. 2026-2031 GNS Price Forecast
2026 Outlook
- Conservative Forecast: $0.879 - $0.935
- Neutral Forecast: $0.935 - $1.001
- Optimistic Forecast: $1.001 (contingent on sustained trading volume and platform adoption)
2027-2029 Outlook
- Market Phase Expectation: The token may enter a gradual growth phase as the DeFi derivatives sector matures and user adoption potentially expands.
- Price Range Forecast:
- 2027: $0.542 - $1.403
- 2028: $1.091 - $1.612
- 2029: $0.965 - $1.455
- Key Catalysts: Platform development progress, derivatives trading market expansion, and broader cryptocurrency market sentiment could influence price movements.
2030-2031 Long-Term Outlook
- Baseline Scenario: $0.942 - $1.427 (assuming steady ecosystem development and moderate market conditions)
- Optimistic Scenario: $1.427 - $1.912 (contingent on significant protocol upgrades and increased institutional participation)
- Transformative Scenario: $1.912 - $2.337 (dependent on substantial market share gains and favorable regulatory developments)
- January 22, 2026: GNS trading near $0.935 (reflecting current market positioning)
| Year |
Predicted High Price |
Predicted Average Price |
Predicted Low Price |
Price Change |
| 2026 |
1.00056 |
0.9351 |
0.87899 |
0 |
| 2027 |
1.40335 |
0.96783 |
0.54198 |
3 |
| 2028 |
1.6124 |
1.18559 |
1.09074 |
27 |
| 2029 |
1.45496 |
1.399 |
0.96531 |
50 |
| 2030 |
1.91215 |
1.42698 |
0.9418 |
53 |
| 2031 |
2.33739 |
1.66956 |
1.10191 |
79 |
IV. GNS Professional Investment Strategy and Risk Management
GNS Investment Methodology
(1) Long-term Holding Strategy
- Suitable for: Value investors who believe in the future of decentralized leverage trading protocols
- Operational Recommendations:
- Consider allocating a portion of portfolio to GNS for long-term holding, based on thorough research of Gains Network's platform development and trading volume growth
- Monitor key metrics such as protocol trading volume, total value locked, and platform user adoption rates
- Storage Solution: Use Gate Web3 Wallet for secure storage, enabling multi-signature features and regular security audits of wallet access
(2) Active Trading Strategy
- Technical Analysis Tools:
- Moving Averages: Apply 50-day and 200-day moving averages to identify potential trend reversals and momentum shifts
- Relative Strength Index (RSI): Monitor RSI levels to identify overbought (above 70) or oversold (below 30) conditions for potential entry points
- Key Points for Swing Trading:
- Pay attention to GNS's high volatility, as evidenced by 24-hour price fluctuations between $0.8903 and $0.9526
- Consider setting stop-loss orders to manage downside risk, particularly given recent 30-day decline of 28.13%
GNS Risk Management Framework
(1) Asset Allocation Principles
- Conservative Investors: 1-3% of crypto portfolio allocation
- Aggressive Investors: 5-10% of crypto portfolio allocation
- Professional Investors: May consider up to 15% allocation based on comprehensive risk assessment
(2) Risk Hedging Solutions
- Diversification Strategy: Combine GNS holdings with stablecoins and established cryptocurrencies to balance portfolio volatility
- Position Sizing: Implement gradual accumulation strategy rather than lump-sum investment to mitigate timing risk
(3) Secure Storage Solutions
- Hot Wallet Recommendation: Gate Web3 Wallet for active trading needs with convenient access
- Cold Storage Solution: For larger holdings, consider hardware wallet solutions for enhanced security
- Security Precautions: Never share private keys, enable two-factor authentication, and regularly update wallet software
V. GNS Potential Risks and Challenges
GNS Market Risks
- Price Volatility: GNS has experienced notable price fluctuations, with a 37.73% decline over the past year and significant distance from its all-time high of $12.48
- Market Cap Risk: With a relatively small market capitalization of approximately $24.39 million, GNS may be subject to higher volatility and liquidity concerns
- Trading Volume Fluctuation: Changes in trading activity across decentralized leverage trading platforms may impact GNS token demand
GNS Regulatory Risks
- DeFi Regulation: Evolving regulatory frameworks for decentralized finance platforms may impact Gains Network's operations
- Leverage Trading Scrutiny: Regulatory attention on high-leverage trading products (up to 1000x on forex pairs) may pose compliance challenges
- Cross-border Compliance: Operating across multiple jurisdictions may require adapting to varying regulatory requirements
GNS Technical Risks
- Smart Contract Vulnerabilities: As with all DeFi protocols, potential security vulnerabilities in smart contracts could impact user funds
- Network Dependency: GNS operates on Polygon and Arbitrum networks; any issues with these underlying blockchains may affect protocol functionality
- Platform Competition: Increasing competition from other decentralized leverage trading platforms may impact Gains Network's market share
VI. Conclusion and Action Recommendations
GNS Investment Value Assessment
Gains Network presents a specialized investment opportunity in the decentralized leverage trading sector, offering exposure to an innovative protocol supporting multiple asset classes with high leverage options. However, the token has faced significant price pressure over the past year, declining 37.73%, and currently trades substantially below its all-time high. The relatively small market capitalization and limited trading volume suggest higher risk compared to more established cryptocurrencies. Long-term value proposition depends on Gains Network's ability to increase platform adoption and trading volume, while short-term risks include continued price volatility and broader market conditions.
GNS Investment Recommendations
✅ Beginners: Start with minimal allocation (1-2% of crypto portfolio) after thoroughly understanding the platform and its risks; consider using Gate.com's educational resources before investing
✅ Experienced Investors: May consider moderate allocation (3-7% of crypto portfolio) as part of a diversified DeFi strategy, while actively monitoring platform metrics and price trends
✅ Institutional Investors: Conduct comprehensive due diligence on Gains Network's protocol architecture, tokenomics, and competitive positioning before determining appropriate allocation within alternative investment portfolios
GNS Trading Participation Methods
- Spot Trading: Purchase GNS through Gate.com's spot trading platform, which offers the token with competitive liquidity
- Dollar-Cost Averaging: Implement regular purchase intervals to mitigate timing risk and smooth out price volatility
- Active Monitoring: Track Gains Network's platform development updates, trading volume statistics, and community engagement to inform investment decisions
Cryptocurrency investment carries extremely high risks, and this article does not constitute investment advice. Investors should make prudent decisions based on their own risk tolerance and are advised to consult professional financial advisors. Never invest more than you can afford to lose.
FAQ
What is the GNS token? What are the core functions of the Gains Network project?
GNS is the governance and utility token of Gains Network, a decentralized leveraged trading platform. Core functions include enabling synthetic asset trading, decentralized price feeds via oracle networks, and community governance. GNS holders participate in protocol decisions and earn rewards from trading fees and platform growth.
What are the main factors affecting GNS price?
GNS price is influenced by platform adoption, trading volume, protocol upgrades, market sentiment, broader crypto trends, and governance developments. Increased usage and network activity typically drive positive price momentum.
What is the historical price trend of GNS tokens?
GNS has experienced significant volatility since launch. The token peaked during bull market periods, then corrected during market downturns. Overall, GNS demonstrates strong upward momentum with increasing adoption and utility driving long-term value appreciation potential.
What are the risks to consider when investing in GNS tokens?
GNS token investments face market volatility risks, liquidity fluctuations, regulatory uncertainties in crypto markets, and smart contract vulnerabilities. Monitor protocol changes and market conditions closely before investing.
GNS offers superior leverage trading with decentralized price feeds, lower fees, real-time execution, and community-driven governance, enabling traders to maximize profits with enhanced efficiency and transparency across DeFi markets.
What are the price predictions and future prospects for GNS in 2024?
GNS shows strong growth potential driven by increasing adoption in decentralized trading. With expanding ecosystem partnerships and growing transaction volume, GNS could experience significant appreciation. Long-term prospects remain bullish as the platform strengthens its market position.
Where can I buy GNS tokens?
GNS tokens are available on major cryptocurrency exchanges including Gate.com, Binance, Uniswap, and other leading platforms. You can trade GNS against multiple currency pairs with high liquidity and trading volume.
What are Gains Network's technological innovations and competitive advantages?
Gains Network leverages decentralized leverage trading with synthetic assets, offering low-cost access to diverse markets. Its key innovations include advanced oracle infrastructure, risk management systems, and efficient smart contracts enabling high trading volumes while maintaining security and transparency in Web3 finance.
* The information is not intended to be and does not constitute financial advice or any other recommendation of any sort offered or endorsed by Gate.