This comprehensive analysis examines GRND (SuperWalk) token pricing dynamics from 2026 to 2031, providing expert forecasts for Move-to-Earn blockchain investors. The article reviews GRND's historical performance, current market position at $0.03522, and holding distribution patterns, while analyzing key factors driving cryptocurrency valuation. Price predictions range from conservative scenarios ($0.02642-$0.0405 in 2026) to optimistic long-term forecasts reaching $0.06032 by 2031. The guide details three investment methodologies—long-term holding, active trading via technical analysis, and dollar-cost averaging—alongside comprehensive risk management frameworks suitable for different investor profiles. Critical considerations include liquidity constraints across four exchanges on Gate, regulatory uncertainties surrounding Move-to-Earn models, and significant token concentration among top holders. Ideal for crypto enthusiasts evaluating Web3 fitness platform exposure through verified Gate.com market data and
Introduction: GRND's Market Position and Investment Value
SuperWalk (GRND), positioned as a blockchain-based Move-to-Earn fitness platform, has been developing its Web 3.0 ecosystem since its launch. As of January 2026, GRND maintains a market capitalization of approximately $24.92 million, with a circulating supply of around 707.66 million tokens, and the price hovers around $0.0352. This asset, recognized as a "health-incentivized cryptocurrency," is playing an increasingly important role in the integration of fitness activities and blockchain rewards.
This article will comprehensively analyze GRND's price trajectory from 2026 to 2031, combining historical patterns, market supply and demand dynamics, ecosystem development, and macroeconomic conditions to provide investors with professional price forecasts and practical investment strategies.
I. GRND Price History Review and Market Status
GRND Historical Price Evolution Trajectory
- 2023: GRND reached a notable price point of $0.384843 on February 26, marking a significant milestone in its early trading period.
- 2025: The token experienced substantial pressure, declining to $0.0218748 on November 21, reflecting broader market challenges.
GRND Current Market Situation
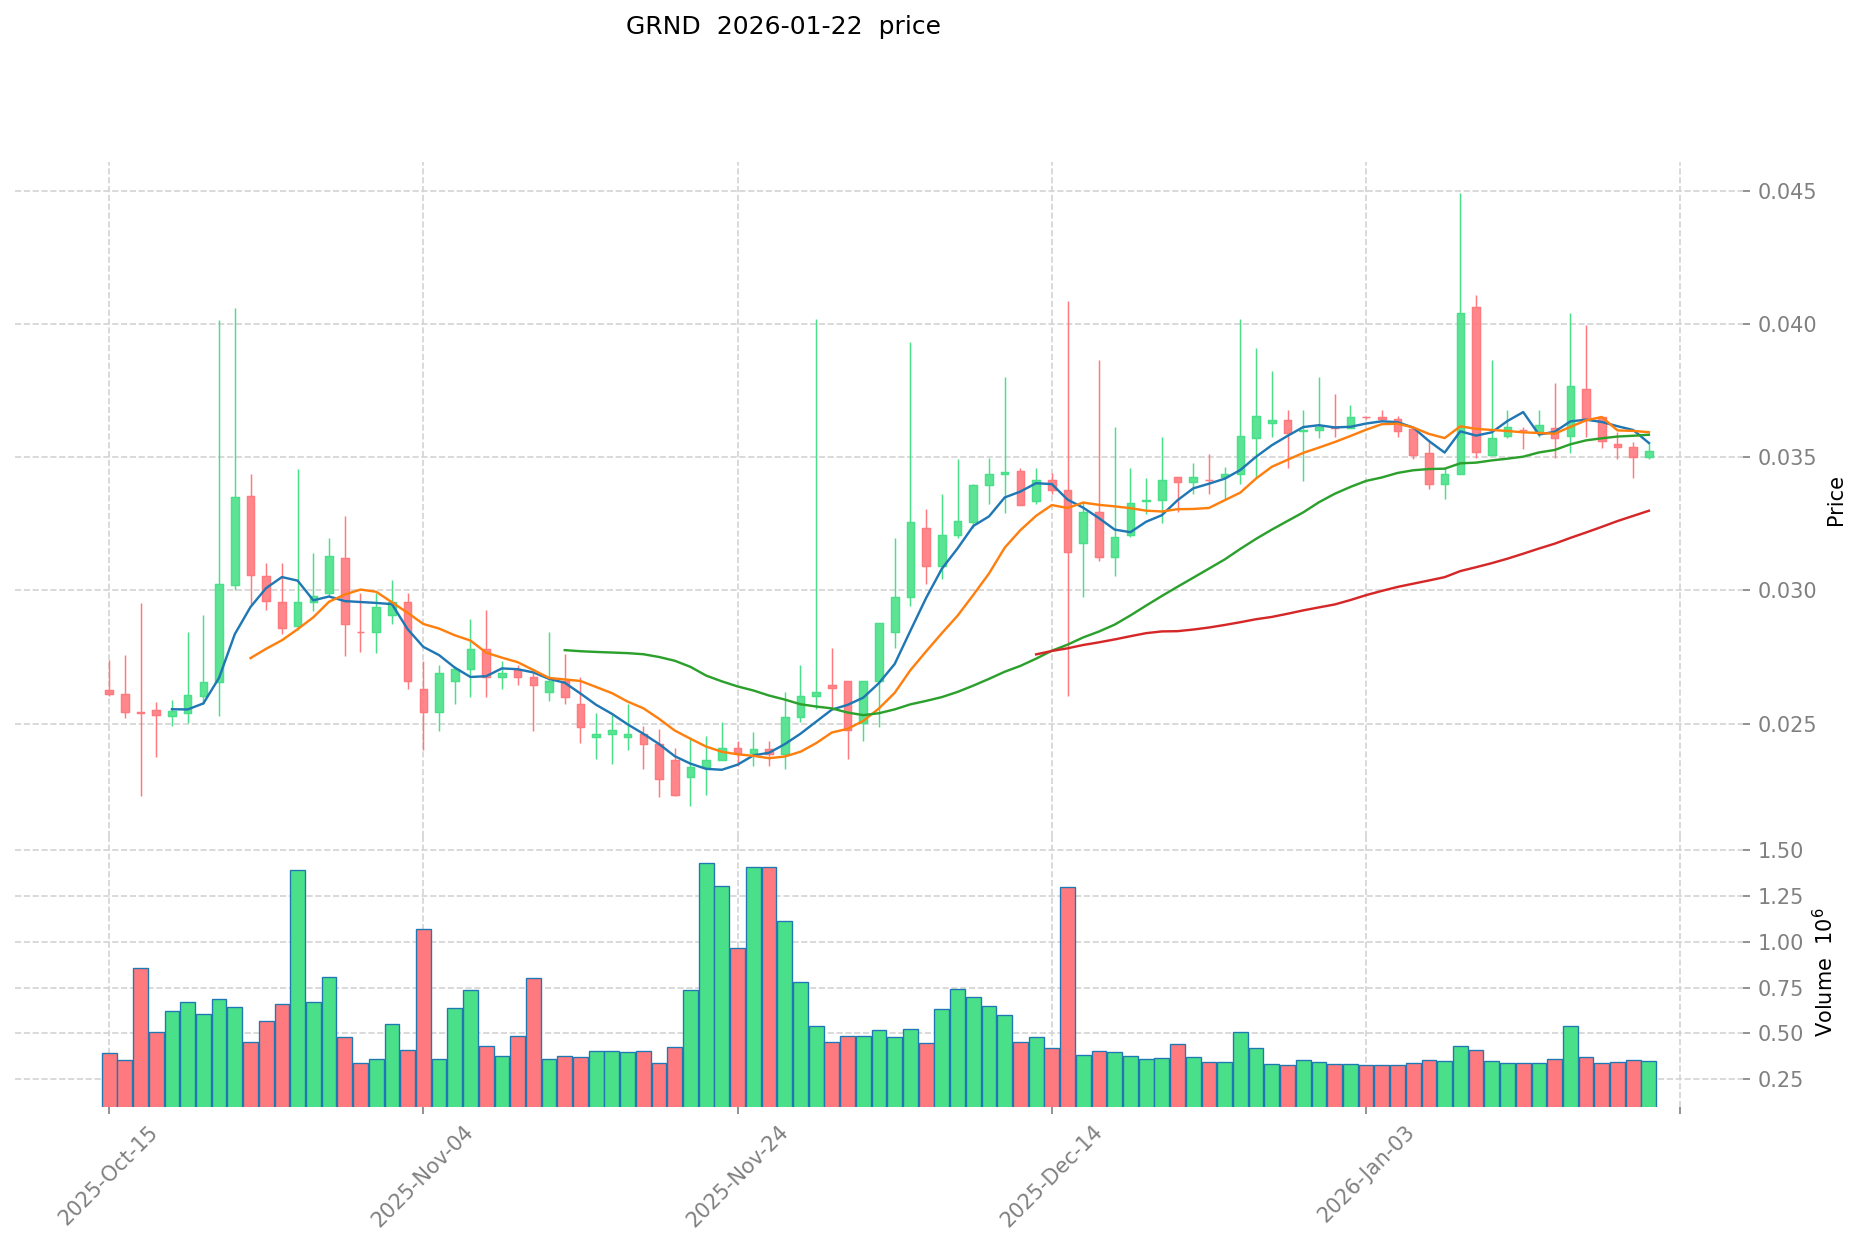
As of January 22, 2026, GRND is trading at $0.03522, representing a recovery from its previous low point. The token has demonstrated a 24-hour price increase of 0.83%, with intraday trading ranging between $0.03493 and $0.03556. Over the past week, GRND has declined by 2.46%, while showing a 30-day gain of 3.44%. The annual performance indicates a decrease of 40.55%.
The current market capitalization stands at approximately $24.92 million, with a fully diluted valuation of $34.78 million. The circulating supply represents 70.77% of the maximum supply, with 707.66 million tokens in circulation out of a maximum of 1 billion tokens. Trading volume over the past 24 hours reached $12,252.83, and the token is supported by approximately 26,339 holders across 4 exchanges.
GRND maintains a market dominance of 0.0010% and ranks #778 in the overall cryptocurrency market. The token's market sentiment is currently neutral, with the broader crypto market experiencing extreme fear conditions according to volatility indices.
Click to view the current GRND market price
GRND Market Sentiment Index
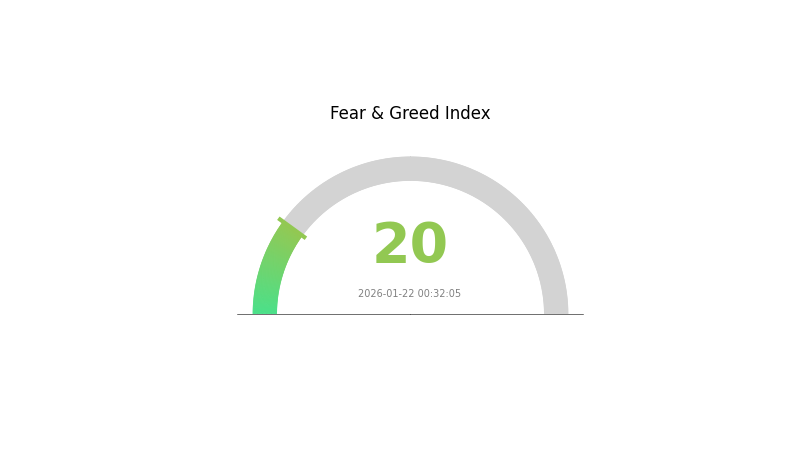
2026-01-22 Fear and Greed Index: 20(Extreme Fear)
Click to view the current Fear & Greed Index
The cryptocurrency market is experiencing extreme fear, with the Fear and Greed Index plummeting to 20. This reading signals intense market pessimism and heightened risk aversion among investors. During such periods of extreme fear, experienced traders often view it as a potential contrarian opportunity, as excessive fear can create favorable entry points for long-term positioning. However, caution remains essential as market volatility typically remains elevated. Monitor key support levels closely and consider Dollar-Cost Averaging strategies to mitigate timing risks in this turbulent environment.
GRND Holding Distribution
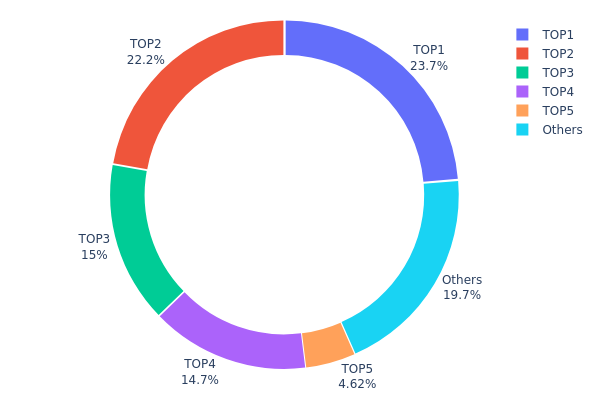
The holding distribution chart represents the concentration of token ownership across different wallet addresses, providing insights into the decentralization level and potential market control dynamics. By analyzing the proportion of tokens held by top addresses versus smaller holders, this metric helps assess the risk of centralized manipulation and the overall health of token distribution.
Based on the current data, GRND exhibits a highly concentrated holding structure. The top 5 addresses collectively control approximately 80.23% of the total token supply, with the largest holder alone possessing 23.66% (236.67M tokens). The top three addresses account for over 60% of circulating supply, indicating significant concentration among a small group of major stakeholders. Such distribution patterns suggest that GRND remains in an early stage of token circulation, potentially with substantial portions held by project teams, early investors, or strategic partners.
This concentration level presents notable implications for market dynamics. High centralization typically amplifies price volatility, as large holders possess the capacity to significantly influence market movements through substantial buy or sell orders. Additionally, this structure creates potential risks of coordinated market manipulation or sudden liquidity shocks if major holders decide to liquidate positions. The limited distribution among smaller addresses (Others: 19.77%) indicates relatively low retail participation, which may constrain organic trading volume and market depth during periods of heightened activity.
Click to view current GRND Holding Distribution
| Top |
Address |
Holding Qty |
Holding (%) |
| 1 |
0x2126...d3aabe |
236666.67K |
23.66% |
| 2 |
0x8019...891674 |
222333.33K |
22.23% |
| 3 |
0x8b8a...a8f261 |
150000.00K |
15.00% |
| 4 |
0xec63...371d94 |
147330.69K |
14.73% |
| 5 |
0x0ebe...8543ce |
46180.22K |
4.61% |
| - |
Others |
197489.10K |
19.77% |
II. Core Factors Affecting GRND's Future Price
Based on the available information, there is insufficient data to provide a comprehensive analysis of the core factors that may influence GRND's future price movements. Key aspects such as supply mechanisms, institutional holdings, macroeconomic influences, and technical developments require verified data sources to ensure accuracy and reliability.
For investors interested in GRND, it is recommended to monitor official project announcements, verified on-chain data, and reputable market analysis platforms. Gate.com provides real-time market data and trading tools that can help users stay informed about price movements and market dynamics.
III. 2026-2031 GRND Price Forecast
2026 Outlook
- Conservative forecast: $0.02642 - $0.0405
- Neutral forecast: Around $0.03522
- Optimistic forecast: Up to $0.0405 (requires favorable market conditions and increased adoption)
2027-2029 Outlook
- Market stage expectation: Gradual growth phase with moderate volatility, potentially benefiting from broader crypto market developments
- Price range forecast:
- 2027: $0.02688 - $0.0424 (approximately 7% year-over-year change)
- 2028: $0.03251 - $0.05177 (approximately 13% year-over-year change)
- 2029: $0.03584 - $0.04733 (approximately 30% year-over-year change)
- Key catalysts: Enhanced ecosystem development, strategic partnerships, and potential technological upgrades that drive user engagement
2030-2031 Long-term Outlook
- Baseline scenario: $0.03778 - $0.05224 (assuming steady market conditions and sustained project development)
- Optimistic scenario: $0.03955 - $0.06032 (driven by significant platform adoption and favorable regulatory environment)
- Transformational scenario: Potential to reach upper bounds of $0.06032 by 2031 (requires breakthrough integrations, substantial user base expansion, and strong market momentum with approximately 40% cumulative growth)
| Year |
Predicted High Price |
Predicted Average Price |
Predicted Low Price |
Price Change |
| 2026 |
0.0405 |
0.03522 |
0.02642 |
0 |
| 2027 |
0.0424 |
0.03786 |
0.02688 |
7 |
| 2028 |
0.05177 |
0.04013 |
0.03251 |
13 |
| 2029 |
0.04733 |
0.04595 |
0.03584 |
30 |
| 2030 |
0.05224 |
0.04664 |
0.03778 |
32 |
| 2031 |
0.06032 |
0.04944 |
0.03955 |
40 |
IV. GRND Professional Investment Strategy and Risk Management
GRND Investment Methodology
(1) Long-term Holding Strategy
- Suitable for: Investors who believe in the growth potential of Web 3.0 fitness platforms and Move-to-Earn models
- Operational recommendations:
- Consider accumulating GRND during market corrections when the price approaches support levels around $0.035
- Monitor the project's user growth metrics and platform engagement to assess long-term viability
- Utilize Gate Web3 Wallet for secure storage with private key control
(2) Active Trading Strategy
- Technical analysis tools:
- Moving averages: Monitor 50-day and 200-day moving averages to identify trend directions and potential entry/exit points
- Volume analysis: Track the 24-hour trading volume ($12,252.83) relative to historical averages to gauge market interest
- Swing trading considerations:
- Watch for price movements within the 24-hour range ($0.03493 - $0.03556) to identify short-term trading opportunities
- Set stop-loss orders to manage downside risk, particularly given the 40.55% decline over the past year
GRND Risk Management Framework
(1) Asset Allocation Principles
- Conservative investors: 1-2% of crypto portfolio allocation
- Aggressive investors: 3-5% of crypto portfolio allocation
- Professional investors: Up to 7-10% with active monitoring and hedging strategies
(2) Risk Hedging Solutions
- Diversification approach: Balance GRND holdings with established cryptocurrencies and stablecoins to reduce portfolio volatility
- Position sizing strategy: Use dollar-cost averaging to build positions gradually rather than entering with full allocation at once
(3) Secure Storage Solutions
- Hot wallet recommendation: Gate Web3 Wallet for active trading and convenient access to Gate.com exchange
- Cold storage approach: Transfer larger GRND holdings to hardware wallets for long-term storage
- Security precautions: Enable two-factor authentication, regularly update security settings, and never share private keys or seed phrases
V. GRND Potential Risks and Challenges
GRND Market Risks
- High volatility exposure: GRND has experienced significant price fluctuations, with a 40.55% decline over the past year, indicating substantial market risk
- Limited liquidity concerns: With a 24-hour trading volume of $12,252.83 and presence on only 4 exchanges, liquidity may be constrained during high-volatility periods
- Market capitalization positioning: At rank #778 with 0.0010% market dominance, GRND remains a relatively small-cap asset subject to amplified price movements
GRND Regulatory Risks
- Move-to-Earn model scrutiny: Regulatory frameworks for blockchain-based reward systems remain undefined in many jurisdictions, potentially impacting platform operations
- Token classification uncertainty: Future regulatory interpretations of GRND's token utility could affect its trading status and accessibility
- Geographic restrictions: Changes in cryptocurrency regulations across different regions may limit user participation and platform adoption
GRND Technical Risks
- Smart contract vulnerabilities: As with any blockchain-based platform, potential security flaws in smart contracts could expose users to technical exploits
- Platform dependency: The token's value is closely tied to SuperWalk platform adoption and continued user engagement in the fitness ecosystem
- Scalability challenges: Network congestion or technical limitations on the KAIA chain could impact transaction efficiency and user experience
VI. Conclusion and Action Recommendations
GRND Investment Value Assessment
GRND represents exposure to the emerging Move-to-Earn sector within Web 3.0 fitness applications. The project targets users interested in earning cryptocurrency rewards through physical activity. While the concept addresses the intersection of health and blockchain technology, investors should note the significant price decline over the past year (down 40.55%) and relatively modest market presence. The circulating supply of 707.66 million tokens (70.77% of maximum supply) provides reasonable liquidity, though trading volume remains limited. Short-term risks include continued volatility and limited exchange availability, while long-term potential depends on platform adoption and broader Move-to-Earn sector growth.
GRND Investment Recommendations
✅ Beginners: Start with minimal exposure (under 2% of crypto portfolio) to understand the Move-to-Earn model; use Gate.com for straightforward purchase and storage options
✅ Experienced investors: Consider GRND as a speculative position (3-5% allocation) within a diversified Web 3.0 portfolio; monitor platform metrics and user growth indicators
✅ Institutional investors: Evaluate GRND within a broader fitness technology and GameFi sector analysis; assess tokenomics sustainability and competitive positioning before any allocation
GRND Trading Participation Methods
- Spot trading: Purchase GRND directly on Gate.com with immediate settlement and full ownership
- Dollar-cost averaging: Implement systematic purchase schedules to reduce timing risk and average entry prices over time
- Portfolio integration: Incorporate GRND as part of a diversified Web 3.0 or Move-to-Earn themed investment strategy
Cryptocurrency investment carries extremely high risks, and this article does not constitute investment advice. Investors should make prudent decisions based on their own risk tolerance and are advised to consult professional financial advisors. Never invest more than you can afford to lose.
FAQ
What is GRND and what is its current price?
GRND is a cryptocurrency token designed for the web3 ecosystem. As of January 2026, GRND is trading with active market participation. The current price fluctuates based on market demand and supply dynamics. For the latest price data and trading volume, please check real-time market information on major crypto platforms.
What are the factors that influence GRND price movements?
GRND price is influenced by market demand, trading volume, investor sentiment, overall crypto market trends, project developments, tokenomics changes, and macroeconomic factors affecting the broader digital asset ecosystem.
What is the price prediction for GRND in 2024 and 2025?
GRND demonstrated strong growth potential through 2024-2025, with analysts projecting significant upside driven by increasing adoption and ecosystem expansion. Conservative estimates suggested $0.15-0.25 range, while bullish scenarios indicated potential moves toward $0.50+, depending on market conditions and project milestones.
GRND demonstrates strong price momentum with consistent growth outperforming many comparable projects. Its trading volume and market adoption have accelerated significantly, positioning it as a competitive asset within its category with superior long-term appreciation potential.
What are the risks and volatility factors associated with GRND price?
GRND price volatility stems from market sentiment shifts, trading volume fluctuations, regulatory changes, and macroeconomic factors. Price movements are influenced by project developments, investor behavior, and broader crypto market trends. Investors should monitor these dynamics carefully.
What historical price trends has GRND experienced?
GRND has shown volatile price movements since launch, experiencing several bull and bear cycles. Early trading saw rapid growth from initial levels, followed by market corrections during broader crypto downturns. Recent trends indicate increased stability with growing trading volumes, reflecting strengthened market confidence and adoption among investors.
Is GRND a good investment based on price analysis and market sentiment?
GRND shows strong fundamentals with positive market sentiment and solid trading volume growth. Technical analysis indicates upward momentum with key support levels holding firm. Current market conditions suggest favorable conditions for potential appreciation in the near term.
* The information is not intended to be and does not constitute financial advice or any other recommendation of any sort offered or endorsed by Gate.