This comprehensive analysis examines Hana Network (HANA) price trajectory through 2031, combining historical patterns and market dynamics to guide investment decisions. As a social finance platform blending livestreaming with crypto accessibility, HANA demonstrates strong early traction with 40 million transactions and $9 million in funding. The article projects modest 2026 growth ($0.02369-$0.03987), progressing toward potential 106% returns by 2031 under favorable conditions. Key sections address market sentiment analysis, supply-demand factors, and ecosystem development influences on price movements. Professional investment strategies include long-term holding and active trading approaches, supported by comprehensive risk management frameworks. Risk assessments cover price volatility, liquidity concerns, and regulatory challenges inherent to social finance platforms. The analysis recommends staged entry points via Gate.com, appropriate portfolio allocation percentages based on investor profiles, and secure
Introduction: HANA's Market Position and Investment Value
Hana Network (HANA) positions itself as the TikTok of the cryptocurrency space, aiming to replace centralized exchanges as the mainstream crypto gateway through livestreaming, casual earning mechanisms, and seamless onboarding experiences. Since its launch in 2025, the project has achieved notable traction with 40 million transactions and 400,000 unique wallet users, while securing $9 million in funding. As of January 28, 2026, HANA holds a market capitalization of approximately $6.79 million, with a circulating supply of 240 million tokens and a current price hovering around $0.02831. This asset, which blends social entertainment with cryptocurrency accessibility, is playing an increasingly important role in lowering the entry barriers for mainstream crypto adoption.
This article will comprehensively analyze HANA's price trajectory from 2026 to 2031, combining historical patterns, market supply-demand dynamics, ecosystem development, and macroeconomic conditions to provide investors with professional price forecasts and practical investment strategies.
I. HANA Price History Review and Market Status
HANA Historical Price Evolution Trajectory
- 2025: HANA token was launched in January 2025, with an initial trading period showing significant volatility. The token reached a price peak of $0.10334 in October 2025, reflecting strong market interest during its early phase.
- 2026: The market entered a correction phase in early 2026, with prices declining from the October 2025 high. The token reached a low point of $0.00712 in January 2026, representing a substantial pullback from previous levels.
HANA Current Market Status
As of January 28, 2026, HANA is trading at $0.02831, showing a recovery from its recent low point. The token has demonstrated notable short-term momentum, with a 24-hour price increase of 17.67% and a 7-day gain of 123.10%. Over the past 30 days, HANA has risen by 160.05%, indicating renewed market interest.
The current 24-hour trading range spans from $0.022925 to $0.031185, with a total trading volume of $810,445. The circulating supply stands at 240 million HANA tokens out of a maximum supply of 1 billion tokens, representing a 24% circulation rate. The current market capitalization is approximately $6.79 million, with a fully diluted valuation of $28.31 million.
The project has maintained consistent on-chain activity, with cumulative transaction volume reaching 40 million transactions across 400,000 unique wallet addresses. The token is currently held by 6,767 addresses and is listed on 13 exchanges. Market sentiment indicators suggest a cautious atmosphere, with the broader crypto market fear index at 29, indicating a "Fear" environment.
HANA operates on the BSC (BEP-20) standard, with its smart contract address verified on BscScan. The project positions itself as a livestreaming and earning platform within the cryptocurrency space, having secured $9 million in funding.
Click to view current HANA market price

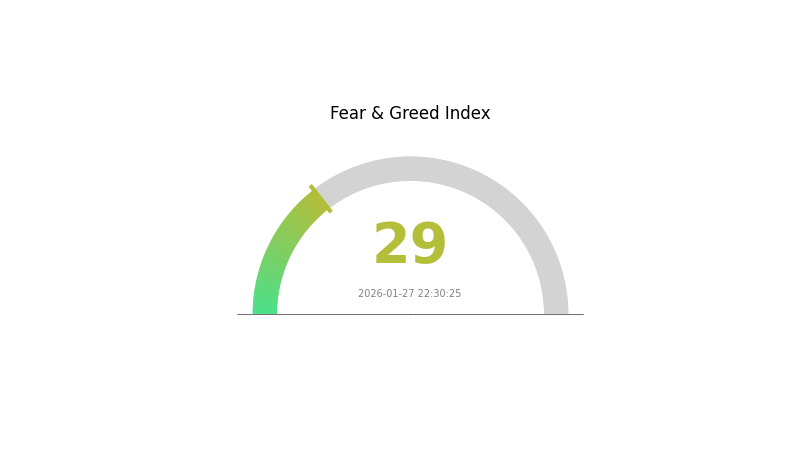
HANA Market Sentiment Index
2026-01-27 Fear and Greed Index: 29 (Fear)
Click to view current Fear & Greed Index
The crypto market is currently dominated by fear sentiment with a Fear and Greed Index reading of 29. This indicates heightened market anxiety and cautious investor behavior. When the index falls into the fear zone, it often signals potential buying opportunities for long-term investors, as asset prices may be undervalued. However, it's advisable to conduct thorough research and assess your risk tolerance before making investment decisions. Market volatility during fear periods requires careful portfolio management and strategic positioning on Gate.com.
HANA Holdings Distribution
The holdings distribution chart illustrates the concentration of token ownership across different wallet addresses, providing insights into the decentralization level and potential market risks. According to the latest on-chain data, HANA exhibits a highly centralized distribution pattern that warrants careful attention from market participants.
The top address controls 501,471.37K tokens, representing 50.14% of the total supply, while the second-largest holder possesses 182,245.44K tokens (18.22%). Combined, the top two addresses control approximately 68.36% of circulating supply. The third through fifth largest holders account for 7.71%, 3.44%, and 2.75% respectively, while all remaining addresses collectively hold only 17.74%. This concentration structure indicates significant centralization, with a small number of entities exercising substantial influence over token circulation.
Such extreme concentration presents notable implications for market dynamics. Large holders possess the capacity to significantly impact price movements through relatively modest trading activity, potentially amplifying volatility during periods of market stress. The limited distribution among secondary holders reduces market depth and liquidity, increasing susceptibility to price manipulation and creating challenges for institutional participants seeking to establish or exit positions without substantial slippage. From a structural perspective, this distribution pattern suggests HANA remains in an early development phase with limited community-driven ownership, raising questions about long-term sustainability and genuine decentralization objectives.
Click to view current HANA Holdings Distribution

| Top |
Address |
Holding Qty |
Holding (%) |
| 1 |
0xfd30...a4654e |
501471.37K |
50.14% |
| 2 |
0x73d8...4946db |
182245.44K |
18.22% |
| 3 |
0xc882...84f071 |
77164.88K |
7.71% |
| 4 |
0x0d07...b492fe |
34459.67K |
3.44% |
| 5 |
0xd21b...fed759 |
27541.94K |
2.75% |
| - |
Others |
177116.72K |
17.74% |
II. Core Factors Influencing HANA's Future Price Trends
Supply Mechanism
- Market Sentiment: The cryptocurrency market's overall sentiment and trends play a significant role in influencing HANA's price movements. Positive market conditions typically drive increased investor interest and trading activity.
- Adoption Rate: The success of Hana Network's user-driven mechanism and integration efforts directly impacts token demand. Higher adoption rates among users and platforms can strengthen price support.
- Current Impact: Supply and demand dynamics remain the primary drivers of HANA's price performance. As market demand evolves, these fundamental factors continue to shape price expectations.
Macroeconomic Environment
- Global Economic Development: HANA's future price trajectory is influenced by broader economic conditions, including global growth patterns and financial market stability.
- Technological Innovation: Advances in blockchain technology and the successful implementation of innovative features within the Hana Network ecosystem can enhance long-term value propositions and attract sustained investor interest.
III. 2026-2031 HANA Price Prediction
2026 Outlook
- Conservative Forecast: $0.02369 - $0.02889
- Neutral Forecast: $0.02889 (average price level)
- Optimistic Forecast: $0.03987 (requiring favorable market conditions and increased adoption)
Based on the current market analysis, HANA is expected to demonstrate modest growth in 2026, with price predictions ranging from a low of $0.02369 to a potential high of $0.03987. The anticipated average price of $0.02889 suggests relatively stable trading patterns as the token establishes its market position.
2027-2029 Mid-term Outlook
- Market Stage Expectation: Gradual expansion phase with increasing market penetration and user adoption
- Price Range Forecasts:
- 2027: $0.02544 - $0.04229 (21% projected increase)
- 2028: $0.03719 - $0.04256 (35% cumulative growth)
- 2029: $0.03114 - $0.06027 (42% projected advancement)
- Key Catalysts: Sustained ecosystem development, potential technological improvements, and broader cryptocurrency market recovery cycles
The mid-term projection indicates progressive upward momentum, with HANA potentially experiencing more substantial growth between 2027 and 2029. The average prices are expected to rise from $0.03438 in 2027 to $0.04045 by 2029, reflecting increased market confidence and adoption.
2030-2031 Long-term Outlook
- Baseline Scenario: $0.04582 - $0.05036 in 2030 (assuming steady market conditions and continued project development)
- Optimistic Scenario: $0.05036 - $0.06647 in 2030 (with accelerated adoption and favorable market dynamics)
- Progressive Scenario: $0.04556 - $0.08645 by 2031 (under highly favorable conditions including significant technological breakthroughs and widespread adoption)
Long-term forecasts suggest HANA could achieve notable appreciation by 2031, with potential returns of 77% by 2030 and up to 106% by 2031 compared to current levels. The predicted high of $0.08645 in 2031 represents the upper boundary under exceptionally positive market conditions. However, investors should note that cryptocurrency markets remain highly volatile, and actual performance may vary significantly from these projections based on numerous factors including regulatory developments, technological evolution, and overall market sentiment.
| Year |
Predicted High Price |
Predicted Average Price |
Predicted Low Price |
Price Change |
| 2026 |
0.03987 |
0.02889 |
0.02369 |
2 |
| 2027 |
0.04229 |
0.03438 |
0.02544 |
21 |
| 2028 |
0.04256 |
0.03834 |
0.03719 |
35 |
| 2029 |
0.06027 |
0.04045 |
0.03114 |
42 |
| 2030 |
0.06647 |
0.05036 |
0.04582 |
77 |
| 2031 |
0.08645 |
0.05841 |
0.04556 |
106 |
IV. HANA Professional Investment Strategies and Risk Management
HANA Investment Methodology
(1) Long-Term Holding Strategy
- Suitable for: Investors seeking exposure to social finance and Web3 gaming ecosystems
- Operational Recommendations:
- Consider accumulating positions during market consolidation phases, particularly when price approaches support levels
- Monitor project development milestones including user growth metrics and transaction volume trends
- Storage Solution: Utilize Gate Web3 Wallet for secure asset management with multi-signature protection
(2) Active Trading Strategy
- Technical Analysis Tools:
- Moving Averages: Apply 7-day and 30-day moving averages to identify trend reversals, given HANA's 123.10% weekly gain
- Volume Analysis: Monitor 24-hour trading volume ($810,445) relative to market cap to assess liquidity conditions
- Swing Trading Considerations:
- Set profit-taking levels during periods of extended gains, as HANA has shown 160.05% growth over 30 days
- Implement stop-loss orders to protect against sudden volatility, considering the 72.98% decline from yearly high
HANA Risk Management Framework
(1) Asset Allocation Principles
- Conservative Investors: 1-2% of crypto portfolio allocation
- Moderate Investors: 3-5% of crypto portfolio allocation
- Aggressive Investors: 5-10% of crypto portfolio allocation, with close monitoring
(2) Risk Hedging Approaches
- Position Sizing: Scale entries across multiple price points to average acquisition costs
- Portfolio Diversification: Balance HANA exposure with established digital assets to reduce concentration risk
(3) Secure Storage Solutions
- Hot Wallet Recommendation: Gate Web3 Wallet for active trading and staking participation
- Cold Storage Option: Hardware wallet solutions for long-term holdings exceeding short-term trading needs
- Security Precautions: Enable two-factor authentication, regularly review wallet permissions, and avoid sharing private keys
V. HANA Potential Risks and Challenges
HANA Market Risks
- Price Volatility: HANA experienced a 72.98% decline from its historical high of $0.10334, indicating significant price fluctuation potential
- Liquidity Concerns: With a relatively modest 24-hour trading volume compared to market cap, large transactions may experience slippage
- Market Cap Positioning: Ranked #1388 with 0.00089% market dominance, suggesting limited institutional participation
HANA Regulatory Risks
- Social Finance Compliance: Live-streaming and earning features may face evolving regulatory scrutiny across different jurisdictions
- Token Classification: Potential regulatory developments regarding token utility and securities classification could impact operations
- Geographic Restrictions: Certain features may become restricted in jurisdictions with stringent crypto regulations
HANA Technical Risks
- Smart Contract Vulnerabilities: BEP-20 token standard requires ongoing security audits to prevent exploitation
- Network Dependency: Reliance on BSC infrastructure means potential exposure to network congestion or security issues
- Platform Development Risk: Project success depends on continued development and user acquisition, with 400,000 unique wallets representing early-stage adoption
VI. Conclusion and Action Recommendations
HANA Investment Value Assessment
HANA presents an innovative approach to social finance by combining live-streaming with crypto earning mechanisms. The project has demonstrated strong short-term momentum with 123.10% weekly gains and secured $9 million in funding. With 40 million transactions and 400,000 unique wallets, the platform shows early traction. However, the 24% circulating supply (240 million of 1 billion total supply) suggests potential future dilution concerns. The significant 72.98% decline from historical highs underscores substantial volatility. Long-term value depends on sustained user growth and successful execution of the vision to become a mainstream crypto gateway.
HANA Investment Recommendations
✅ Beginners: Start with minimal allocation (under 2% of crypto portfolio) to understand project mechanics and market behavior. Focus on learning about social finance trends before increasing exposure.
✅ Experienced Investors: Consider moderate position sizing (3-5%) with staged entry points. Monitor development progress, user metrics, and trading volume patterns for timing decisions.
✅ Institutional Investors: Conduct thorough due diligence on tokenomics, vesting schedules, and competitive positioning. Assess team execution capabilities and long-term sustainability of the business model.
HANA Trading Participation Methods
- Spot Trading: Execute buy and sell orders on Gate.com with competitive trading fees and deep liquidity
- Dollar-Cost Averaging: Implement systematic purchase plans to mitigate timing risk and reduce average entry price
- Portfolio Rebalancing: Periodically adjust HANA allocation based on performance metrics and risk tolerance changes
Cryptocurrency investments carry extremely high risk, and this article does not constitute investment advice. Investors should make cautious decisions based on their own risk tolerance and are advised to consult professional financial advisors. Never invest more than you can afford to lose.
FAQ
What is HANA's historical price trend and main price cycles?
HANA has demonstrated significant volatility with a 10% fluctuation over the past year. The 52-week price range spans from 10,050 to 12,500, reflecting notable market cycles driven by trading volume and market sentiment shifts.
What are the main factors affecting HANA price?
HANA price is influenced by market sentiment, user adoption rate, supply and demand dynamics, and network activity. Trading volume and broader market conditions also play significant roles in price movements.
How to analyze HANA price predictions and what reliable technical analysis methods are available?
Analyze HANA price through technical indicators like moving averages, RSI, and MACD to identify trends. Monitor trading volume and support/resistance levels. Combine technical analysis with fundamental analysis for improved accuracy in price forecasting.
What are the risks and limitations in HANA price prediction?
HANA price prediction faces risks from technological advancement and market demand volatility. Limitations include data accuracy constraints and rapid computational cost reduction affecting prediction models.
HANA has experienced significant price decline compared to similar market-cap assets like Wombat Exchange and Binemon. As of January 27, 2026, HANA's market performance remains considerably weaker than comparable tokens in its category.
* The information is not intended to be and does not constitute financial advice or any other recommendation of any sort offered or endorsed by Gate.