This comprehensive HEI price analysis combines expert forecasts, market dynamics, and investment strategies for 2026-2031. HEI, a Layer 1 blockchain for cross-chain interoperability evolved from Litentry Network, currently trades at $0.1441 with $9.74 million market cap. The article examines HEI's historical volatility, from $1.25 peak to $0.04756 low, and current market sentiment showing extreme fear conditions. Professional predictions project conservative 2026 range of $0.09596-$0.1454, with potential growth to $0.17303 under favorable conditions, extending toward $0.29544 by 2031. The analysis addresses core risks including liquidity constraints, concentrated token distribution, and regulatory uncertainties, while providing tailored investment strategies for beginners, experienced traders, and institutional investors. Complete risk management framework includes asset allocation guidelines and secure storage solutions via Gate Web3 Wallet, enabling informed decision-making in this volatile market segment.
Introduction: HEI's Market Position and Investment Value
Heima (HEI), as a cutting-edge Layer 1 blockchain designed for seamless multi-chain and cross-chain interoperability, has evolved from the Litentry Network since its inception. As of 2026, Heima has achieved a market capitalization of approximately $9.74 million, with a circulating supply of around 67.62 million tokens, and maintains a price level near $0.1441. This asset, recognized as an "advanced blockchain infrastructure solution," is playing an increasingly crucial role in the domains of cross-chain technology and decentralized identity management.
This article will comprehensively analyze HEI's price trends from 2026 to 2031, combining historical patterns, market supply and demand dynamics, ecosystem development, and macroeconomic conditions to provide investors with professional price forecasts and practical investment strategies.
I. HEI Price History Review and Current Market Status
HEI Historical Price Evolution Trajectory
- February 2025: HEI reached its all-time high of $1.25 on February 13, marking a significant peak in its early trading period.
- October 2025: The token experienced a substantial correction, hitting an all-time low of $0.04755675 on October 11, reflecting broader market volatility.
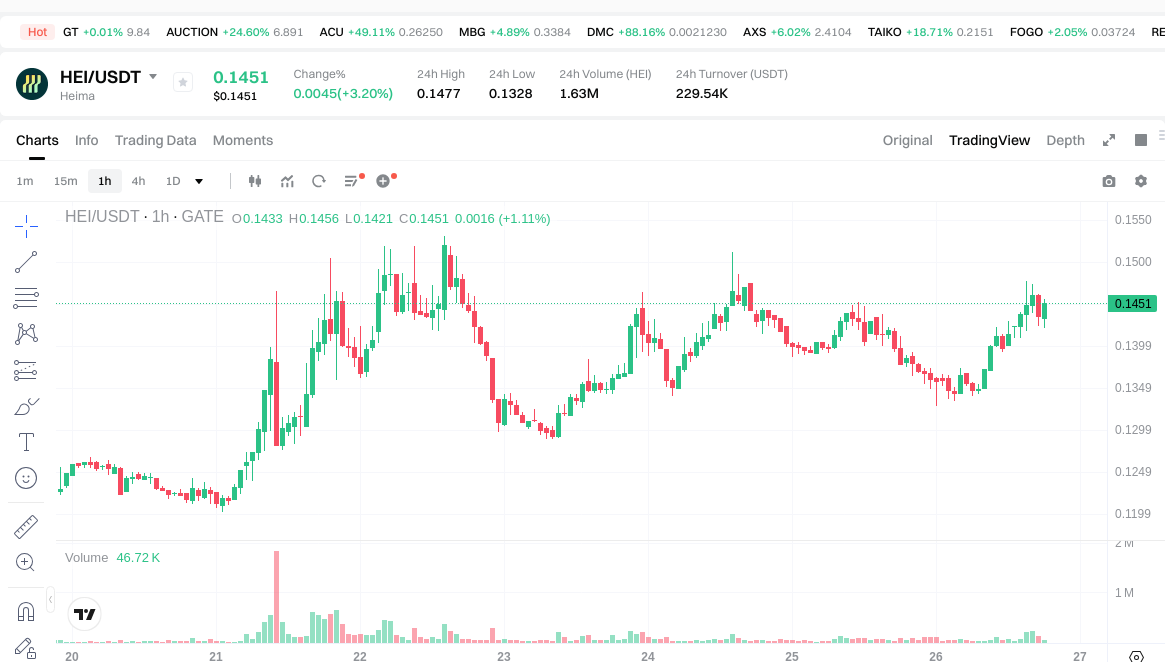
- January 2026: HEI demonstrated recovery momentum with a 30-day increase of 21.4%, trading at $0.1441 as of January 26.
HEI Current Market Status
As of January 26, 2026, HEI is trading at $0.1441, showing mixed short-term momentum. The token recorded a modest 24-hour gain of 3.58%, with trading activity reaching $229,710.34 in volume. However, the 1-hour performance indicates a slight pullback of 1.51%.
Over the past week, HEI has exhibited notable strength with an 18.41% increase, extending to a 21.4% gain over the 30-day period. Despite this recent positive trajectory, the token remains significantly below its historical peak, down 75.73% from its all-time high over the past year.
The current market capitalization stands at $9.74 million, with a fully diluted valuation of $13.38 million. HEI's circulating supply represents 72.82% of the total supply of 92.86 million tokens, with 67.62 million tokens currently in circulation. The token holds 842 holders and is listed on 21 exchanges, maintaining a modest market share of 0.00043%.
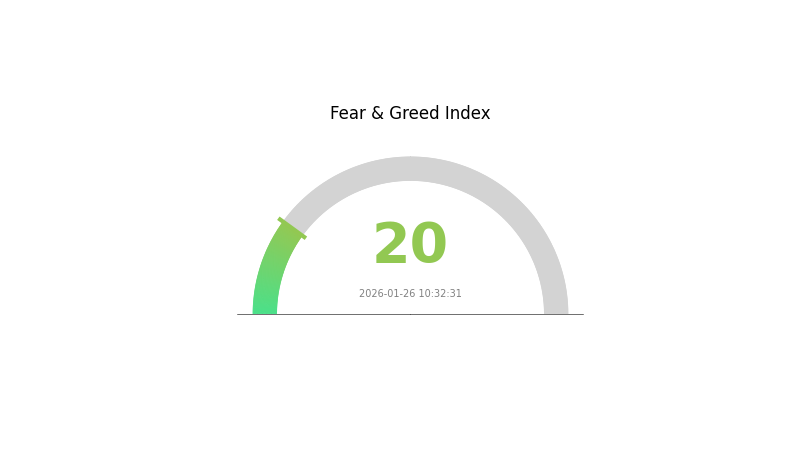
The cryptocurrency market sentiment indicator shows a reading of 20, reflecting extreme fear conditions in the broader market environment as of January 26, 2026.
Click to view the current HEI market price
HEI Market Sentiment Indicator
2026-01-26 Fear and Greed Index: 20 (Extreme Fear)
Click to view current Fear & Greed Index
The cryptocurrency market is currently experiencing extreme fear with an HEI reading of 20. This historically low level suggests significant market pessimism and heightened investor anxiety. During such periods, asset prices often reach attractive entry points for contrarian investors. However, extreme fear typically indicates elevated volatility and risk. Market participants should exercise caution, maintain proper risk management, and avoid emotional decision-making. This sentiment extreme often precedes market turning points, making it a critical period to monitor for potential opportunities or further downside pressure.
HEI Holding Distribution
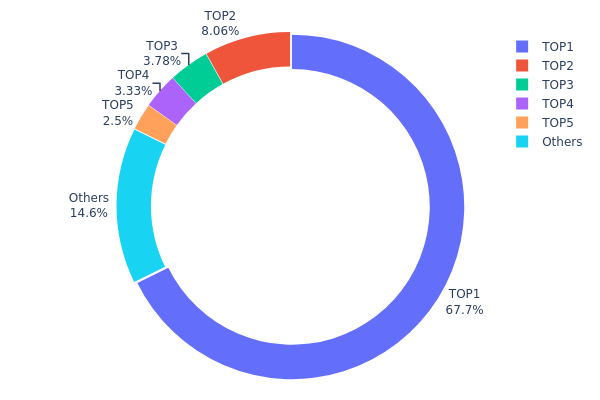
The holding distribution chart illustrates the allocation of HEI tokens across different wallet addresses, providing crucial insights into the token's decentralization level and potential concentration risks. This metric reveals how evenly or unevenly tokens are distributed among holders, which directly impacts market stability and price volatility.
According to the current data, HEI exhibits a highly concentrated holding structure. The top address controls approximately 67.72% of the total supply (40,667.92K tokens), representing an overwhelming majority of circulating tokens. When combined with the second-largest holder at 8.06%, the top two addresses alone command nearly 76% of all HEI tokens. The top five addresses collectively hold approximately 85.38% of the supply, leaving only 14.62% distributed among all remaining holders.
This extreme concentration pattern presents significant implications for market dynamics. Such a distribution structure indicates limited decentralization and suggests that a small number of entities possess substantial control over the token's supply. This concentration creates elevated risks of price manipulation, as large holders could significantly influence market prices through coordinated selling or buying activities. Additionally, the limited distribution among retail holders may result in reduced liquidity and heightened volatility, as large transactions from top holders could trigger disproportionate price movements. From an on-chain structural perspective, this concentration level raises concerns about the project's long-term sustainability and community-driven governance potential.
Click to view current HEI Holding Distribution
| Top |
Address |
Holding Qty |
Holding (%) |
| 1 |
0xf977...41acec |
40667.92K |
67.72% |
| 2 |
0x5fc8...7b4c11 |
4841.11K |
8.06% |
| 3 |
0x465d...00cf36 |
2269.84K |
3.78% |
| 4 |
0x94c1...8d2702 |
1999.99K |
3.33% |
| 5 |
0x4368...26f042 |
1500.00K |
2.49% |
| - |
Others |
8766.33K |
14.62% |
II. Core Factors Affecting HEI's Future Price
Based on the available information, there is insufficient data to provide a comprehensive analysis of the core factors affecting HEI's future price. The provided materials do not contain specific information about HEI's supply mechanisms, institutional holdings, macroeconomic positioning, or technical development roadmap.
To conduct a thorough analysis of HEI's price influencing factors, additional information would be needed regarding:
- Supply and distribution mechanisms
- Institutional adoption and major holder activities
- Technical infrastructure and ecosystem development
- Regulatory environment and policy implications
- Market positioning and competitive advantages
Without substantiated data from reliable sources, it would be inappropriate to make speculative claims about HEI's future price drivers. Investors should conduct independent research and refer to official project documentation before making investment decisions.
III. 2026-2031 HEI Price Prediction
2026 Outlook
- Conservative Forecast: $0.09596 - $0.1454
- Neutral Forecast: $0.1454
- Optimistic Forecast: $0.17303 (requires favorable market conditions and increased adoption)
2027-2029 Outlook
- Market Stage Expectation: HEI is anticipated to enter a gradual growth phase, with increasing market recognition and potential ecosystem development driving moderate price appreciation.
- Price Range Predictions:
- 2027: $0.12737 - $0.21335
- 2028: $0.16393 - $0.24216
- 2029: $0.16709 - $0.27849
- Key Catalysts: Market expansion, potential partnerships, technological improvements, and broader cryptocurrency market trends may serve as primary drivers for price movement during this period.
2030-2031 Long-term Outlook
- Baseline Scenario: $0.19462 - $0.25867 (assuming steady market conditions and continued project development)
- Optimistic Scenario: $0.24635 - $0.29544 (conditional on strong ecosystem growth and favorable regulatory environment)
- Transformative Scenario: Potential upside beyond $0.29544 (requires exceptional adoption rates, major strategic partnerships, or significant market catalysts)
- 2026-01-26: HEI trading within initial projection range, with potential for gradual appreciation over the forecast period
| Year |
Predicted High Price |
Predicted Average Price |
Predicted Low Price |
Price Change |
| 2026 |
0.17303 |
0.1454 |
0.09596 |
0 |
| 2027 |
0.21335 |
0.15921 |
0.12737 |
10 |
| 2028 |
0.24216 |
0.18628 |
0.16393 |
29 |
| 2029 |
0.27849 |
0.21422 |
0.16709 |
48 |
| 2030 |
0.25867 |
0.24635 |
0.19462 |
70 |
| 2031 |
0.29544 |
0.25251 |
0.17928 |
75 |
IV. HEI Professional Investment Strategy and Risk Management
HEI Investment Methodology
(1) Long-term Holding Strategy
- Target Investors: Crypto enthusiasts interested in cross-chain interoperability and Layer 1 blockchain infrastructure
- Operational Recommendations:
- Consider accumulating positions during market corrections, as HEI has shown recovery potential with 18.41% growth over 7 days
- Monitor the project's technological development milestones related to multi-chain and cross-chain interoperability features
- For secure storage, consider using Gate Web3 Wallet which supports both ETH and BSC networks where HEI tokens are deployed
(2) Active Trading Strategy
- Technical Analysis Tools:
- Volume Analysis: Current 24-hour trading volume stands at $229,710, traders should monitor volume spikes as potential entry/exit signals
- Price Range Trading: With 24-hour high at $0.1477 and low at $0.1328, identify key support and resistance levels
- Swing Trading Key Points:
- The 30-day positive momentum of 21.4% suggests potential continued upward trend in the medium term
- Set stop-loss orders considering the token's historical volatility, particularly noting the significant decline from its historical high of $1.25
HEI Risk Management Framework
(1) Asset Allocation Principles
- Conservative Investors: 1-3% of crypto portfolio allocation
- Aggressive Investors: 5-8% of crypto portfolio allocation
- Professional Investors: May consider up to 10% allocation with active monitoring and hedging strategies
(2) Risk Hedging Solutions
- Portfolio Diversification: Balance HEI holdings with established cryptocurrencies and stablecoins to reduce overall portfolio volatility
- Position Sizing: Given HEI's market cap of approximately $9.74 million and lower liquidity compared to major cryptocurrencies, limit individual position sizes accordingly
(3) Secure Storage Solutions
- Hot Wallet Recommendation: Gate Web3 Wallet for convenient trading and staking participation, supporting both Ethereum and BSC networks
- Cold Storage Solution: For long-term holdings, consider hardware wallet solutions with proper backup procedures
- Security Precautions: Always verify contract addresses (ETH: 0xf8f173e20e15f3b6cb686fb64724d370689de083, BSC: 0xf8f173e20e15f3b6cb686fb64724d370689de083) before transactions, enable two-factor authentication, and never share private keys
V. HEI Potential Risks and Challenges
HEI Market Risks
- Volatility Risk: HEI has experienced significant price fluctuations with a yearly decline of 75.73%, indicating substantial market volatility
- Liquidity Risk: With a market cap of approximately $9.74 million and ranking at 1212, the token may face liquidity constraints during high-volume trading periods
- Market Capitalization Risk: The relatively small holder base of 842 addresses suggests concentrated ownership and potential price manipulation risks
HEI Regulatory Risks
- Cross-chain Compliance: As a multi-chain interoperability protocol, HEI may face evolving regulatory scrutiny regarding cross-border transactions and decentralized finance activities
- Token Classification Uncertainty: Regulatory authorities in different jurisdictions may classify HEI differently, potentially affecting its tradability and usage
- Smart Contract Compliance: ERC-20 token operations on multiple chains require ongoing compliance with changing blockchain regulations
HEI Technical Risks
- Smart Contract Vulnerabilities: As with any blockchain project, smart contracts may contain undiscovered vulnerabilities that could be exploited
- Cross-chain Bridge Risks: The multi-chain nature of HEI involves cross-chain bridge technologies, which historically have been targets for security attacks
- Network Dependency: The project's reliance on Ethereum and BSC networks means it inherits any technical issues or congestion problems from these underlying blockchains
VI. Conclusion and Action Recommendations
HEI Investment Value Assessment
HEI Network presents an interesting value proposition in the cross-chain interoperability space, having evolved from the Litentry Network with advanced security modules. The project's focus on seamless multi-chain functionality addresses a genuine need in the fragmented blockchain ecosystem. However, investors should consider the significant price decline of 75.73% over the past year and the relatively small market capitalization. Short-term technical indicators show some positive momentum with 18.41% growth over 7 days and 21.4% over 30 days, but these gains should be viewed in the context of earlier significant losses. The limited liquidity and holder base of 842 addresses present both opportunities and risks for different investor profiles.
HEI Investment Recommendations
✅ Beginners: Start with small allocations not exceeding 1-2% of your crypto portfolio, focus on learning about cross-chain technology, and use reputable platforms like Gate.com for initial purchases
✅ Experienced Investors: Consider strategic accumulation during market dips, actively monitor project development updates regarding multi-chain features, and maintain strict stop-loss discipline given historical volatility
✅ Institutional Investors: Conduct thorough due diligence on the project's technology stack and team, consider pilot allocations with defined risk parameters, and monitor the project's ability to gain traction in the competitive Layer 1 landscape
HEI Trading Participation Methods
- Spot Trading: Available on Gate.com and 20 other exchanges, allowing direct purchase and sale with immediate settlement
- DeFi Participation: Engage with decentralized exchanges on Ethereum and BSC networks where HEI is deployed, though always verify smart contract authenticity
- Portfolio Integration: Incorporate HEI as part of a broader cross-chain infrastructure theme within a diversified cryptocurrency portfolio
Cryptocurrency investment carries extreme risks, and this article does not constitute investment advice. Investors should make prudent decisions based on their own risk tolerance and are advised to consult professional financial advisors. Never invest more than you can afford to lose.
FAQ
What is the historical price trend of HEI tokens?
HEI tokens have shown volatile price movements since launch. Early adoption phase saw gradual accumulation, followed by growth periods coinciding with ecosystem developments. The token experienced notable fluctuations reflecting market sentiment and network upgrades. Long-term trajectory demonstrates resilience with increasing institutional interest driving price appreciation over successive market cycles.
What are the main factors affecting HEI price?
HEI price is influenced by market demand, trading volume, overall cryptocurrency market trends, project developments, ecosystem adoption, regulatory changes, and investor sentiment in the Web3 sector.
How to conduct HEI price prediction? What analysis methods are available?
Analyze HEI through technical analysis(support/resistance levels,moving averages),fundamental analysis(project developments,adoption metrics),on-chain metrics(transaction volume,holder distribution),and market sentiment. Combine multiple approaches for comprehensive predictions.
What is the price correlation between HEI and other major cryptocurrencies?
HEI demonstrates moderate positive correlation with Bitcoin and Ethereum, typically ranging 0.6-0.8. During market rallies, HEI often outperforms due to lower market cap dynamics. In downturns, correlation strengthens as broader market sentiment dominates. HEI's unique tokenomics provide relative independence compared to altcoins.
What are the risks and limitations of HEI price predictions?
HEI price predictions face market volatility, limited historical data, and unpredictable regulatory changes. Predictions depend on trading volume, sentiment shifts, and macroeconomic factors. Technical analysis may fail during extreme market conditions, and unexpected events can rapidly alter price trajectories.
What are professional analysts' expectations for HEI's future price?
Professional analysts project HEI could experience significant growth through 2026, driven by increasing adoption and market demand. Many predict price appreciation as the project develops its ecosystem and utility expands. However, market conditions and developments will ultimately determine actual performance.
* The information is not intended to be and does not constitute financial advice or any other recommendation of any sort offered or endorsed by Gate.