This comprehensive analysis examines HONEY's market position and investment potential through 2031, providing professional price forecasts and practical strategies for crypto investors. The article reviews HONEY's trading history since its 2023 launch, current market metrics including a $33.36 million market cap and $0.00601 price level, and key sentiment indicators revealing cautious market conditions. A detailed breakdown of price predictions spans from 2026 through 2031, ranging from conservative estimates of $0.00337 to optimistic scenarios reaching $0.01164. The guide covers three investment methodologies including long-term holding and active trading strategies, alongside comprehensive risk management frameworks addressing asset allocation, portfolio diversification, and secure storage solutions via Gate Web3 Wallet. Essential regulatory, technical, and market risks are thoroughly examined, equipping investors with knowledge to make informed decisions about HONEY's decentralized mapping infrastructure a
Introduction: HONEY's Market Position and Investment Value
Hivemapper (HONEY), as a decentralized mapping network powered by community contributions, has been developing its unique position in the blockchain and geospatial data sectors since its launch in 2023. As of 2026, HONEY maintains a market capitalization of approximately $33.36 million, with a circulating supply of around 5.55 billion tokens, and the price is currently hovering around $0.00601. This asset, recognized as an innovative solution in the decentralized mapping ecosystem, is playing an increasingly significant role in industries such as logistics, urban planning, and infrastructure development.
This article will comprehensively analyze HONEY's price trends from 2026 to 2031, combining historical patterns, market supply and demand dynamics, ecosystem development, and macroeconomic factors to provide investors with professional price forecasts and practical investment strategies.
I. HONEY Price History Review and Market Status
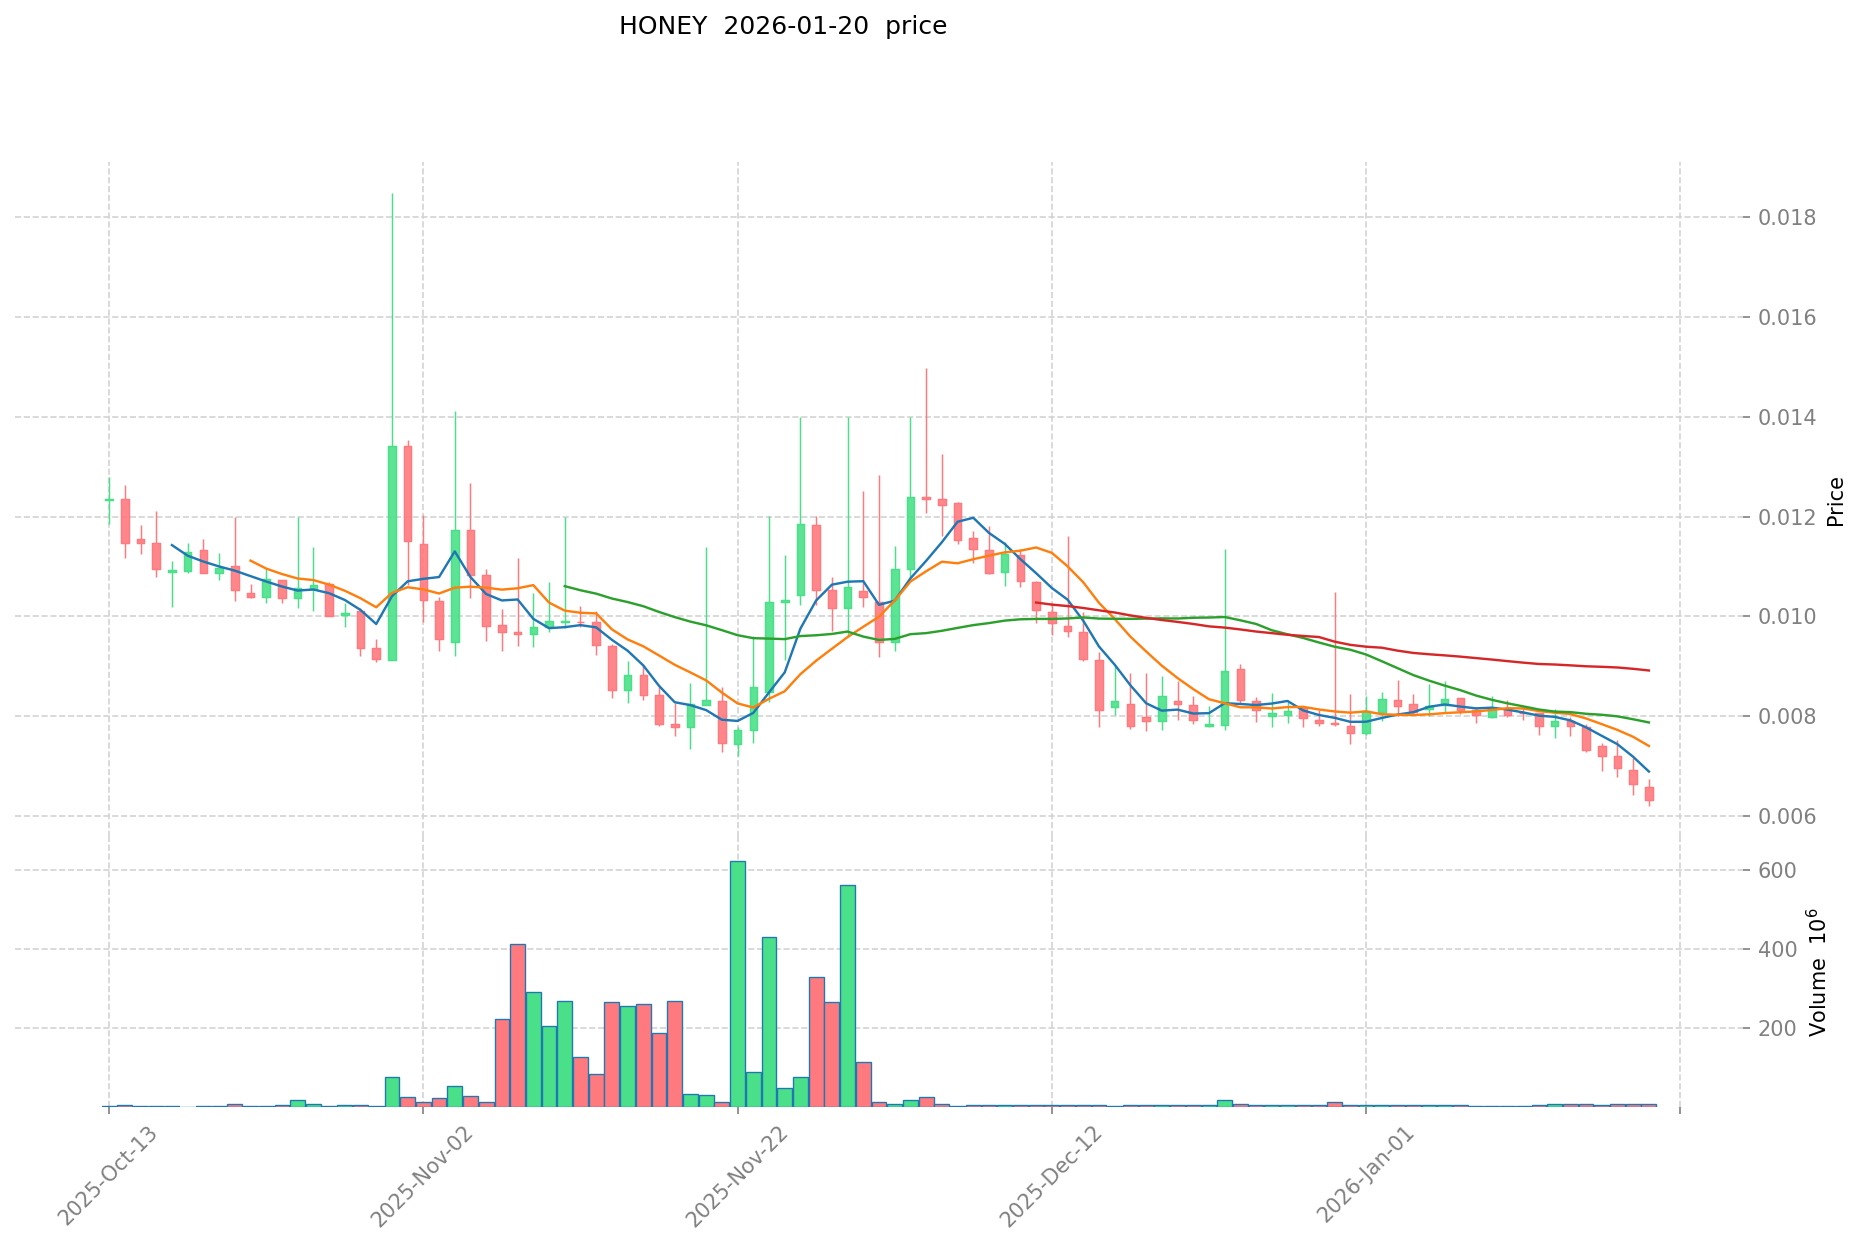
HONEY Historical Price Evolution Trajectory
- February 2023: HONEY officially launched with an initial offering price of $0.07, marking the beginning of its journey in the decentralized mapping sector
- December 2024: The token reached a notable price level of $0.14222 on December 2nd, representing a significant appreciation from its launch price
- January 2026: Market experienced considerable volatility, with the price declining to $0.005768 on January 20th, reflecting broader market adjustments
HONEY Current Market Situation
As of January 21, 2026, HONEY is trading at $0.00601, demonstrating a recovery from its recent low point. The token has shown a 1.04% increase over the past hour, though it remains down 6.48% over the 24-hour period. The 7-day and 30-day performance indicators show declines of 24.68% and 26.68% respectively.
The market capitalization stands at approximately $33.36 million, with a 24-hour trading volume of $25,828.22. HONEY currently holds the 669th position in market rankings. The circulating supply represents approximately 55.51% of the total supply, with 5.55 billion tokens in circulation out of a maximum supply of 10 billion tokens. The fully diluted market cap is calculated at $39.19 million.
The token maintains listings on 8 exchanges and has attracted a community of 91,019 holders. Current market sentiment indicators suggest a cautious environment, with the crypto fear and greed index registering at 32, indicating a fear sentiment among market participants. The 24-hour price range has fluctuated between $0.005768 and $0.006418, reflecting active trading dynamics.
Click to view current HONEY market price
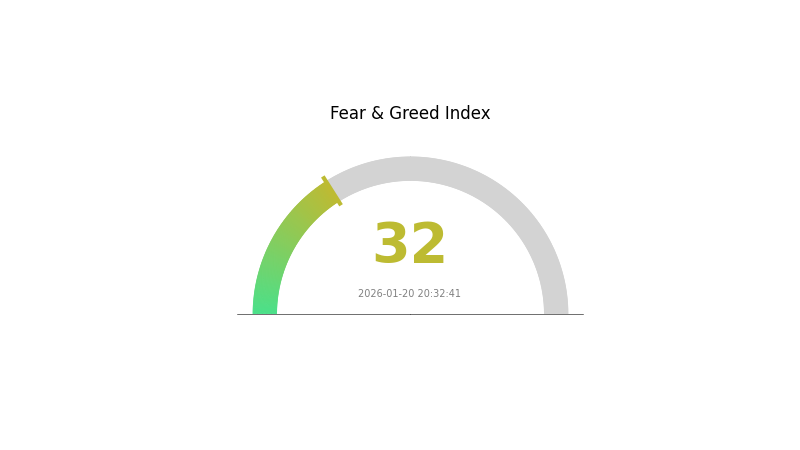
HONEY Market Sentiment Indicator
2026-01-20 Fear and Greed Index: 32 (Fear)
Click to view current Fear & Greed Index
The cryptocurrency market is currently exhibiting significant fear sentiment with an index reading of 32. This indicates investors are taking a cautious stance, with heightened anxiety about market conditions and potential downside risks. During periods of fear, experienced traders often view pullbacks as buying opportunities, while risk-averse investors may consider reducing exposure. Market participants should monitor key support levels and remain vigilant about macroeconomic factors that could further influence sentiment. The current environment warrants careful position management and diversification strategies.
HONEY Holdings Distribution
The holdings distribution chart reflects the allocation of tokens across different wallet addresses, serving as a key indicator of token concentration and decentralization level. According to the latest on-chain data, the top 5 addresses collectively hold 1,582,496.60K HONEY tokens, representing 24.25% of the total supply, while the remaining 75.75% is distributed among other addresses. This distribution pattern reveals a relatively balanced structure, with no single address holding more than 10% of the total supply.
The largest holder controls 622,988.06K tokens (9.55%), followed by the second-largest with 293,469.50K tokens (4.50%). The significant gap between the top holder and subsequent addresses suggests a relatively dispersed whale distribution rather than extreme concentration. The fact that over three-quarters of the supply is held by addresses outside the top 5 indicates a healthier degree of token distribution compared to many newly launched projects, where top holders often control 40-60% of the supply.
From a market structure perspective, this moderate concentration level presents both opportunities and considerations. The current distribution reduces the risk of severe price manipulation by any single entity, while the presence of larger holders still provides necessary liquidity depth for market operations. The relatively decentralized nature suggests that HONEY has achieved meaningful community distribution, which typically contributes to more stable price discovery and reduces the likelihood of catastrophic sell-offs from concentrated whale positions.
Click to view current HONEY Holdings Distribution
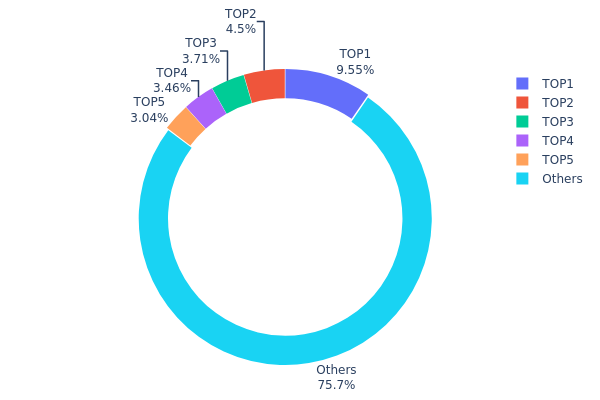
| Top |
Address |
Holding Qty |
Holding (%) |
| 1 |
ERo2hR...RgKLvN |
622988.06K |
9.55% |
| 2 |
EyBXvV...C6dkQ3 |
293469.50K |
4.50% |
| 3 |
FZ9diF...Vzqyjk |
241665.64K |
3.70% |
| 4 |
A6zNJC...6dUU3y |
225862.60K |
3.46% |
| 5 |
8MgKUj...bCiwfS |
198510.80K |
3.04% |
| - |
Others |
4938406.61K |
75.75% |
II. Core Factors Affecting HONEY's Future Price
Based on the available information, there is insufficient data to provide a comprehensive analysis of the core factors affecting HONEY's future price. The reference materials do not contain specific information about HONEY's supply mechanisms, institutional dynamics, macroeconomic positioning, or technical development roadmap.
Without verified data on supply distribution, major holder activities, technological upgrades, or ecosystem applications, we cannot make substantiated claims about price drivers. A thorough analysis would require access to official project documentation, on-chain metrics, and verified market data.
Investors interested in HONEY should conduct independent research through official channels and consult multiple verified sources before making any investment decisions.
III. 2026-2031 HONEY Price Forecast
2026 Outlook
- Conservative forecast: $0.00337 - $0.00601
- Neutral forecast: approximately $0.00601
- Optimistic forecast: up to $0.00721 (subject to favorable market conditions)
2027-2029 Mid-term Outlook
- Market stage expectation: The token may enter a gradual stabilization phase with modest growth potential as the project matures and gains wider market recognition.
- Price range forecast:
- 2027: $0.00337 - $0.00688, with an average around $0.00661
- 2028: $0.00492 - $0.00715, averaging approximately $0.00674
- 2029: $0.00479 - $0.00757, with an average of $0.00695
- Key catalysts: Expected price changes show progressive growth from 10% in 2027 to 15% by 2029, suggesting potential improvements in project fundamentals, ecosystem development, or broader cryptocurrency market recovery.
2030-2031 Long-term Outlook
- Baseline scenario: $0.00530 - $0.01038 by 2030 (assuming continued project development and stable market conditions)
- Optimistic scenario: $0.00758 - $0.01164 by 2031 (with accelerated adoption and positive market sentiment)
- Transformative scenario: reaching the upper range near $0.01164 in 2031 would represent approximately 46% growth, potentially driven by significant ecosystem expansion or major partnership announcements
- January 21, 2026: HONEY trading at estimated average of $0.00601 (baseline projection for current year)
| Year |
Predicted High Price |
Predicted Average Price |
Predicted Low Price |
Price Change |
| 2026 |
0.00721 |
0.00601 |
0.00337 |
0 |
| 2027 |
0.00688 |
0.00661 |
0.00337 |
10 |
| 2028 |
0.00715 |
0.00674 |
0.00492 |
12 |
| 2029 |
0.00757 |
0.00695 |
0.00479 |
15 |
| 2030 |
0.01038 |
0.00726 |
0.0053 |
20 |
| 2031 |
0.01164 |
0.00882 |
0.00758 |
46 |
IV. HONEY Professional Investment Strategies and Risk Management
HONEY Investment Methodology
(I) Long-term Holding Strategy
- Suitable for: Investors who believe in decentralized mapping infrastructure and DePIN (Decentralized Physical Infrastructure Networks) ecosystem growth
- Operational Recommendations:
- Consider accumulating during market corrections when price approaches support levels
- Monitor network growth metrics including active contributors and mapping coverage expansion
- Implement secure storage solutions using Gate Web3 Wallet for SPL20 token management
(II) Active Trading Strategy
- Technical Analysis Tools:
- Volume Analysis: Monitor the 24-hour trading volume of approximately 25,828 USDT to assess market liquidity and trading interest
- Support and Resistance Levels: Track the 24-hour range between 0.005768 and 0.006418 to identify potential entry and exit points
- Swing Trading Considerations:
- Recent price volatility shows a 24.68% decline over 7 days, suggesting opportunities for short-term traders to capitalize on market fluctuations
- Monitor correlation with broader DePIN sector trends and Solana ecosystem performance
HONEY Risk Management Framework
(I) Asset Allocation Principles
- Conservative Investors: 1-2% of crypto portfolio allocation
- Aggressive Investors: 3-5% of crypto portfolio allocation
- Professional Investors: Up to 8-10% with active monitoring and hedging strategies
(II) Risk Hedging Solutions
- Portfolio Diversification: Balance HONEY exposure with established cryptocurrencies and other DePIN projects
- Position Sizing: Implement gradual entry strategies rather than lump-sum investments given recent price volatility
(III) Secure Storage Solutions
- Recommended Wallet: Gate Web3 Wallet with native SPL20 token support for Solana-based assets
- Cold Storage Option: Hardware wallet solutions compatible with Solana network for long-term holdings
- Security Precautions: Enable two-factor authentication, verify contract address (4vMsoUT2BWatFweudnQM1xedRLfJgJ7hswhcpz4xgBTy), and never share private keys or seed phrases
V. HONEY Potential Risks and Challenges
HONEY Market Risks
- High Volatility: The token has experienced a 90.63% decline over the past year and a 26.68% drop in the last 30 days, indicating significant price instability
- Limited Liquidity: With a relatively modest 24-hour trading volume and market capitalization of approximately 33.36 million USDT, large trades may experience slippage
- Market Cap to FDV Ratio: At 55.51%, there remains substantial token supply yet to enter circulation, which could create selling pressure
HONEY Regulatory Risks
- DePIN Sector Uncertainty: Decentralized physical infrastructure networks operate in an evolving regulatory landscape that may face scrutiny regarding data collection and privacy
- Geographic Restrictions: Mapping data collection may encounter regulatory challenges in jurisdictions with strict data sovereignty requirements
- Token Classification: Potential regulatory changes regarding utility token classification could impact HONEY's operational model
HONEY Technical Risks
- Smart Contract Dependencies: As an SPL20 token on Solana, HONEY is subject to the underlying blockchain's technical stability and network performance
- Adoption Challenges: The project's success depends on continuous growth of the contributor network and sustained demand from mapping data customers
- Competitive Pressure: Traditional mapping services and emerging decentralized alternatives may impact Hivemapper's market position and HONEY token utility
VI. Conclusion and Action Recommendations
HONEY Investment Value Assessment
HONEY represents an innovative approach to decentralized mapping infrastructure with real-world utility, serving clients including three of the world's top 10 mapping companies. The project addresses genuine market demand for fresh mapping data in logistics, urban planning, and infrastructure development. However, investors should carefully weigh the project's long-term potential against significant short-term risks, including substantial price depreciation, market volatility, and the challenges of scaling a crowdsourced mapping network. The current price of 0.00601 USDT reflects market uncertainty but may present opportunities for those with high risk tolerance and strong conviction in the DePIN sector's future.
HONEY Investment Recommendations
✅ Beginners: Limit exposure to a small percentage of overall portfolio, thoroughly research the DePIN sector, and only invest amounts you can afford to lose given the token's high volatility
✅ Experienced Investors: Consider dollar-cost averaging during periods of market stabilization, monitor network growth metrics and customer adoption rates, and maintain strict risk management protocols
✅ Institutional Investors: Conduct comprehensive due diligence on Hivemapper's business model, evaluate token economics and unlock schedules, and assess correlation with broader Solana ecosystem performance
HONEY Trading Participation Methods
- Spot Trading: Access HONEY trading pairs on Gate.com with competitive fees and deep liquidity
- Web3 Wallet Integration: Utilize Gate Web3 Wallet for direct interaction with Solana-based decentralized applications and seamless asset management
- Research and Monitoring: Leverage Gate.com's research tools and real-time market data to make informed trading decisions
Cryptocurrency investment carries extremely high risks, and this article does not constitute investment advice. Investors should make prudent decisions based on their own risk tolerance and are advised to consult professional financial advisors. Never invest more than you can afford to lose.
FAQ
What is HONEY? What are its main uses?
HONEY is a utility token designed for decentralized finance ecosystems. Its primary uses include governance participation, liquidity provision incentives, yield farming rewards, and transaction fee discounts within the protocol. HONEY enables community members to actively participate in platform decision-making and earn sustainable returns.
What are the main factors affecting HONEY price?
HONEY price is primarily influenced by market demand and supply dynamics, trading volume, ecosystem development progress, DeFi yield rates, broader cryptocurrency market sentiment, and adoption growth within the Honey protocol network.
How to predict HONEY price? What analysis methods are available?
Analyze HONEY price through technical analysis(chart patterns,moving averages),fundamental analysis(project updates,market adoption),on-chain metrics(transaction volume,holder distribution),and market sentiment indicators. Monitor trading volume,liquidity changes,and correlation with broader crypto market trends for comprehensive predictions.
What is the historical price trend of HONEY?
HONEY has shown volatility since launch, experiencing growth phases with notable rallies followed by corrections. The token demonstrated resilience through market cycles, reaching multiple peaks as adoption increased. Long-term trend analysis suggests potential for continued appreciation as ecosystem utility expands and community engagement strengthens.
What are the risks of investing in HONEY?
HONEY investment risks include market volatility, liquidity fluctuations, regulatory uncertainty in crypto sectors, smart contract vulnerabilities, and potential project development delays. Monitor market conditions and diversify your portfolio accordingly.
What advantages does HONEY have compared to similar assets?
HONEY offers superior liquidity, lower transaction fees, and faster settlement times. Its innovative tokenomics provide sustainable yield generation, while community-driven governance ensures transparent development and long-term value appreciation potential.
* The information is not intended to be and does not constitute financial advice or any other recommendation of any sort offered or endorsed by Gate.