This comprehensive analysis examines Hooked Protocol (HOOK), a Web3 infrastructure token currently trading at $0.0356 with 11.39M market cap, offering detailed price forecasts through 2031. The article evaluates HOOK's market position, analyzing historical performance, current holdings distribution, and sentiment indicators amid extreme fear conditions. Professional price predictions range from conservative scenarios maintaining current levels to optimistic outlooks reaching $0.07193 by 2031. The guide provides tailored investment strategies for beginners through institutional investors, implementing risk management frameworks with recommended 1-8% portfolio allocation based on risk tolerance. Critical risk factors including price volatility, liquidity constraints, regulatory uncertainty, and token supply pressure are thoroughly examined. Investors gain actionable trading methodologies, secure storage solutions on Gate ecosystem, and ecosystem participation recommendations for informed HOOK investment decisio
Introduction: HOOK's Market Position and Investment Value
Hooked Protocol (HOOK), positioned as Web3 infrastructure for mass adoption, has been serving the blockchain education and gamification sector since its launch in 2022. With its flagship product "Wild Cash" achieving over 2 million monthly active users through its innovative "learn-and-earn" model, the project has demonstrated notable traction in onboarding mainstream users to Web3. As of January 2026, HOOK maintains a market capitalization of approximately $11.39 million, with a circulating supply of 320 million tokens out of a maximum supply of 500 million, trading at around $0.0356. This governance token, which also serves as the access key to community activities and exclusive NFT privileges within the Hooked ecosystem, is playing a role in bridging traditional users with decentralized applications.
This article provides a comprehensive analysis of HOOK's price trajectory from 2026 through 2031, examining historical patterns, market supply-demand dynamics, ecosystem development milestones, and broader macroeconomic conditions to offer investors professional price projections and practical investment strategies.
I. HOOK Price History Review and Market Status
HOOK Historical Price Evolution Trajectory
- 2023: Hooked Protocol launched in the market with an initial offering price of $0.1, subsequently experiencing significant volatility with price movements reaching $4.07 during February 2023
- 2023-2024: The token underwent a notable correction phase following its initial peak performance
- 2025: Market conditions led to price adjustments, with the token experiencing downward pressure throughout the year
HOOK Current Market Landscape
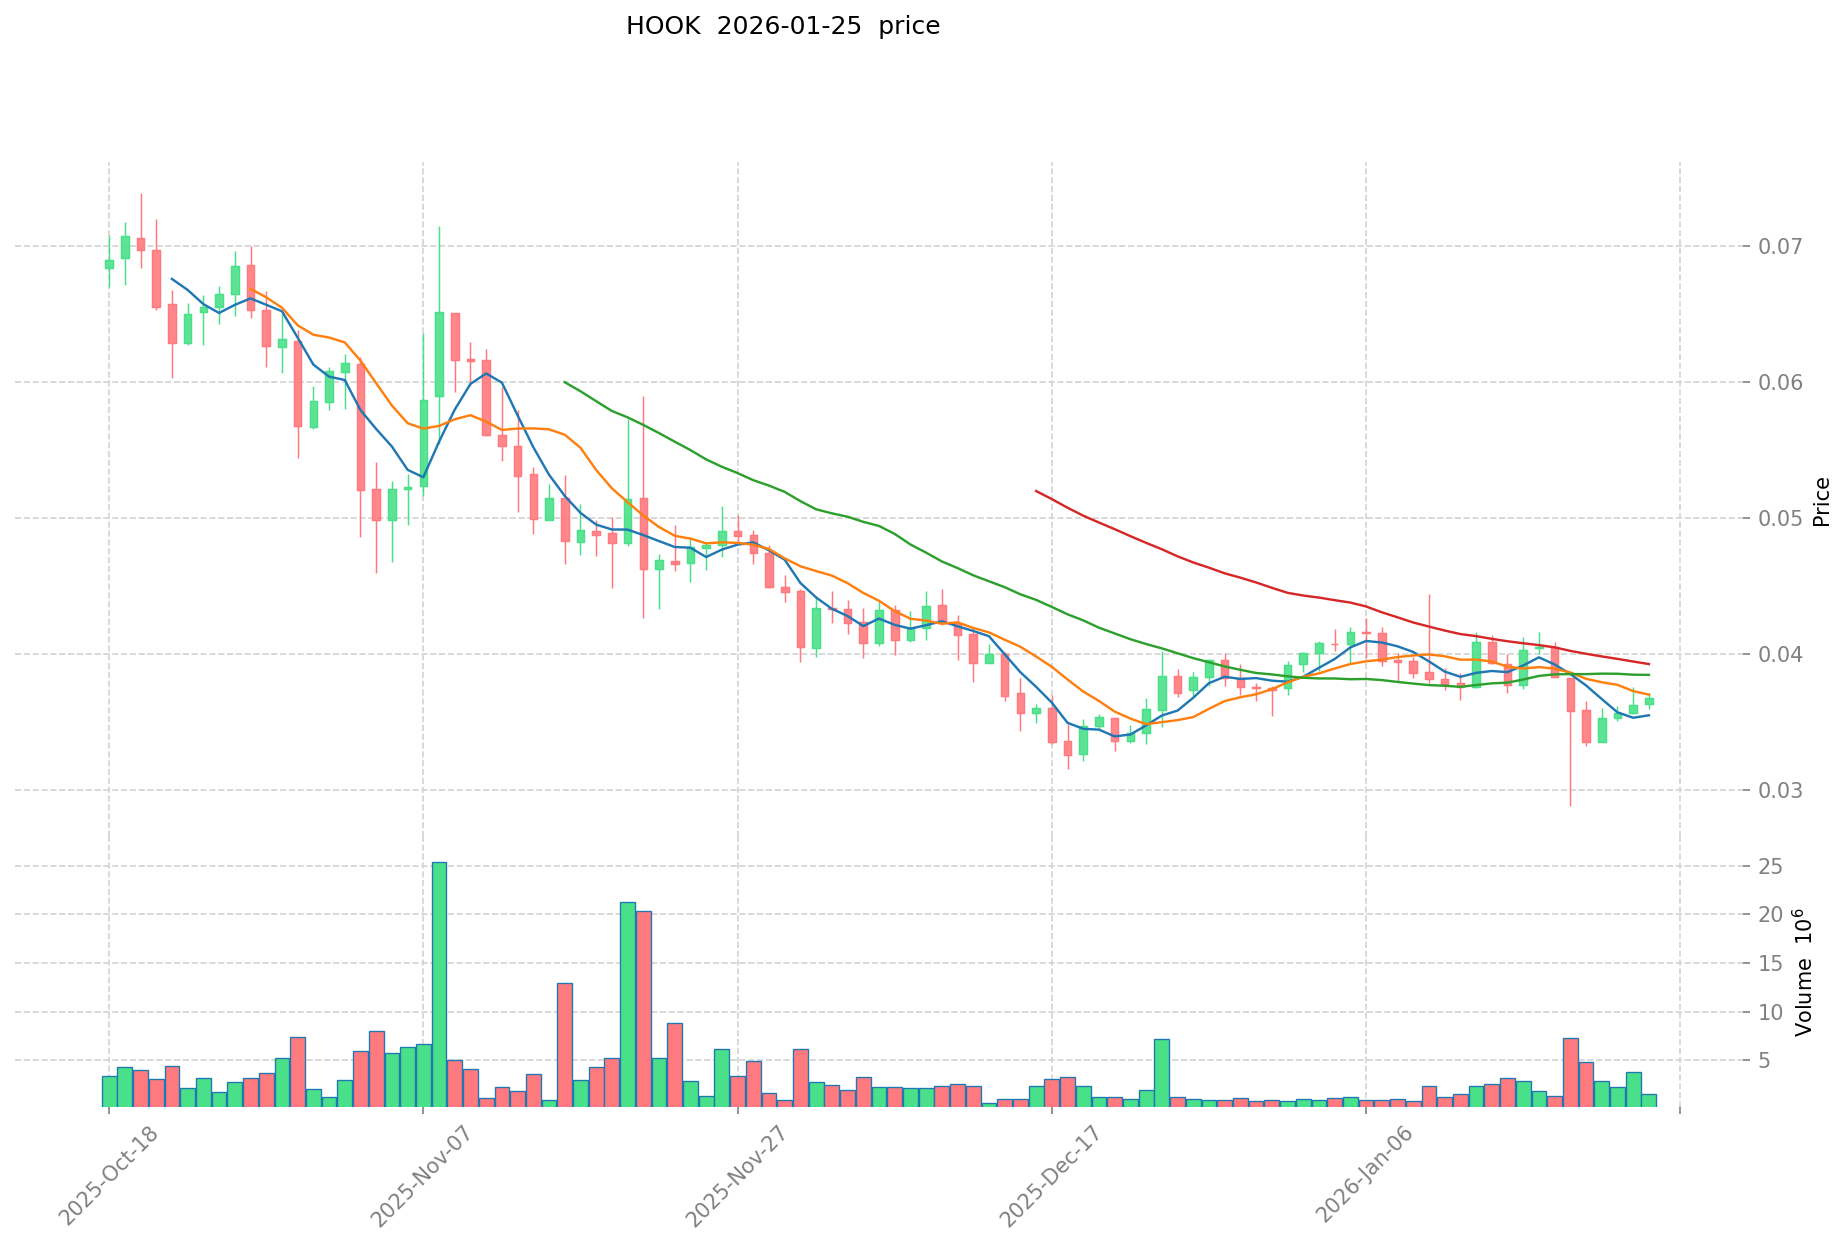
As of January 25, 2026, HOOK is trading at $0.0356, representing a decline of 2.93% over the past 24 hours. The token has experienced broader price movements across different timeframes, with a 12.16% decrease over the past 7 days and a 7.16% decline over the past 30 days.
The 24-hour trading range has been between $0.03545 and $0.03782, indicating moderate intraday volatility. The current trading volume stands at approximately $106,877, reflecting ongoing market activity.
HOOK maintains a circulating supply of 320 million tokens out of a maximum supply of 500 million tokens, representing a circulation ratio of approximately 64%. The current market capitalization is approximately $11.39 million, with a fully diluted market capitalization of $17.8 million.
The token is primarily deployed on the BSC (BNB Smart Chain) network, with the contract address 0xa260E12d2B924cb899AE80BB58123ac3fEE1E2F0. The project has maintained presence across 26 exchanges and serves a holder base of over 220,000 addresses.
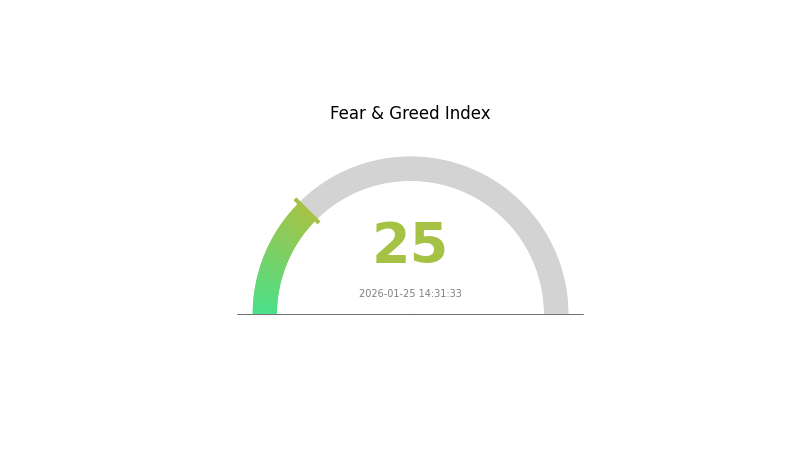
Current market sentiment indicators suggest cautious positioning among participants, with the VIX index at 25, corresponding to an "Extreme Fear" market condition. HOOK's market dominance stands at 0.00056% of the total cryptocurrency market.
Click to view current HOOK market price
HOOK Market Sentiment Index
2026-01-25 Fear and Greed Index: 25 (Extreme Fear)
Click to view current Fear & Greed Index
The cryptocurrency market is currently experiencing extreme fear, with the Fear and Greed Index standing at 25. This indicates severe market pessimism and heightened risk aversion among investors. During periods of extreme fear, market volatility typically increases, creating both significant risks and potential opportunities for contrarian traders. Investors should exercise caution and conduct thorough research before making trading decisions. This sentiment level often precedes market reversals, making it a critical moment for strategic portfolio evaluation on Gate.com.
HOOK Holdings Distribution
The holdings distribution chart is a critical on-chain metric that reveals how token supply is distributed across different wallet addresses, providing insight into the concentration of ownership and potential market power dynamics. By analyzing the percentage of total supply held by top addresses, investors can assess decentralization levels and identify potential risks associated with whale manipulation or coordinated selling pressure.
According to the current data, HOOK exhibits a moderately concentrated holdings structure. The top five addresses collectively control approximately 55.1% of the total circulating supply, with the largest holder possessing 12.55% (62,775.71K HOOK) and the second-largest holding 12.06% (60,334.21K HOOK). The remaining 44.9% is distributed among other addresses, suggesting a relatively balanced distribution between major holders and the broader community. While this concentration level is not extreme compared to some emerging tokens, it does indicate that a significant portion of supply remains in the hands of a limited number of entities, which could potentially be early investors, project team members, or institutional participants.
This distribution pattern presents both opportunities and considerations for market participants. On one hand, the presence of substantial "Others" category (44.9%) demonstrates reasonable token dispersion and suggests a growing retail and mid-tier holder base, which contributes to market liquidity and organic price discovery. On the other hand, the combined holdings of top five addresses mean that coordinated movements by these major holders could significantly impact price volatility and market sentiment. The relatively even distribution among the top addresses (ranging from 9.58% to 12.55%) reduces the risk of single-entity dominance, but collective action remains a theoretical concern for market stability.
Click to view current HOOK Holdings Distribution

| Top |
Address |
Holding Qty |
Holding (%) |
| 1 |
0x5a52...70efcb |
62775.71K |
12.55% |
| 2 |
0xf977...41acec |
60334.21K |
12.06% |
| 3 |
0x7c26...8e108c |
56666.66K |
11.33% |
| 4 |
0x008c...c265fd |
47916.67K |
9.58% |
| 5 |
0xfb6b...0c1515 |
47916.67K |
9.58% |
| - |
Others |
224390.09K |
44.9% |
II. Core Factors Affecting HOOK's Future Price
Based on the available materials, there is insufficient data to provide a comprehensive analysis of the core factors affecting HOOK's future price at this time. The analysis of supply mechanisms, institutional dynamics, macroeconomic environment, and technological developments requires specific information about the token's tokenomics, market positioning, and ecosystem development, which are not present in the provided materials.
For a thorough evaluation of HOOK's price trajectory, investors should monitor official project announcements, on-chain data analytics, and reputable cryptocurrency research platforms for updates on token supply changes, institutional adoption patterns, technical upgrades, and broader market conditions that may impact the asset's valuation.
III. 2026-2031 HOOK Price Prediction
2026 Outlook
- Conservative prediction: $0.0305 - $0.03547
- Neutral prediction: $0.03547
- Optimistic prediction: $0.03866 (subject to favorable market conditions)
2027-2029 Outlook
- Market stage expectation: Transitional phase with gradual price appreciation as the project matures and establishes stronger market presence
- Price range predictions:
- 2027: $0.02187 - $0.0493
- 2028: $0.03757 - $0.05182
- 2029: $0.0361 - $0.06223
- Key catalysts: Platform development milestones, ecosystem expansion, and broader adoption within the education technology sector
2030-2031 Long-term Outlook
- Baseline scenario: $0.03237 - $0.05486 (assuming steady market conditions and consistent project development)
- Optimistic scenario: $0.05486 - $0.07022 (contingent upon accelerated adoption and favorable regulatory environment)
- Transformational scenario: $0.07193 (requires exceptional market momentum, significant partnerships, and widespread platform integration)
- 2026-01-25: HOOK maintains a moderate price trajectory with potential for gradual appreciation over the forecast period
| Year |
Predicted High Price |
Predicted Average Price |
Predicted Low Price |
Price Change |
| 2026 |
0.03866 |
0.03547 |
0.0305 |
0 |
| 2027 |
0.0493 |
0.03707 |
0.02187 |
4 |
| 2028 |
0.05182 |
0.04318 |
0.03757 |
21 |
| 2029 |
0.06223 |
0.0475 |
0.0361 |
33 |
| 2030 |
0.07022 |
0.05486 |
0.03237 |
54 |
| 2031 |
0.07193 |
0.06254 |
0.05441 |
75 |
IV. HOOK Professional Investment Strategy and Risk Management
HOOK Investment Methodology
(1) Long-term Holding Strategy
- Suitable for: Investors focusing on Web3 infrastructure development and ecosystem growth
- Operational Recommendations:
- Consider accumulating positions during market consolidation phases, given HOOK's role in Web3 education and onboarding infrastructure
- Monitor ecosystem expansion metrics, particularly user growth in Wild Cash and other Hooked Protocol applications
- Utilize Gate Web3 Wallet for secure token storage with native BSC support
(2) Active Trading Strategy
- Technical Analysis Tools:
- Volume Analysis: Monitor 24-hour trading volume (currently $106,877) alongside price movements to identify potential breakout opportunities
- Moving Averages: Track short-term and long-term trends, considering the token's -12.16% weekly performance
- Swing Trading Considerations:
- Observe price action within the current range between $0.03545 and $0.03782
- Consider the 64% market cap to FDV ratio when evaluating potential dilution impacts
HOOK Risk Management Framework
(1) Asset Allocation Principles
- Conservative Investors: 1-3% of crypto portfolio allocation
- Moderate Investors: 3-5% of crypto portfolio allocation
- Experienced Investors: 5-8% of crypto portfolio allocation, with active monitoring
(2) Risk Hedging Approaches
- Portfolio Diversification: Balance HOOK holdings with established infrastructure tokens and stablecoins
- Position Sizing: Implement gradual entry strategies rather than single large positions
(3) Secure Storage Solutions
- Recommended Option: Gate Web3 Wallet supporting BSC network for native HOOK token management
- Hardware Wallet Integration: For larger holdings, consider cold storage solutions compatible with BSC assets
- Security Considerations: Verify contract address (0xa260E12d2B924cb899AE80BB58123ac3fEE1E2F0) before transactions, enable two-factor authentication, and maintain secure backup of recovery phrases
V. HOOK Potential Risks and Challenges
HOOK Market Risks
- Price Volatility: HOOK has experienced an -87.28% decline over one year, indicating substantial volatility exposure
- Liquidity Concerns: With 24-hour trading volume of approximately $106,877, market depth may be limited during high-volatility periods
- Market Sentiment Shifts: Web3 education and infrastructure sectors may experience cyclical interest patterns affecting token demand
HOOK Regulatory Risks
- Web3 Regulatory Evolution: Educational platforms integrating crypto rewards may face evolving compliance requirements across jurisdictions
- Token Classification Uncertainty: Governance and utility token frameworks continue to develop globally, potentially affecting HOOK's operational model
- Regional Access Restrictions: Learn-to-earn mechanisms may encounter regulatory scrutiny in certain markets
HOOK Technical Risks
- Smart Contract Vulnerabilities: BSC-based token operations depend on contract security and network stability
- Token Economics Pressure: With 64% circulation rate (320 million of 500 million total supply), remaining token unlocks could create supply pressure
- Ecosystem Dependency: Project success relies heavily on continued adoption of Wild Cash and other Hooked Protocol applications
VI. Conclusion and Action Recommendations
HOOK Investment Value Assessment
Hooked Protocol presents a specialized investment opportunity within the Web3 education and onboarding infrastructure sector. With over 2 million monthly active users on its Wild Cash platform, the project demonstrates user traction in gamified learning experiences. The dual-token system (HOOK for governance and HGT for ecosystem utility) creates structured tokenomics with burning mechanisms for certain purchases. However, the significant year-over-year price decline (-87.28%) and relatively modest market capitalization of approximately $11.4 million reflect challenges in maintaining token value during broader market downturns. The 64% circulation rate indicates potential future supply releases that investors should monitor.
HOOK Investment Recommendations
✅ Beginners: Start with minimal allocation (under 2% of crypto portfolio) after researching Web3 education sector fundamentals; consider dollar-cost averaging approach
✅ Experienced Investors: Evaluate HOOK as a tactical position (3-5% allocation) contingent on ecosystem growth metrics and user adoption trends; implement stop-loss protocols
✅ Institutional Investors: Conduct thorough due diligence on protocol partnerships, revenue generation models, and long-term infrastructure development roadmap before position sizing
HOOK Trading Participation Methods
- Spot Trading: Access HOOK/USDT pairs on Gate.com with current pricing around $0.0356
- Ecosystem Participation: Engage with Wild Cash and other Hooked Protocol applications to understand utility and user experience firsthand
- Staking Opportunities: Monitor platform announcements for staking programs linked to platform profitability
Cryptocurrency investments carry extreme risk. This article does not constitute investment advice. Investors should make prudent decisions based on their own risk tolerance and are advised to consult professional financial advisors. Never invest more than you can afford to lose.
FAQ
What are the main factors for HOOK token price prediction?
HOOK price predictions are based on market demand, trading volume, ecosystem development, project milestones, regulatory environment, and overall crypto market sentiment.
How to analyze HOOK price trends and what are the common technical indicators?
Analyze HOOK using key technical indicators: Moving Averages (MA) for trend direction, RSI for overbought/oversold conditions, MACD for momentum, Bollinger Bands for volatility, and trading volume for confirmation. Combine chart patterns with these indicators for comprehensive analysis.
What risks should I be aware of when investing in HOOK tokens?
HOOK token investments carry market volatility risk, liquidity risk, and regulatory uncertainty. Price fluctuations can be significant due to market sentiment. Consider your risk tolerance and only invest what you can afford to lose.
What are the differences between HOOK tokens and other mainstream cryptocurrencies?
HOOK distinguishes itself through innovative tokenomics, unique utility within its ecosystem, and specialized use cases. Unlike mainstream cryptocurrencies focused solely on payments, HOOK offers integrated DeFi capabilities, enhanced scalability, and community-driven governance, positioning it as a specialized solution within the Web3 landscape.
What is the fundamental outlook of the HOOK project and what are its future development prospects?
HOOK demonstrates strong fundamentals with innovative blockchain technology integration. The project shows solid growth potential through expanding ecosystem partnerships and increasing transaction volume. Future prospects appear promising with planned feature upgrades and growing market adoption expected to drive long-term value appreciation.
* The information is not intended to be and does not constitute financial advice or any other recommendation of any sort offered or endorsed by Gate.