This comprehensive analysis examines Huobi Token (HT) as a centralized exchange native asset, currently trading at $0.2136 with a market cap of $23.37 million as of January 2026. The article evaluates HT's historical price trajectory from its 2018 launch through its May 2021 peak of $39.66, followed by an 80.62% decline to current levels. A detailed price outlook spanning 2026-2031 projects potential ranges based on market conditions, ecosystem development, and regulatory clarity. The guide addresses core investment considerations including dollar-cost averaging strategies, active trading methodologies, and asset allocation frameworks suitable for different investor profiles. Critical risk factors including extreme volatility, concentrated token distribution (97.63% held by top two addresses), and limited trading volume require careful risk management. Comprehensive recommendations guide beginners, experienced traders, and institutional participants through secure trading on Gate.com with appropriate position
Introduction: HT's Market Position and Investment Value
HuobiToken (HT), serving as the global ecosystem points of the Huobi platform, has been an integral part of the crypto ecosystem since its launch in 2018. As of 2026, HT maintains a market capitalization of approximately $23.37 million with a circulating supply of around 109.4 million tokens, trading at approximately $0.2136. This decentralized digital asset, originally based on Ethereum with a total supply limited to 500 million tokens, plays a significant role in supporting the operational framework of the Huobi ecosystem.
This article will comprehensively analyze HT's price trends from 2026 to 2031, combining historical patterns, market supply and demand dynamics, ecosystem development, and macroeconomic conditions to provide investors with professional price forecasts and practical investment strategies. Despite experiencing notable volatility over the past year with an 80.62% decline from its historical high of $39.66 reached in May 2021, HT continues to serve multiple functions within the Huobi ecosystem, offering holders various rights and benefits including token rewards and value appreciation through buyback and burn mechanisms.
I. HT Price History Review and Market Status
HT Historical Price Evolution Trajectory
- 2018: HT launched with an initial price of $1.49, establishing its foundation as the Huobi ecosystem token
- 2021: Market reached peak momentum in May, with HT achieving an all-time high of $39.66 on May 12th during the broader cryptocurrency market uptrend
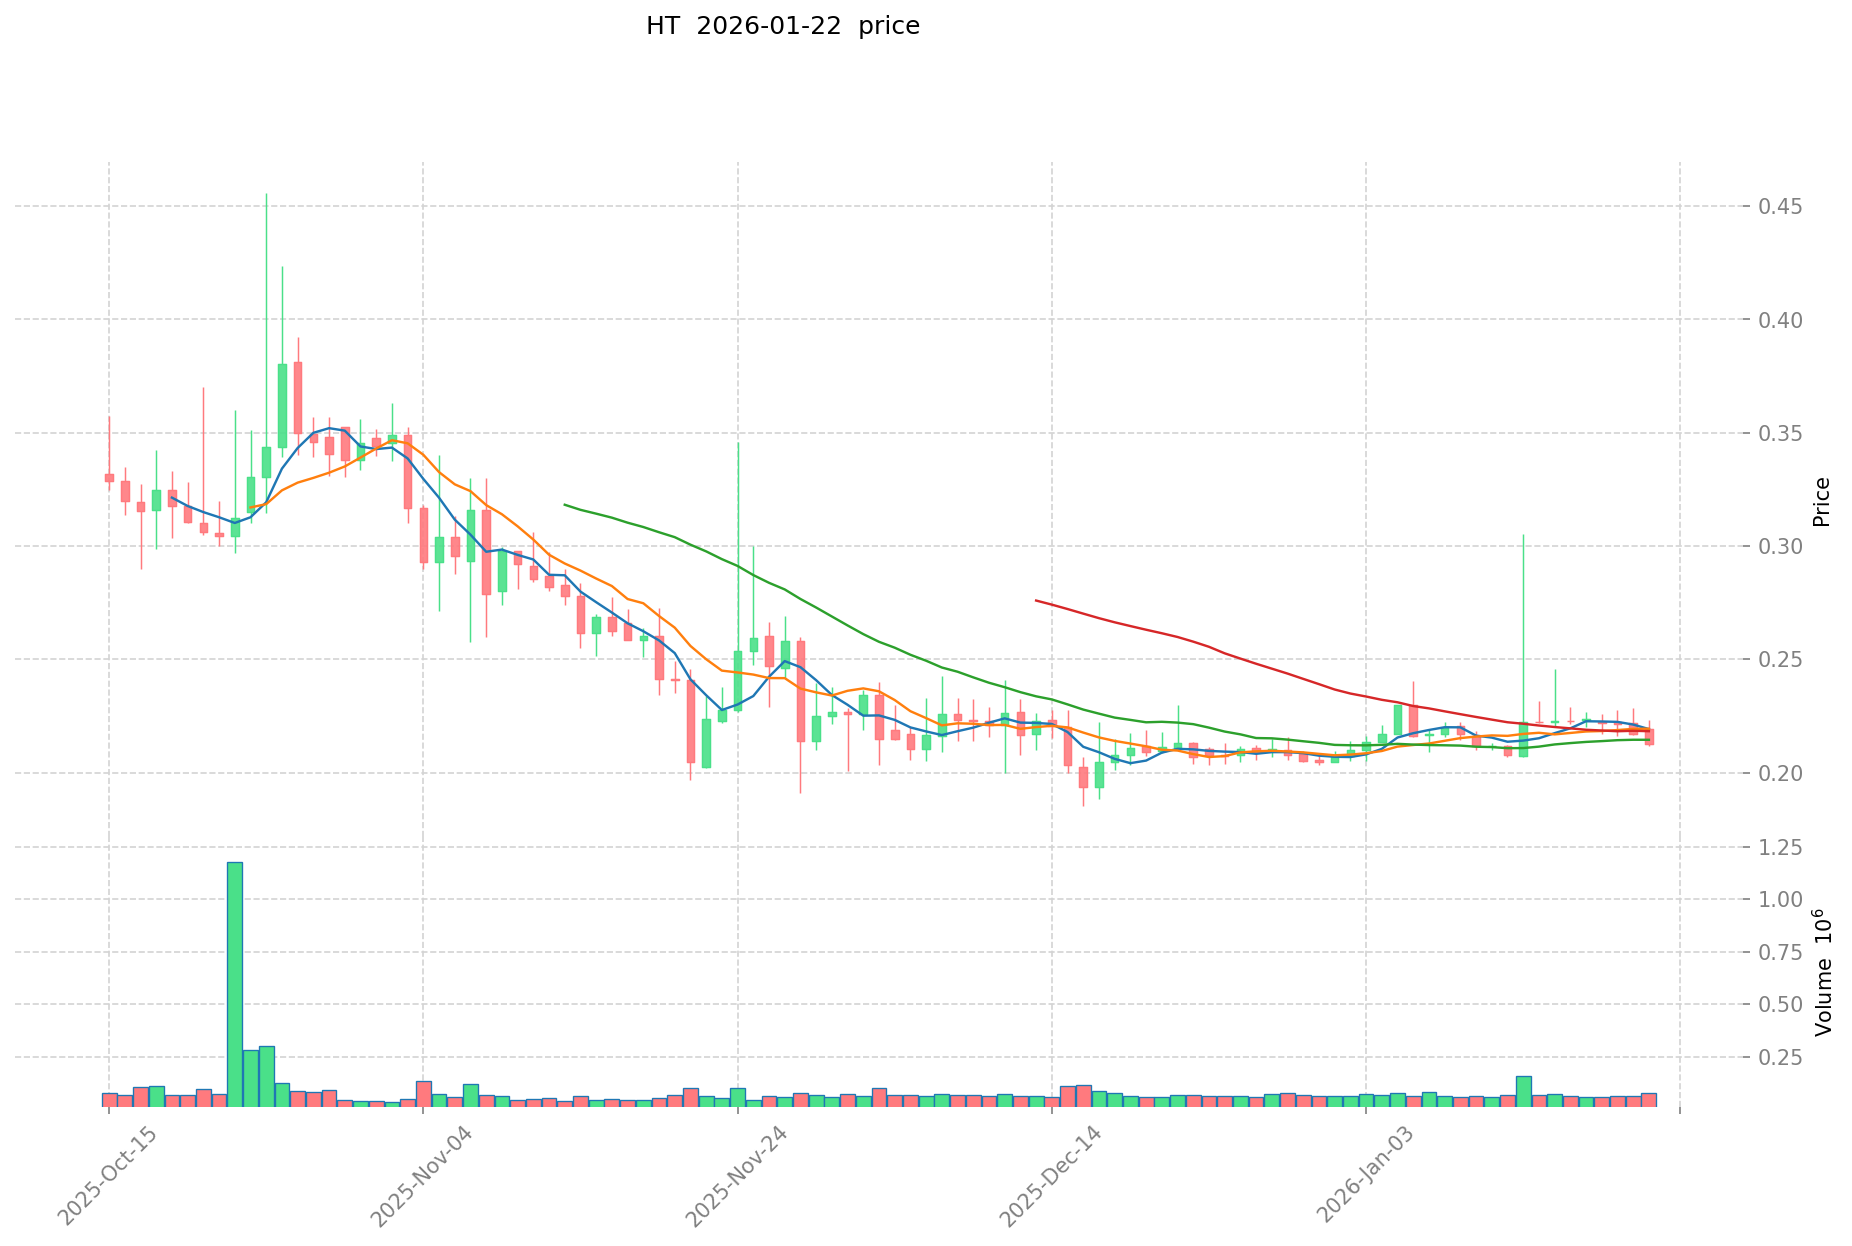
- 2025-2026: Market underwent substantial correction, with price declining from historical peaks to $0.145929 on June 22, 2025, marking the all-time low, before recovering to current levels
HT Current Market Dynamics
As of January 22, 2026, HT is trading at $0.2136, showing a modest 24-hour increase of 0.32% with the price ranging between $0.2118 and $0.2151. The token's 24-hour trading volume stands at $12,636.35, reflecting limited market activity.
The token's market capitalization has contracted to approximately $23.37 million, with a circulating supply of 109.40 million HT tokens representing 21.88% of the total supply of 204 million tokens. The fully diluted market cap reaches $43.57 million based on a maximum supply cap of 500 million tokens. HT currently holds a market dominance of 0.0013% and ranks at position 813 in the cryptocurrency market.
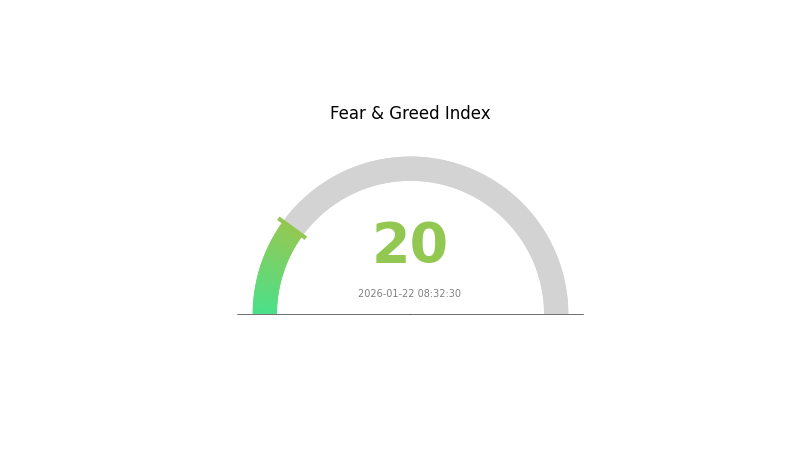
Over different timeframes, HT has displayed varied performance patterns: declining 0.0027% in the past hour, dropping 3.86% over the past week, gaining 2.69% over the past month, while experiencing a substantial 80.62% decline over the past year. The token is trading approximately 99.46% below its all-time high, indicating significant distance from previous peak valuations. The market sentiment index currently registers at 20, indicating an environment of extreme fear among market participants.
Click to view current HT market price
HT Market Sentiment Indicator
2026-01-22 Fear and Greed Index: 20 (Extreme Fear)
Click to view current Fear & Greed Index
The cryptocurrency market is currently experiencing extreme fear, with the index at 20. This indicates investors are highly pessimistic about market conditions. During such periods, panic selling often intensifies, creating significant downside pressure on asset prices. However, extreme fear historically presents contrarian opportunities for long-term investors, as assets may be substantially undervalued. Risk management remains critical, and position sizing should be carefully considered. Monitor market developments closely on Gate.com for real-time insights and trading opportunities.
HT Holding Distribution
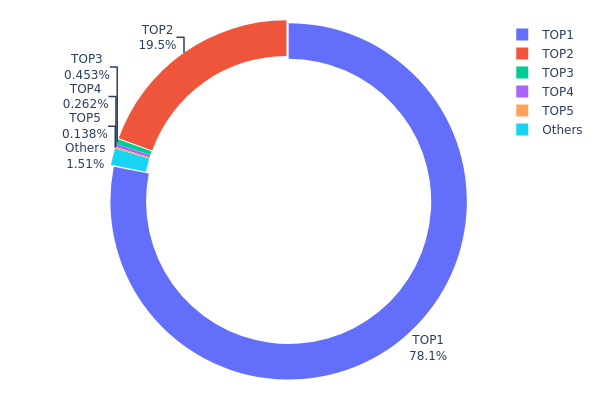
The holding distribution chart visualizes the concentration of token ownership across different address tiers, revealing the degree of decentralization within the network. This metric serves as a critical indicator for assessing market structure stability and potential concentration risks in the ecosystem.
Current data demonstrates an extremely high concentration pattern in HT's holding distribution. The top address holds approximately 390.60 million tokens, representing 78.12% of the total supply, while the second-largest address accounts for 19.51% with 97.59 million tokens. Combined, these two addresses control 97.63% of the entire circulating supply, with the remaining top addresses and others collectively holding merely 2.37%. This distribution structure reveals a highly centralized ownership model that significantly deviates from typical decentralized cryptocurrency networks.
Such concentrated holding distribution presents multiple implications for market dynamics. The overwhelming dominance of top addresses creates substantial price manipulation risks, as large holders possess considerable influence over market liquidity and price discovery mechanisms. This concentration pattern may lead to heightened volatility during periods of token movement, while simultaneously reducing organic trading activity from retail participants. The limited distribution among smaller addresses suggests restricted circulation and potentially constrained ecosystem adoption. From a structural perspective, this centralization fundamentally challenges the decentralized ethos typically associated with blockchain projects, potentially impacting long-term investor confidence and network resilience against single-point failures or coordinated actions by major stakeholders.
Click to view current HT Holding Distribution
| Top |
Address |
Holding Qty |
Holding (%) |
| 1 |
0x0000...000000 |
390604.31K |
78.12% |
| 2 |
0x1870...dda12e |
97585.04K |
19.51% |
| 3 |
0xd004...4bf9d4 |
2267.12K |
0.45% |
| 4 |
0xc882...84f071 |
1309.03K |
0.26% |
| 5 |
0x9fcc...8c19fe |
690.39K |
0.13% |
| - |
Others |
7544.11K |
1.53% |
II. Core Factors Affecting HT's Future Price
Due to the lack of available data in the provided materials regarding HT's supply mechanisms, institutional dynamics, macroeconomic environment, and technical developments, a comprehensive analysis cannot be presented at this time. When relevant information becomes accessible, this section will cover key aspects including supply mechanism changes, institutional holdings, macroeconomic policy impacts, and ecosystem development that may influence HT's price trajectory.
III. 2026-2031 HT Price Forecast
2026 Outlook
- Conservative forecast: $0.14311 - $0.2136
- Neutral forecast: $0.2136
- Optimistic forecast: $0.31826 (requires favorable market conditions and ecosystem expansion)
2027-2029 Outlook
- Market stage expectation: Gradual recovery and moderate growth phase, with price showing steady upward momentum as the crypto market matures
- Price range forecast:
- 2027: $0.17817 - $0.32178 (24% year-over-year growth)
- 2028: $0.25565 - $0.3585 (37% cumulative growth from 2026)
- 2029: $0.18266 - $0.42077 (52% cumulative growth from 2026)
- Key catalysts: Platform development progress, regulatory clarity improvements, and broader adoption of exchange tokens in the ecosystem
2030-2031 Long-term Outlook
- Base scenario: $0.24276 - $0.5266 (assuming sustained platform growth and stable market conditions)
- Optimistic scenario: $0.45004 - $0.53554 (assuming accelerated ecosystem expansion and increased utility implementations)
- Transformative scenario: Above $0.53554 (requires breakthrough platform innovations, major partnerships, and exceptional market conditions)
- 2026-01-22: HT trading within the initial forecast range, establishing foundation for potential multi-year growth trajectory
| Year |
Predicted High Price |
Predicted Average Price |
Predicted Low Price |
Price Change |
| 2026 |
0.31826 |
0.2136 |
0.14311 |
0 |
| 2027 |
0.32178 |
0.26593 |
0.17817 |
24 |
| 2028 |
0.3585 |
0.29385 |
0.25565 |
37 |
| 2029 |
0.42077 |
0.32618 |
0.18266 |
52 |
| 2030 |
0.5266 |
0.37347 |
0.24276 |
74 |
| 2031 |
0.53554 |
0.45004 |
0.23852 |
110 |
IV. HT Professional Investment Strategies and Risk Management
HT Investment Methodology
(1) Long-term Holding Strategy
- Suitable for: Investors seeking exposure to centralized exchange ecosystem tokens with a moderate risk tolerance
- Operational Recommendations:
- Consider dollar-cost averaging to mitigate volatility risks, particularly given HT's significant 80.62% decline over the past year
- Monitor the Huobi Group's ecosystem development and platform utility enhancements that may impact HT's value proposition
- Storage Solution: Utilize Gate Web3 Wallet for secure self-custody with multi-signature options
(2) Active Trading Strategy
- Technical Analysis Tools:
- Volume Analysis: Track the current 24-hour trading volume of approximately $12,636 to identify liquidity patterns and potential breakout signals
- Support and Resistance Levels: Monitor the 24-hour range between $0.2118 (low) and $0.2151 (high) to identify short-term trading opportunities
- Swing Trading Key Points:
- Pay attention to the 7-day price movement (-3.86%) versus the 30-day trend (+2.69%) to identify potential reversal patterns
- Set stop-loss orders to manage downside risk, particularly given the token's proximity to its all-time low of $0.145929
HT Risk Management Framework
(1) Asset Allocation Principles
- Conservative Investors: 1-3% of crypto portfolio allocation
- Aggressive Investors: 5-8% of crypto portfolio allocation
- Professional Investors: Up to 10% with active hedging strategies
(2) Risk Hedging Solutions
- Diversification Strategy: Balance HT holdings with exposure to other exchange tokens and DeFi protocols to reduce platform-specific risk
- Position Sizing: Limit individual position sizes given the token's 21.88% market cap to fully diluted valuation ratio, indicating significant future dilution potential
(3) Secure Storage Solutions
- Hot Wallet Option: Gate Web3 Wallet for active trading positions with enhanced security features
- Cold Storage Approach: Transfer long-term holdings to hardware wallets after purchasing through Gate.com
- Security Considerations: Enable two-factor authentication, regularly update security protocols, and never share private keys or seed phrases
V. HT Potential Risks and Challenges
HT Market Risks
- Extreme Volatility: HT has experienced an 80.62% decline over the past year, demonstrating significant price instability and market sentiment shifts
- Liquidity Concerns: With relatively modest 24-hour trading volume of $12,636, investors may face challenges executing large orders without price slippage
- Historical Performance: The token remains 99.46% below its all-time high of $39.66 reached in May 2021, indicating substantial recovery risk
HT Regulatory Risks
- Exchange Token Classification: Ongoing regulatory scrutiny of centralized exchange tokens may impact HT's utility and trading availability across jurisdictions
- Compliance Requirements: Evolving global regulatory frameworks for cryptocurrency exchanges may affect Huobi Group's operations and HT's value proposition
- Geographic Restrictions: Potential limitations on HT trading and utility in certain regions due to local regulatory policies
HT Technical Risks
- Platform Dependency: HT's value is closely tied to Huobi Group's ecosystem performance and operational continuity
- Smart Contract Vulnerabilities: As an ERC-20 token on Ethereum, HT faces inherent blockchain security risks and potential smart contract exploits
- Circulating Supply Expansion: With only 21.88% of maximum supply currently circulating (109.4M out of 500M tokens), future token releases may create significant selling pressure
VI. Conclusion and Action Recommendations
HT Investment Value Assessment
HT presents a mixed investment profile characterized by both opportunities and significant challenges. As the native token of Huobi Group's ecosystem, it offers utility within a major centralized exchange platform. However, the token's substantial decline of 80.62% year-over-year and its trading near historical lows at $0.2136 reflect considerable market skepticism. The relatively low circulating supply ratio of 21.88% suggests potential future dilution, while modest trading volumes may present liquidity challenges for larger positions. Short-term prospects remain uncertain with mixed momentum signals, while long-term value depends heavily on Huobi Group's ability to expand ecosystem utility and maintain competitive positioning in an evolving exchange landscape.
HT Investment Recommendations
✅ Beginners: Approach HT with caution and limit exposure to 1-2% of your overall cryptocurrency portfolio. Consider starting with small positions through Gate.com to understand price dynamics before increasing allocation.
✅ Experienced Investors: HT may serve as a tactical allocation within a diversified exchange token portfolio. Monitor ecosystem developments and consider position sizing between 3-5% with clearly defined risk parameters and exit strategies.
✅ Institutional Investors: Conduct thorough due diligence on Huobi Group's operational metrics and regulatory compliance. Consider HT as part of a broader thesis on centralized exchange tokens with appropriate hedging strategies and risk management protocols.
HT Trading Participation Methods
- Spot Trading: Purchase HT directly on Gate.com with various trading pairs to establish positions at current market prices
- Active Position Management: Utilize limit orders and stop-loss mechanisms to manage entry and exit points effectively while monitoring key technical levels
- Portfolio Integration: Incorporate HT as part of a diversified cryptocurrency allocation strategy, balancing exposure across multiple asset categories and blockchain ecosystems
Cryptocurrency investments carry extremely high risks. This article does not constitute investment advice. Investors should make prudent decisions based on their own risk tolerance and are advised to consult professional financial advisors. Never invest more than you can afford to lose.
FAQ
How high is HT price expected to reach in 2024?
Based on market trends and technical analysis, HT price was anticipated to reach $8-12 range in 2024. However, actual performance depends on market conditions, adoption rates, and broader crypto market dynamics. Current market data should be consulted for 2024 results.
What are the main factors affecting HT coin price?
HT price is influenced by platform performance, trading volume, ecosystem development, market sentiment, Bitcoin trends, and Huobi's financial reports. Strong fundamentals and adoption drive long-term value.
HT demonstrates strong growth potential. With Huobi's expanding ecosystem, increasing transaction volume, and robust governance participation, HT is positioned competitively. Enhanced tokenomics and platform development initiatives support significant upside potential compared to other major platform tokens.
Based on technical analysis, how to predict HT's short-term (1-3 months) price trend?
HT shows bullish signals with strong support levels and increasing trading volume. Key resistance at $5.8 suggests potential upside movement. Monitor RSI and moving averages for entry points in the 1-3 month window.
What are the key support and resistance levels to focus on in HT price predictions?
Key support levels for HT include previous swing lows and moving averages like the 200-day MA. Resistance levels are found at previous highs and psychological price points. Monitor trading volume spikes at these levels, as they confirm breakouts or reversals. Technical analysis tools help identify these critical price zones for predicting HT movements.
Platform growth directly influences HT value. Increased transaction volume, user adoption, and ecosystem expansion drive demand for HT tokens. Strong development roadmap and market position typically correlate with positive price momentum and long-term appreciation potential.
What risks should I pay attention to when investing in HT for price prediction trading?
HT price prediction involves market volatility, liquidity risks, and leverage exposure. Monitor technical indicators, set stop-losses, and only invest capital you can afford to lose. Price movements depend on market sentiment and trading volume.
* The information is not intended to be and does not constitute financial advice or any other recommendation of any sort offered or endorsed by Gate.