This comprehensive analysis examines Huobi Token (HT) as a digital asset within the Huobi ecosystem, currently trading at $0.2136 with a $23.37 million market cap as of January 2026. The article provides detailed price forecasts spanning 2026-2031, ranging from conservative estimates of $0.117 to optimistic scenarios reaching $0.496. By integrating historical price evolution, current market sentiment (extreme fear at index 20), and ecosystem development factors, the analysis offers investors professional trading strategies and risk management frameworks. Key sections address HT's extreme token concentration (97.63% held by two addresses), technical and regulatory risks, and position-sizing recommendations for different investor profiles. The article concludes that HT represents a high-risk opportunity suitable only for investors with exceptional risk tolerance, while recommending conservative allocation limits of 0.5-5% depending on investor experience level.
Introduction: HT's Market Position and Investment Value
HuobiToken (HT), positioned as a global ecological points system for the Huobi ecosystem, has been serving as a decentralized digital asset based on Ethereum since its launch in 2018. As of 2026, HT maintains a market capitalization of approximately $23.37 million, with a circulating supply of around 109.4 million tokens, and the price stabilizes at approximately $0.2136. This asset, which serves as an integral component of the Huobi Group's ecosystem, is playing an increasingly significant role in supporting various applications across the global business framework of the platform.
This article will comprehensively analyze HT's price trajectory from 2026 to 2031, combining historical patterns, market supply-demand dynamics, ecosystem developments, and macroeconomic conditions to provide investors with professional price forecasts and practical investment strategies.
I. HT Price Historical Review and Market Status
HT Historical Price Evolution Trajectory
- 2018: HT token was officially launched in January with an initial offering price of $1.49, establishing its foundation in the crypto ecosystem
- 2021: Market reached a significant milestone in May, with price experiencing substantial growth driven by broader market momentum
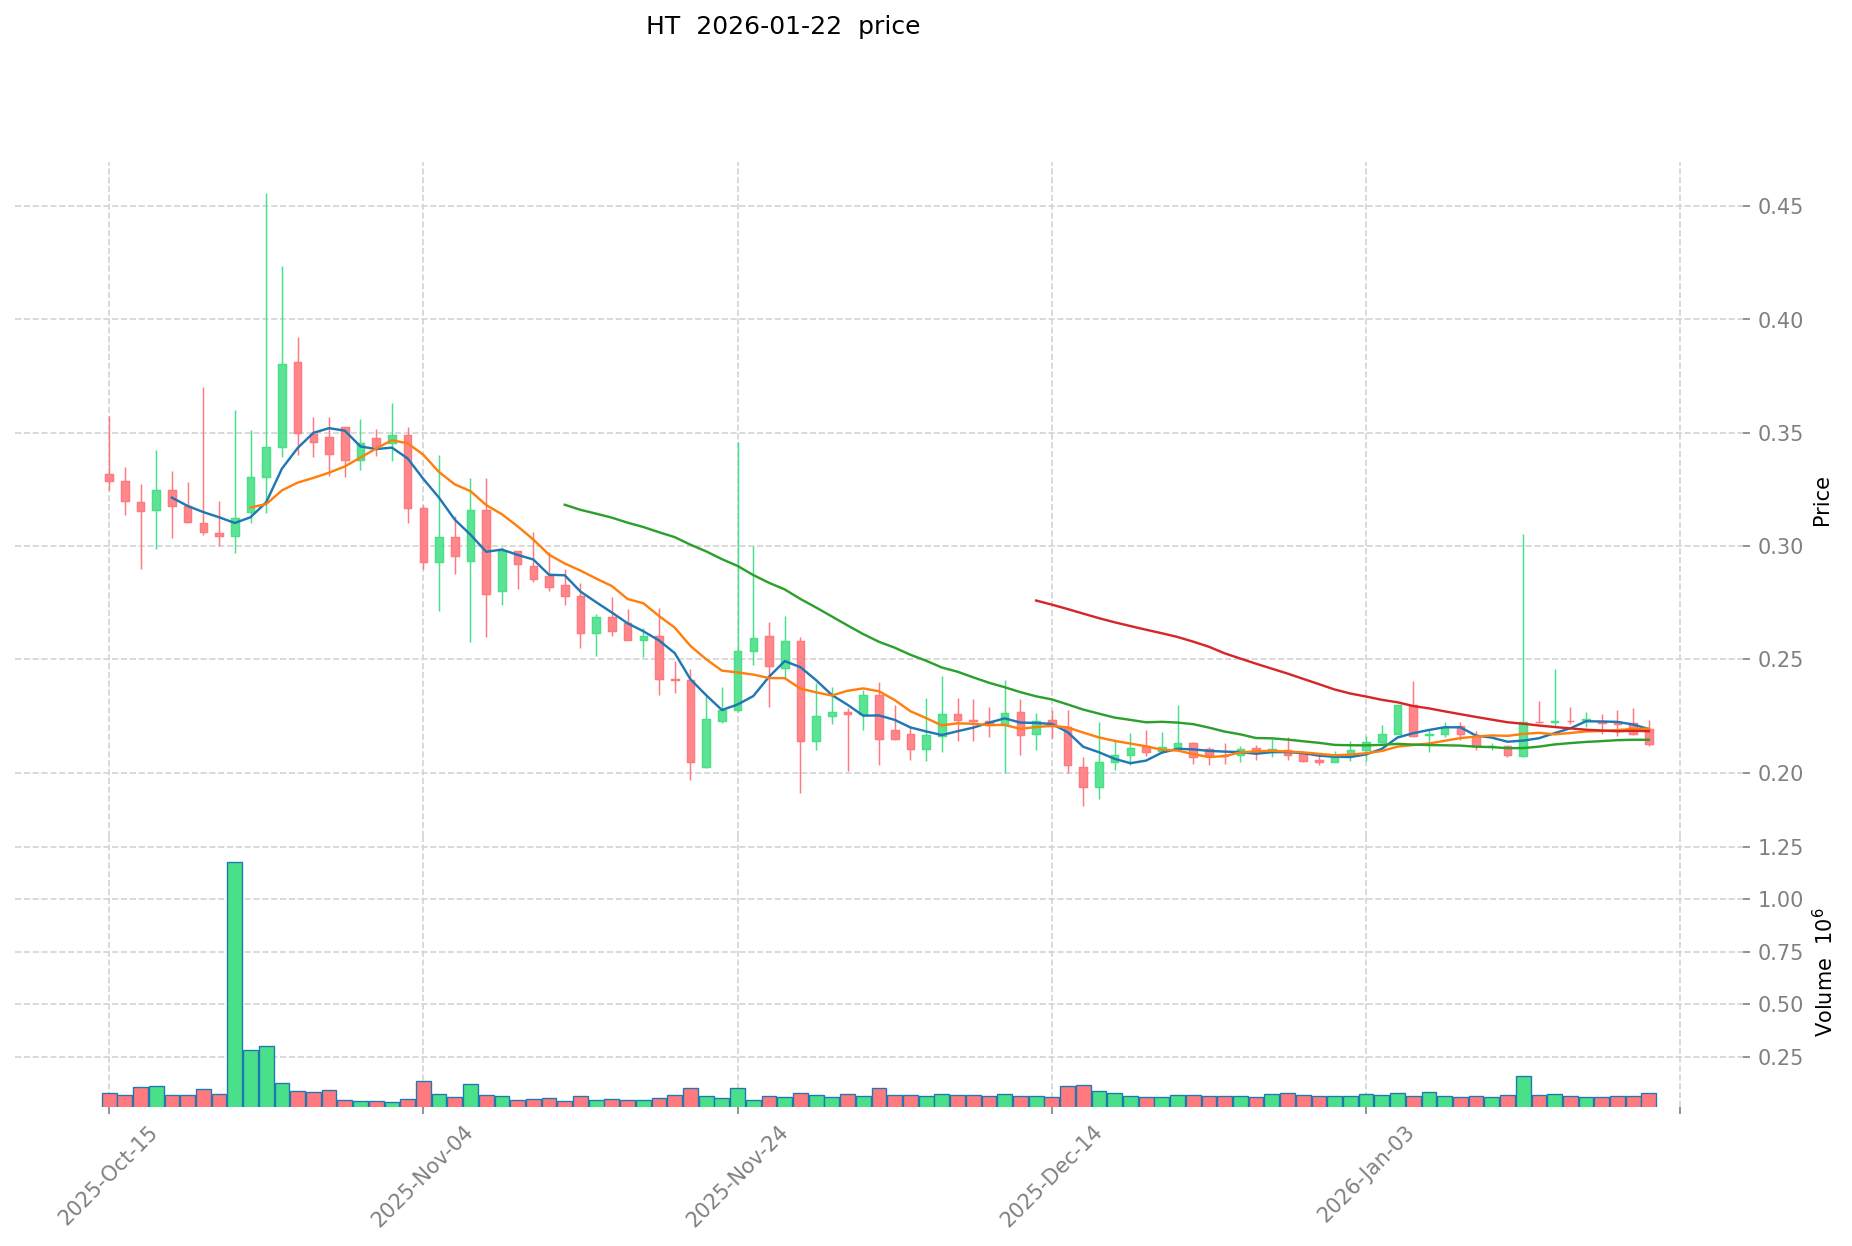
- 2025-2026: Market underwent considerable adjustment period, with price experiencing notable fluctuations reflecting market dynamics
HT Current Market Situation
As of January 22, 2026, HT is trading at $0.2136, representing a 1.08% increase over the past 24 hours. The token's 24-hour trading volume stands at $12,428.51, with intraday price movement ranging between $0.2118 and $0.2151.
The current market capitalization is approximately $23.37 million, with a circulating supply of 109.40 million tokens out of a maximum supply of 500 million, representing a circulation ratio of 21.88%. The fully diluted market cap stands at $43.57 million.
Recent price performance shows mixed signals across different timeframes. While the 1-hour change indicates a modest gain of 0.017%, the 7-day performance reflects a decline of 4.04%. The 30-day trend shows a recovery with a 1.91% increase. The year-over-year comparison indicates an 80.62% decline, reflecting broader market adjustments.
The token maintains a market share of 0.0013% within the crypto ecosystem, with a market cap to fully diluted valuation ratio of 21.88%. Current market sentiment indicators suggest an environment characterized by cautious positioning.
Click to view current HT market price
HT Market Sentiment Indicator
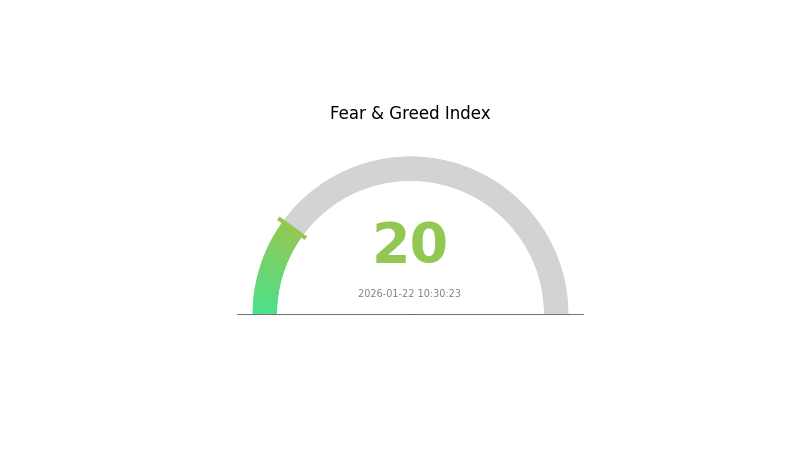
2026-01-22 Fear and Greed Index: 20 (Extreme Fear)
Click to view current Fear & Greed Index
The cryptocurrency market is currently experiencing extreme fear, with the Fear and Greed Index standing at 20. This indicates significant market pessimism and heightened risk aversion among investors. During periods of extreme fear, volatility tends to increase substantially, presenting both risks and potential opportunities for traders. Investors should exercise caution and consider their risk tolerance carefully. Such extreme sentiment conditions often mark potential turning points in the market, though timing remains unpredictable. Risk management and diversification strategies are particularly important during these uncertain periods.
HT Holdings Distribution
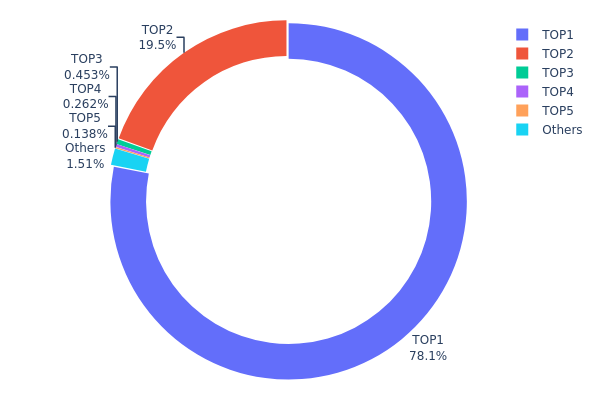
The holdings distribution chart illustrates the concentration of token ownership across different wallet addresses, revealing the degree of decentralization within the network. By analyzing the percentage held by top addresses versus smaller holders, this metric provides critical insights into market structure and potential vulnerability to large-scale movements.
According to current data, HT exhibits extreme concentration characteristics. The top address holds 390,604.31K tokens, accounting for 78.12% of total supply, while the second-largest address controls an additional 97,585.04K tokens (19.51%). Combined, these two addresses control 97.63% of the entire circulating supply, with the remaining top three addresses holding less than 1% collectively. This distribution pattern suggests an unusually centralized holding structure, far exceeding typical concentration levels observed in major cryptocurrencies.
This high concentration level presents significant implications for market dynamics. The dominance of two addresses creates substantial price volatility risk, as large-scale transfers or liquidations from either holder could trigger dramatic market movements. Such centralization also raises concerns about potential market manipulation, reduced liquidity depth, and limited trading activity diversity. From a decentralization perspective, this structure contradicts the fundamental principles of distributed blockchain networks, indicating weak on-chain structural stability and heightened systemic risk for investors considering HT positions.
Click to view current HT Holdings Distribution
| Top |
Address |
Holding Qty |
Holding (%) |
| 1 |
0x0000...000000 |
390604.31K |
78.12% |
| 2 |
0x1870...dda12e |
97585.04K |
19.51% |
| 3 |
0xd004...4bf9d4 |
2267.12K |
0.45% |
| 4 |
0xc882...84f071 |
1309.03K |
0.26% |
| 5 |
0x9fcc...8c19fe |
690.39K |
0.13% |
| - |
Others |
7544.11K |
1.53% |
II. Core Factors Affecting HT's Future Price
Based on the available information, there is insufficient data to provide a comprehensive analysis of the core factors affecting HT's future price at this time. The key areas that would typically influence price dynamics—including supply mechanisms, institutional holdings, macroeconomic conditions, and technical developments—require specific data points that are not present in the provided materials.
For a thorough evaluation of HT's price outlook, detailed information regarding token economics, major stakeholder activities, regulatory developments, and ecosystem expansion would be necessary. Readers are encouraged to conduct their own research and consult multiple sources before making any investment decisions related to HT.
III. 2026-2031 HT Price Forecast
2026 Outlook
- Conservative estimate: $0.117 - $0.214
- Neutral estimate: $0.214 (average price target)
- Optimistic estimate: $0.276 (requires favorable market conditions and sustained trading volume)
2027-2029 Mid-term Outlook
- Market phase expectation: HT may enter a gradual recovery and consolidation phase, with price movements reflecting broader crypto market cycles and platform development progress
- Price range forecasts:
- 2027: $0.203 - $0.335, representing approximately 14% growth from 2026 baseline
- 2028: $0.162 - $0.316, with average price around $0.290, showing 35% cumulative change
- 2029: $0.188 - $0.418, potentially reaching $0.303 average, marking 41% overall growth
- Key catalysts: Platform ecosystem expansion, token utility enhancements, institutional adoption trends, and regulatory clarity in major markets
2030-2031 Long-term Outlook
- Base scenario: $0.339 - $0.386 (assuming steady platform growth and stable market conditions)
- Optimistic scenario: $0.360 - $0.496 (contingent on significant ecosystem breakthroughs and increased mainstream adoption)
- Transformative scenario: Potential to approach $0.496 (requiring exceptional market conditions, major strategic partnerships, and substantial utility expansion)
- 2026-01-22: HT trading within projected initial range as market participants assess long-term value propositions
| Year |
Predicted High Price |
Predicted Average Price |
Predicted Low Price |
Price Change |
| 2026 |
0.27554 |
0.2136 |
0.11748 |
0 |
| 2027 |
0.33506 |
0.24457 |
0.20299 |
14 |
| 2028 |
0.3159 |
0.28982 |
0.1623 |
35 |
| 2029 |
0.41795 |
0.30286 |
0.18777 |
41 |
| 2030 |
0.38563 |
0.3604 |
0.33878 |
68 |
| 2031 |
0.49611 |
0.37302 |
0.19024 |
74 |
IV. HT Professional Investment Strategy and Risk Management
HT Investment Methodology
(1) Long-term Holding Strategy
- Suitable for: Investors seeking exposure to exchange ecosystem tokens with moderate risk tolerance
- Operational Recommendations:
- Consider accumulating positions during market downturns when price approaches support levels around $0.21
- Monitor HT's integration within the ecosystem and any updates regarding token utility expansion
- Storage Solution: Utilize Gate Web3 Wallet for secure asset management with multi-signature protection
(2) Active Trading Strategy
- Technical Analysis Tools:
- Volume Analysis: Monitor 24-hour trading volume ($12,428.51) relative to historical averages to identify potential breakout or breakdown signals
- Support and Resistance Levels: Track the 24-hour range ($0.2118-$0.2151) to establish short-term trading boundaries
- Swing Trading Key Points:
- The 7-day decline of 4.04% may present potential entry opportunities for contrarian traders
- Consider the significant year-over-year decline of 80.62% when evaluating risk-reward ratios for position sizing
HT Risk Management Framework
(1) Asset Allocation Principles
- Conservative Investors: 0.5-1% of crypto portfolio
- Aggressive Investors: 2-3% of crypto portfolio
- Professional Investors: Up to 5% with active monitoring and hedging strategies
(2) Risk Hedging Solutions
- Portfolio Diversification: Combine HT holdings with established cryptocurrencies to reduce concentration risk
- Position Sizing: Implement dollar-cost averaging to mitigate timing risk, especially given recent price volatility
(3) Security Storage Solutions
- Hot Wallet Option: Gate Web3 Wallet for active trading with convenient access
- Cold Storage Approach: Consider hardware wallet solutions for long-term holdings exceeding short-term trading needs
- Security Precautions: Enable two-factor authentication, regularly update security settings, and never share private keys or seed phrases
V. HT Potential Risks and Challenges
HT Market Risks
- Extreme Volatility: The token has experienced an 80.62% decline over the past year, indicating substantial downside risk potential
- Low Liquidity: With 24-hour trading volume of approximately $12,428.51 and limited exchange availability (trading on 1 exchange), liquidity constraints may impact execution during volatile periods
- Historical Drawdown: Trading 99.46% below its all-time high of $39.66, significant recovery would require extraordinary circumstances
HT Regulatory Risks
- Exchange Token Classification: Regulatory uncertainty surrounding exchange-issued tokens may affect HT's operational framework and trading availability
- Jurisdictional Compliance: Changes in regional cryptocurrency regulations could impact the token's accessibility and utility within different markets
- Regulatory Scrutiny: Increased oversight of centralized exchange operations may influence token economics and investor sentiment
HT Technical Risks
- Ethereum Network Dependency: As an ERC-20 token, HT is subject to Ethereum network congestion and gas fee volatility
- Smart Contract Vulnerabilities: While established, the token's smart contract infrastructure requires ongoing security monitoring
- Centralization Concerns: The connection to a specific exchange ecosystem introduces counterparty risk related to platform operations
VI. Conclusion and Action Recommendations
HT Investment Value Assessment
HT presents a high-risk investment opportunity with limited short-term catalysts. The token's 80.62% year-over-year decline and trading near $0.21 (far below its $39.66 all-time high) reflects substantial market challenges. While the circulating supply of 109.4 million tokens (21.88% of max supply) provides some scarcity elements, the low market dominance of 0.0013% and limited exchange availability suggest constrained institutional interest. Long-term value depends heavily on ecosystem development and broader market recovery, making this suitable only for investors with exceptional risk tolerance.
HT Investment Recommendations
✅ Beginners: Avoid or limit exposure to less than 0.5% of total crypto portfolio due to high volatility and substantial downside history
✅ Experienced Investors: Consider small speculative positions (1-2% allocation) only after thorough due diligence on ecosystem developments and with strict stop-loss parameters
✅ Institutional Investors: Evaluate correlation benefits and ecosystem alignment; maintain position sizes within established risk management frameworks with continuous monitoring
HT Trading Participation Methods
- Spot Trading: Access HT trading pairs on Gate.com with competitive fee structures and adequate liquidity for standard position sizes
- Dollar-Cost Averaging: Implement systematic purchasing strategies to mitigate timing risk in volatile market conditions
- Portfolio Integration: Use HT as a small tactical allocation within a diversified cryptocurrency portfolio rather than as a core holding
Cryptocurrency investment carries extreme risk, and this article does not constitute investment advice. Investors should make prudent decisions based on their own risk tolerance and are advised to consult professional financial advisors. Never invest more than you can afford to lose.
FAQ
Will HT coin price rise in the future? What is the price prediction for HT in 2024?
HT has strong fundamentals backed by the Huobi ecosystem. With increasing adoption and platform growth, HT is expected to appreciate over time. While 2024 predictions vary, analysts anticipate potential upside driven by ecosystem expansion and market recovery trends.
What are the main factors affecting HT coin price?
HT price is influenced by platform performance, trading volume, ecosystem development, market sentiment, Bitcoin trends, and Huobi's operational initiatives. Strong fundamentals and adoption drive long-term value appreciation.
How to conduct technical analysis and price prediction for HT coins?
Analyze HT's price charts using moving averages, RSI, and MACD indicators. Monitor trading volume and support/resistance levels. Track on-chain metrics and market sentiment. HT shows bullish potential with strong fundamentals, suggesting upward price movement in coming months.
HT demonstrates strong fundamentals with growing ecosystem utility and governance value. Its deflationary mechanism and community support position it competitively. While market dynamics vary, HT's solid foundation suggests promising mid-to-long term appreciation potential relative to competing platform tokens.
How has HT's historical price trend been? What is the current price position?
HT has shown strong growth since launch, reaching peak levels in 2021. Currently in 2026, HT maintains solid mid-range positioning after consolidation phases. The token demonstrates resilience with steady adoption, positioning it favorably for continued appreciation as Web3 ecosystem expands.
What risks should I pay attention to when investing in HT coins for price prediction trading?
HT price prediction trading involves market volatility, leverage risks, and liquidity considerations. Monitor price fluctuations, manage position sizes, use stop-loss orders, and stay informed on market conditions to optimize trading outcomes.
* The information is not intended to be and does not constitute financial advice or any other recommendation of any sort offered or endorsed by Gate.