This comprehensive analysis provides expert price predictions for ICE (Ice Open Network), a Layer 1 blockchain infrastructure platform, covering 2026-2031. Currently trading at $0.00199 with a $13.55M market cap, ICE faces mixed signals including extreme market fear but recent 13.20% monthly gains. The article forecasts ICE reaching $0.00263 by 2026 with potential highs of $0.0059 by 2031. It delivers practical investment strategies for different investor profiles, detailed risk management frameworks including asset allocation guidance, and explores critical challenges including price volatility (-61.91% annually) and regulatory uncertainties. Featuring technical analysis tools, secure storage solutions via Gate Web3 Wallet, and actionable trading methodologies, this guide equips investors with essential insights for informed decision-making in emerging blockchain markets.
Introduction: ICE's Market Position and Investment Value
Ice Open Network (ICE), as a Layer 1 blockchain revolutionizing Web3 technology interaction, has been developing since its launch in 2023. As of 2026, ICE has achieved a market capitalization of approximately $13.55 million, with a circulating supply of around 6.79 billion tokens, and its price maintains at approximately $0.00199. This asset, recognized as a "comprehensive Web3 infrastructure platform," is playing an increasingly vital role in decentralized identity verification, social media interaction, content delivery, and secure data storage.
This article will comprehensively analyze ICE's price trends from 2026 to 2031, combining historical patterns, market supply and demand dynamics, ecosystem development, and macroeconomic conditions to provide investors with professional price forecasts and practical investment strategies.
I. ICE Price History Review and Market Status
ICE Historical Price Evolution Trajectory
- 2024: Ice Open Network reached its all-time high on January 19, 2024, with price climbing to $0.15
- 2025: The token experienced significant volatility throughout the year, with price declining from higher levels
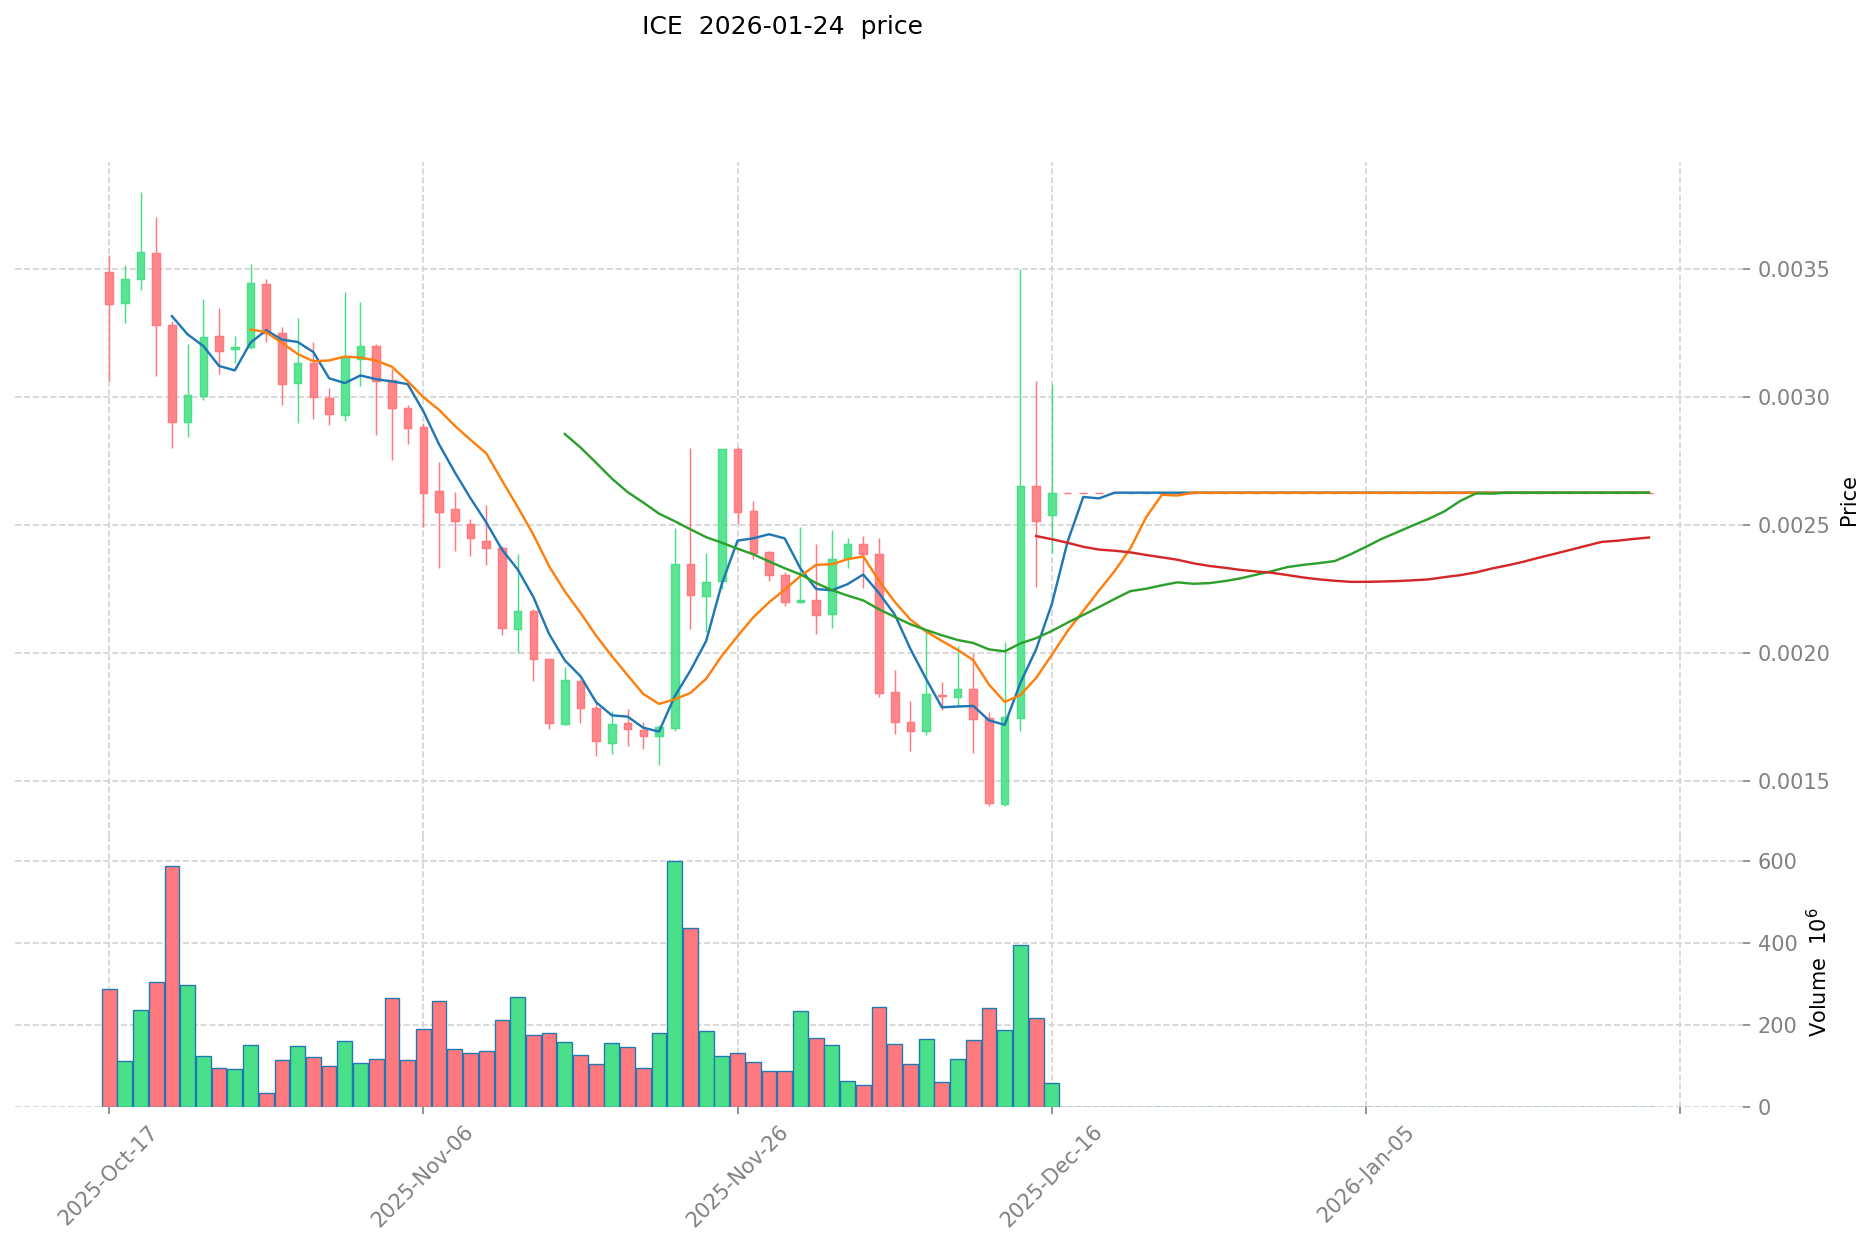
- 2025: Market correction phase, price dropped from $0.15 peak to an all-time low of $0.0014 on December 12, 2025
ICE Current Market Situation
As of January 25, 2026, ICE is trading at $0.00199428, representing a recovery from its all-time low recorded in December 2025. The token has shown mixed performance across different timeframes. In the short term, ICE experienced a decline of 1.74% over the past hour and 8.27% over the past 7 days. However, on a monthly basis, the token demonstrated positive momentum with a 13.20% gain over the past 30 days. From a longer-term perspective, ICE has declined 61.91% over the past year, reflecting the broader market challenges and price correction from its January 2024 peak.
The token maintains a market capitalization of approximately $13.55 million, with a circulating supply of 6.79 billion ICE tokens out of a maximum supply of 21.15 billion tokens. This represents a circulation ratio of approximately 32.12%. The fully diluted market cap stands at approximately $42.18 million. With 440,639 holders, the token has established a notable user base within the blockchain ecosystem. The market dominance of ICE currently stands at 0.0013%, positioning it as a smaller-cap asset in the overall cryptocurrency market.
Click to view current ICE market price
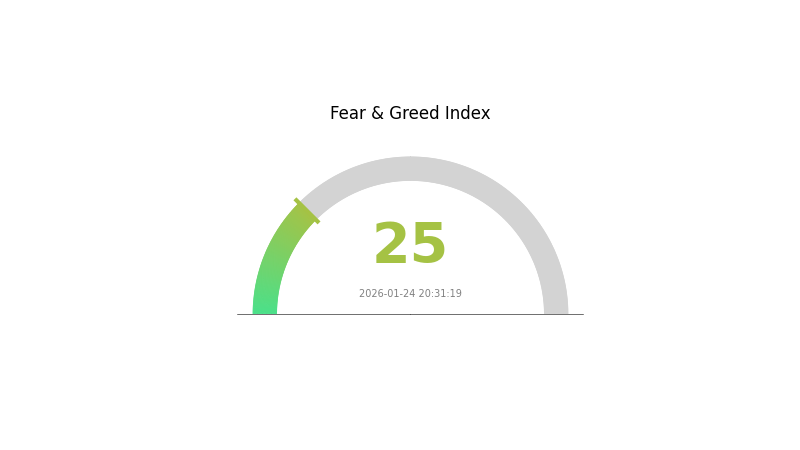
ICE Market Sentiment Index
2026-01-24 Fear and Greed Index: 25 (Extreme Fear)
Click to view current Fear & Greed Index
The crypto market is currently experiencing extreme fear, with the index dropping to 25. This indicates significant market pessimism and heightened risk aversion among investors. When fear reaches such extreme levels, it often presents contrarian opportunities for long-term investors. However, extreme fear also signals increased volatility and potential downside risks. Market participants should exercise caution and avoid making impulsive decisions. Consider diversifying your portfolio and maintaining adequate risk management strategies. Monitor market developments closely for potential reversal signals.
ICE Holding Distribution
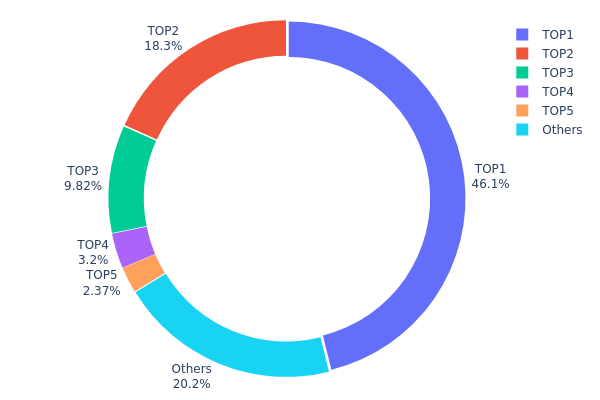
The holding distribution chart serves as a crucial metric for evaluating the degree of token concentration among various wallet addresses within a cryptocurrency's ecosystem. This indicator provides insights into the decentralization level, potential market manipulation risks, and overall structural health of the token's on-chain distribution.
Based on the current data, ICE demonstrates a notably concentrated holding structure. The top address controls approximately 46.11% of the total supply (9.75 billion tokens), while the second-largest holder possesses 18.33% (3.88 billion tokens). Together, the top two addresses command nearly 64.44% of the circulating supply, indicating significant centralization. Additionally, the burn address (0x0000...00dead) holds 9.81% of tokens, effectively removing them from circulation. The top five addresses collectively control 79.82% of the supply, leaving only 20.18% distributed among remaining holders.
This concentrated distribution pattern presents several implications for market dynamics. The substantial holdings by top addresses create potential price volatility risks, as large-scale movements from these wallets could significantly impact market liquidity and price stability. The concentration also raises concerns regarding decentralized governance, as major holders may exert disproportionate influence over protocol decisions. However, the presence of a significant burn address demonstrates some deflationary mechanisms in place. For potential investors, this distribution structure suggests heightened sensitivity to whale movements and necessitates careful monitoring of major address activities.
Click to view current ICE Holding Distribution
| Top |
Address |
Holding Qty |
Holding (%) |
| 1 |
0xeaed...6a6b8d |
9754199.88K |
46.11% |
| 2 |
0x4a04...f95c7f |
3877356.70K |
18.33% |
| 3 |
0x0000...00dead |
2076920.03K |
9.81% |
| 4 |
0x7d8a...46938a |
677486.56K |
3.20% |
| 5 |
0xa042...a77da3 |
502322.37K |
2.37% |
| - |
Others |
4262251.89K |
20.18% |
II. Core Factors Affecting ICE's Future Price
Based on the available information, there is insufficient data to provide a comprehensive analysis of the core factors affecting ICE's future price. The provided materials do not contain specific details about ICE's supply mechanisms, institutional dynamics, macroeconomic positioning, or technical development roadmap.
To conduct a thorough price factor analysis, we would need access to:
- Supply mechanism documentation and historical supply data
- Institutional holding reports and enterprise adoption cases
- Technical upgrade schedules and ecosystem development metrics
- Market performance data across different economic conditions
Without verified data from the reference materials, we cannot accurately assess the fundamental drivers that may influence ICE's price trajectory. Readers interested in ICE should conduct independent research using official project documentation and verified market data sources.
III. 2026-2031 ICE Price Forecast
2026 Outlook
- Conservative forecast: $0.00176 - $0.00263
- Neutral forecast: $0.00263 (average expected price)
- Optimistic forecast: $0.00318 (requiring favorable market conditions and increased adoption)
Based on current market analysis, ICE is projected to experience a 31% price change throughout 2026, with prices potentially ranging between $0.00176 and $0.00318. The average price target sits at $0.00263, reflecting moderate growth expectations as the token establishes its market position.
2027-2029 Mid-term Outlook
- Market stage expectation: Gradual appreciation phase with potential volatility as the project matures and expands its ecosystem
- Price range forecast:
- 2027: $0.00215 - $0.00395 (45% projected change)
- 2028: $0.00298 - $0.00353 (71% projected change)
- 2029: $0.00288 - $0.00382 (74% projected change)
- Key catalysts: Technology developments, partnership announcements, broader crypto market trends, and increasing user base adoption could serve as primary drivers for price appreciation during this period
The mid-term outlook suggests strengthening fundamentals, with 2028 and 2029 showing particularly robust growth projections above 70%. This period may witness enhanced price stability as reflected in the narrowing gap between high and low predictions.
2030-2031 Long-term Outlook
- Baseline scenario: $0.00336 - $0.00427 (assuming steady ecosystem growth and stable market conditions)
- Optimistic scenario: $0.00365 - $0.00427 in 2030 (with accelerated adoption and favorable regulatory environment)
- Growth scenario: $0.00293 - $0.0059 by 2031 (under conditions of breakthrough developments and mainstream recognition)
Looking toward the end of the forecast period, ICE demonstrates significant long-term potential with projected changes reaching 82% in 2030 and 98% by 2031. The 2031 high price target of $0.0059 represents nearly double the 2026 optimistic forecast, suggesting compounding growth effects over the five-year horizon. However, investors should note that long-term projections carry inherent uncertainty and actual performance may vary based on numerous market factors.
- 2026-01-25: ICE trading within early-stage price discovery phase as market participants evaluate long-term potential
| Year |
Predicted High Price |
Predicted Average Price |
Predicted Low Price |
Price Change |
| 2026 |
0.00318 |
0.00263 |
0.00176 |
31 |
| 2027 |
0.00395 |
0.0029 |
0.00215 |
45 |
| 2028 |
0.00353 |
0.00342 |
0.00298 |
71 |
| 2029 |
0.00382 |
0.00348 |
0.00288 |
74 |
| 2030 |
0.00427 |
0.00365 |
0.00336 |
82 |
| 2031 |
0.0059 |
0.00396 |
0.00293 |
98 |
IV. ICE Professional Investment Strategy and Risk Management
ICE Investment Methodology
(I) Long-term Holding Strategy
- Target Audience: Investors seeking exposure to Layer 1 blockchain infrastructure and Web3 technologies with a moderate risk tolerance
- Operational Recommendations:
- Consider allocating a portion of your crypto portfolio to ICE based on your risk profile, recognizing its position as an emerging Layer 1 project with decentralized service integration
- Monitor key development milestones including dApp builder adoption metrics and ecosystem growth indicators
- Storage Solution: Utilize Gate Web3 Wallet for secure asset custody with multi-signature protection options
(II) Active Trading Strategy
- Technical Analysis Tools:
- Volume Analysis: Monitor trading volume patterns on Gate.com to identify potential accumulation or distribution phases, noting the current 24-hour volume metrics
- Moving Averages: Track 50-day and 200-day moving averages to identify trend directions and potential entry/exit points
- Swing Trading Considerations:
- Given the -8.27% 7-day price movement, identify support levels around recent lows for potential entry opportunities
- Set predetermined profit targets and stop-loss levels to manage position risk effectively
ICE Risk Management Framework
(I) Asset Allocation Principles
- Conservative Investors: 1-3% of crypto portfolio allocation
- Moderate Investors: 3-5% of crypto portfolio allocation
- Aggressive Investors: 5-10% of crypto portfolio allocation
(II) Risk Hedging Approaches
- Portfolio Diversification: Balance ICE holdings with established Layer 1 assets and stablecoins to reduce concentration risk
- Position Sizing: Implement scaled entry strategies rather than deploying full capital allocation at once
(III) Secure Storage Solutions
- Hot Wallet Option: Gate Web3 Wallet for active trading and quick access to funds with enhanced security features
- Cold Storage Approach: Consider hardware wallet solutions for long-term holdings exceeding your active trading allocation
- Security Precautions: Enable two-factor authentication, regularly update security protocols, and never share private keys or seed phrases
V. ICE Potential Risks and Challenges
ICE Market Risks
- Price Volatility: ICE has demonstrated significant price fluctuations with a -61.91% annual decline, indicating high volatility characteristics common in emerging blockchain projects
- Limited Liquidity: With trading available on 3 exchanges and relatively modest 24-hour volumes, liquidity constraints may impact execution quality during volatile periods
- Market Cap Dynamics: Currently ranked 1059 with a market dominance of 0.0013%, indicating limited market adoption compared to established projects
ICE Regulatory Risks
- Jurisdictional Uncertainty: Evolving regulatory frameworks for Layer 1 blockchains across different jurisdictions may impact project operations and token classification
- Compliance Requirements: Potential future regulatory requirements for decentralized identity verification services could necessitate operational adjustments
- Cross-border Considerations: The global nature of ICE's decentralized services may face varying regulatory interpretations across different regions
ICE Technical Risks
- Network Security: As a Layer 1 blockchain, ICE faces ongoing security challenges requiring continuous protocol upgrades and security audits
- Scalability Concerns: The ability to maintain performance while scaling decentralized services including identity verification and content delivery requires proven technical execution
- Competition Pressure: The Layer 1 blockchain space remains highly competitive with established players possessing greater resources and market recognition
VI. Conclusion and Action Recommendations
ICE Investment Value Assessment
Ice Open Network presents itself as an ambitious Layer 1 blockchain project focused on Web3 accessibility through integrated decentralized services and user-friendly dApp creation tools. The project's comprehensive approach to digital identity, social media integration, and secure data storage addresses key adoption barriers in the blockchain space. However, investors should carefully weigh the project's innovative vision against significant headwinds including a substantial -61.91% annual price decline, limited market capitalization ($13.55 million), and a circulating supply representing only 32.12% of maximum supply. The 30-day price increase of 13.20% may indicate emerging momentum, though this should be contextualized within broader market volatility patterns.
ICE Investment Recommendations
✅ Beginners: Consider minimal allocation (under 2% of crypto portfolio) only after thoroughly researching Layer 1 blockchain fundamentals and understanding the project's value proposition
✅ Experienced Investors: May consider position building during technical support levels with strict risk management protocols, treating ICE as a speculative allocation within a diversified blockchain infrastructure thesis
✅ Institutional Investors: Conduct comprehensive due diligence on team credentials, technical architecture security audits, and competitive positioning before considering any allocation
ICE Trading Participation Methods
- Spot Trading: Execute spot purchases on Gate.com with gradual position building through dollar-cost averaging to mitigate timing risk
- Portfolio Integration: Incorporate ICE as part of a broader Layer 1 blockchain basket strategy rather than as a concentrated position
- Research Monitoring: Track development progress, partnership announcements, and ecosystem growth metrics before adjusting position sizes
Cryptocurrency investments carry extremely high risks. This article does not constitute investment advice. Investors should make prudent decisions based on their own risk tolerance and are advised to consult professional financial advisors. Never invest more than you can afford to lose.
FAQ
What are the main factors affecting ICE price predictions?
ICE price predictions are primarily influenced by market trading volume, token utility adoption, network activity, competitive landscape, regulatory developments, and overall crypto market sentiment. Supply dynamics and institutional interest also play significant roles in price movements.
How to analyze ICE's historical price trends to make predictions?
Analyze ICE price trends by examining support and resistance levels, trading volume patterns, and moving averages over different timeframes. Identify trend direction through candlestick charts, monitor momentum indicators like RSI and MACD, and correlate price movements with market sentiment and on-chain metrics for comprehensive prediction analysis.
What are the risks and limitations in ICE price prediction?
ICE price predictions involve market volatility, limited historical data, and unpredictable market events. Predictions may not account for sudden regulatory changes or shifts in trading volume. Accuracy depends on data quality and market conditions.
What methods do professional analysts typically use to predict ICE prices?
Professional analysts predict ICE prices using multiple methods: technical analysis of price charts and trading volume data, fundamental analysis of project developments and adoption metrics, on-chain analytics tracking transaction activity, market sentiment indicators, and comparative analysis with similar blockchain assets. They combine these approaches to form comprehensive price forecasts.
What is the growth potential of ICE's future price?
ICE demonstrates strong growth potential driven by increasing trading volume, expanding ecosystem adoption, and growing institutional interest in the Web3 sector. Market fundamentals suggest favorable conditions for long-term appreciation.
* The information is not intended to be and does not constitute financial advice or any other recommendation of any sort offered or endorsed by Gate.