This comprehensive analysis examines Space ID (ID) token's price dynamics and investment potential through 2031. Starting from its current $0.0652 valuation with $28.07 million market cap, the article reviews ID's volatile performance—peaking at $1.84 in March 2024 before declining to extreme fear conditions. It presents detailed price forecasts: conservative projections range from $0.05953 to $0.08701 in 2026, with potential 83% cumulative growth by 2031 reaching $0.15175. The guide combines technical analysis, holding distribution assessment, and market sentiment evaluation to provide investors with actionable strategies. Key sections address long-term holding approaches, active trading techniques, risk management frameworks, and regulatory challenges. This resource equips both beginners and experienced investors with professional methodology for evaluating ID's role in Web3 identity infrastructure, while emphasizing risk mitigation through diversification and proper position sizing on Gate exchange.
Introduction: ID's Market Position and Investment Value
Space ID (ID), positioned as a universal Web3 domain name and identity infrastructure provider, has been serving the decentralized ecosystem since its launch in 2023. By 2026, ID has established itself with a market capitalization of approximately $28.07 million, a circulating supply of around 430.51 million tokens, and a price hovering near $0.0652. This asset, recognized as a foundational player in Web3 identity services, is playing an increasingly vital role in domain registration, cross-chain name services, and decentralized identity management.
This article will comprehensively analyze ID's price trajectory from 2026 to 2031, combining historical patterns, market supply-demand dynamics, ecosystem development, and macroeconomic conditions to provide investors with professional price forecasts and practical investment strategies.
I. ID Price History Review and Market Status
ID Historical Price Evolution Trajectory
- 2024: Reached a notable price level of $1.84 on March 17, representing a significant peak in the token's trading history
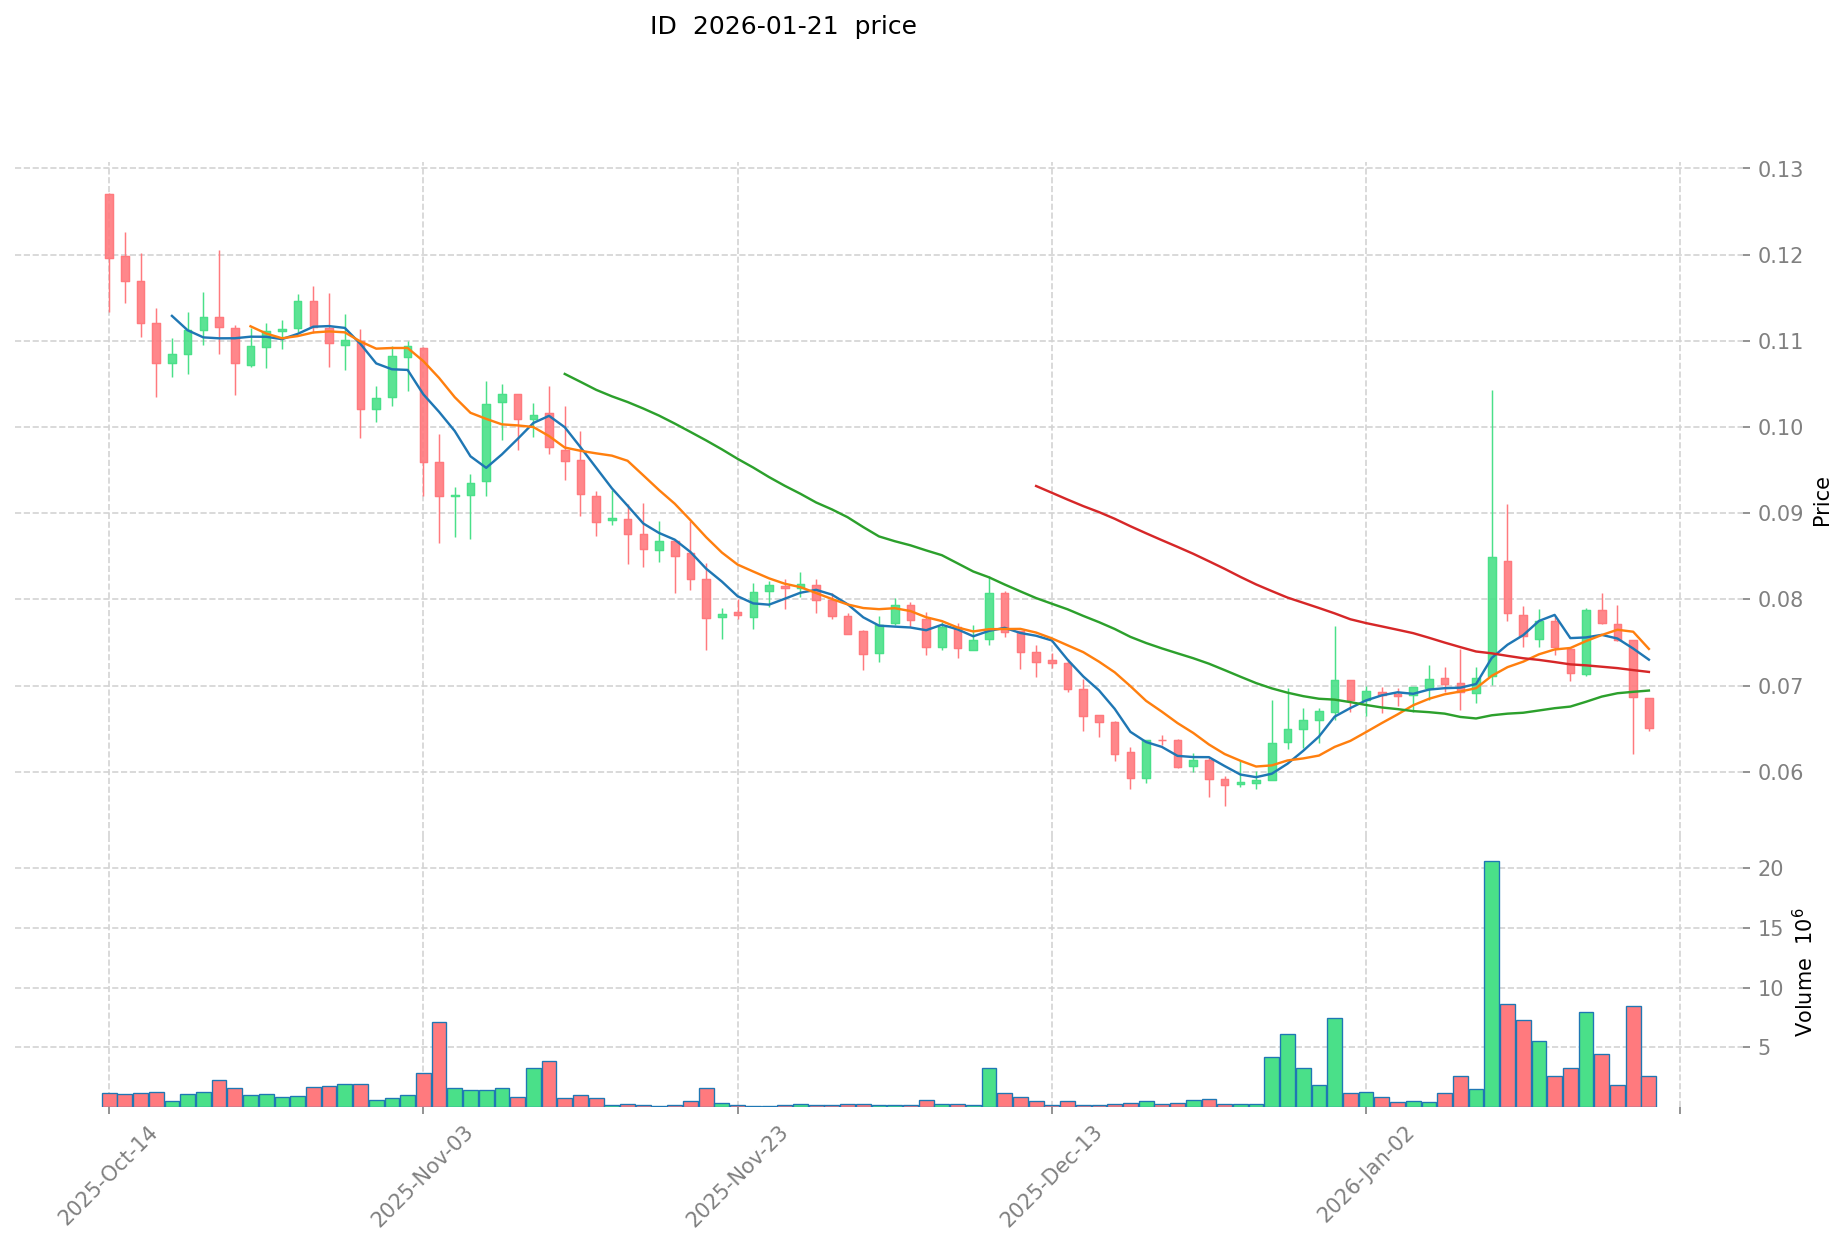
- 2025: Experienced substantial market correction, with price declining to $0.056157 on December 24, marking a low point in the token's value trajectory
- Recent period: Price has shown recovery signs with a 30-day increase of 5.35%, though year-over-year performance reflects an 83.50% decline from previous levels
ID Current Market Status
As of January 22, 2026, ID is trading at $0.0652, with a 24-hour trading volume of $173,284.28. The token has experienced a 2.26% decrease over the past 24 hours, with intraday price ranging between $0.06428 and $0.06691. Short-term momentum shows a 0.85% decline in the past hour, while the 7-day performance indicates a 14.78% decrease.
The token maintains a market capitalization of $28.07 million, ranking 738th in the cryptocurrency market with a 0.0041% market dominance. With 430.51 million tokens in circulation out of a maximum supply of 2 billion, the circulating supply represents 21.53% of the total allocation. The fully diluted market cap stands at $130.18 million, indicating potential dilution as more tokens enter circulation. The token is held by approximately 4,527 addresses and is available for trading on 36 exchanges.
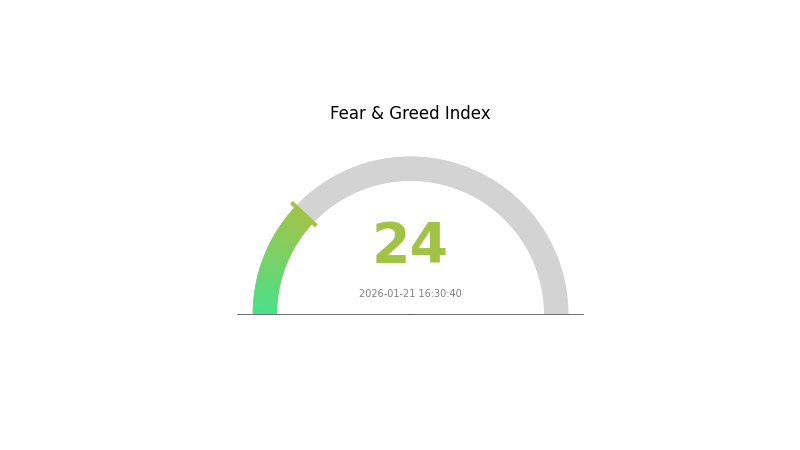
Current market sentiment reflects extreme fear conditions, with a volatility index reading of 24, suggesting heightened caution among market participants.
Click to view current ID market price
ID 市场情绪指标
2026-01-21 恐惧与贪婪指数:24(Extreme Fear)
Click to view current Fear & Greed Index
Market Analysis:
The cryptocurrency market is currently experiencing extreme fear with a Fear and Greed Index reading of 24. This indicates significant market pessimism and heightened investor anxiety. Such extreme fear levels typically present contrarian buying opportunities for long-term investors, as markets are often oversold during these periods. However, traders should exercise caution and conduct thorough due diligence before making investment decisions. Monitor key support levels and market catalysts that could shift sentiment. This sentiment reading suggests heightened volatility ahead—consider adjusting position sizes accordingly and maintaining proper risk management strategies.
ID Holding Distribution
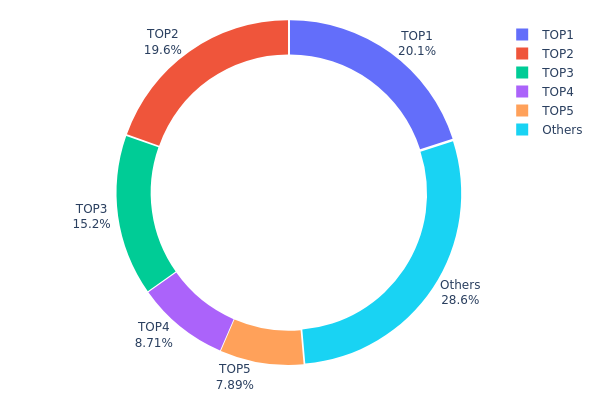
The holding distribution chart reveals the allocation of ID tokens across different wallet addresses, serving as a critical indicator of token concentration and decentralization level. According to the latest on-chain data as of January 22, 2026, ID exhibits a highly concentrated distribution pattern. The top 5 addresses collectively hold approximately 71.42% of the total supply, with the largest holder controlling 360,000K tokens (20.05%), followed closely by the second-largest at 351,973.03K tokens (19.60%). The third and fourth positions hold 272,491.34K (15.17%) and 156,458.33K (8.71%) respectively, while all remaining addresses combined account for only 28.58% of the circulating supply.
This concentration level presents notable market structure implications. Such asymmetric distribution creates potential vulnerability to large-scale sell pressure, as the top holders possess sufficient volume to significantly impact price movements. The relatively small proportion held by retail participants (28.58%) suggests limited decentralization, which may restrict organic price discovery mechanisms and increase susceptibility to coordinated actions. However, it's worth noting that some large holdings may represent exchange wallets, ecosystem reserves, or institutional custodians, which could serve stabilizing rather than destabilizing functions.
From a market microstructure perspective, this distribution pattern indicates that ID's on-chain governance remains concentrated among few entities, potentially affecting protocol decision-making processes and creating elevated volatility risks during periods of holder sentiment shifts. The current structure also suggests that broader token distribution through community incentives or ecosystem expansion initiatives may be necessary to enhance long-term stability and resilience against market manipulation risks.
Click to view current ID Holding Distribution
| Top |
Address |
Holding Qty |
Holding (%) |
| 1 |
0x706a...896ab3 |
360000.00K |
20.05% |
| 2 |
0xa490...204a66 |
351973.03K |
19.60% |
| 3 |
0x062a...9ddca6 |
272491.34K |
15.17% |
| 4 |
0x4296...3a31f7 |
156458.33K |
8.71% |
| 5 |
0x48a6...740454 |
141666.66K |
7.89% |
| - |
Others |
512763.81K |
28.58% |
II. Core Factors Affecting ID's Future Price
Based on the current available information, there is insufficient data to provide a comprehensive analysis of the core factors that may influence ID's future price movements. A thorough evaluation would require detailed information about supply mechanisms, institutional adoption patterns, macroeconomic correlations, and technical development roadmaps, none of which are present in the provided materials.
Investors interested in ID should conduct independent research through official project channels and verified cryptocurrency data sources to understand the token's fundamentals before making investment decisions.
III. 2026-2031 ID Price Prediction
2026 Outlook
- Conservative prediction: $0.05953 - $0.06542
- Neutral prediction: Around $0.06542
- Optimistic prediction: Up to $0.08701 (requires favorable market conditions and increased adoption)
2027-2029 Outlook
- Market stage expectation: Gradual growth phase with increasing market recognition and utility expansion
- Price range predictions:
- 2027: $0.0503 - $0.10289 (approximately 16% growth from 2026)
- 2028: $0.05821 - $0.11373 (approximately 37% cumulative growth)
- 2029: $0.08944 - $0.11079 (approximately 55% cumulative growth)
- Key catalysts: Enhanced platform integration, growing ecosystem partnerships, and broader market acceptance of decentralized identity solutions
2030-2031 Long-term Outlook
- Baseline scenario: $0.09772 - $0.10622 in 2030 (assuming steady ecosystem development and user base expansion)
- Optimistic scenario: $0.10396 - $0.13277 in 2030, reaching $0.10396 - $0.15175 by 2031 (assuming accelerated adoption and favorable regulatory environment)
- Transformative scenario: Potential to reach upper ranges of $0.15175 by 2031 (requires breakthrough partnerships, significant protocol upgrades, and mass market adoption of decentralized identity systems)
- 2026-01-22: ID shows potential for an 83% cumulative growth trajectory through 2031 based on current market analysis
| Year |
Predicted High Price |
Predicted Average Price |
Predicted Low Price |
Price Change |
| 2026 |
0.08701 |
0.06542 |
0.05953 |
0 |
| 2027 |
0.10289 |
0.07621 |
0.0503 |
16 |
| 2028 |
0.11373 |
0.08955 |
0.05821 |
37 |
| 2029 |
0.11079 |
0.10164 |
0.08944 |
55 |
| 2030 |
0.13277 |
0.10622 |
0.09772 |
62 |
| 2031 |
0.15175 |
0.11949 |
0.10396 |
83 |
IV. ID Professional Investment Strategy and Risk Management
ID Investment Methodology
(1) Long-term Holding Strategy
- Suitable for: Investors who believe in the long-term development of Web3 domain name services and decentralized identity infrastructure
- Operational Recommendations:
- Accumulate positions gradually during market corrections, avoiding concentrated purchases at high price levels
- Focus on Space ID's ecosystem expansion progress, including new blockchain integrations and SDK adoption rates
- Consider storing ID tokens in Gate Web3 Wallet for secure long-term custody with multi-signature protection
(2) Active Trading Strategy
- Technical Analysis Tools:
- Moving Averages: Use 50-day and 200-day moving averages to identify trend directions and potential entry/exit points
- Volume Analysis: Monitor 24-hour trading volume changes to assess market participation intensity and price movement sustainability
- Swing Trading Key Points:
- Set stop-loss orders at 8-10% below entry price to limit potential losses during volatile market conditions
- Take partial profits when ID price approaches previous resistance levels, maintaining core position for potential breakouts
ID Risk Management Framework
(1) Asset Allocation Principles
- Conservative Investors: 2-3% of crypto portfolio allocated to ID
- Aggressive Investors: 5-8% of crypto portfolio allocated to ID
- Professional Investors: Up to 10-15% of crypto portfolio with active hedging strategies
(2) Risk Hedging Solutions
- Portfolio Diversification: Combine ID holdings with established cryptocurrencies and stablecoins to reduce concentration risk
- Position Sizing: Use dollar-cost averaging to mitigate timing risk and reduce impact of short-term price volatility
(3) Secure Storage Solutions
- Hot Wallet Recommendation: Gate Web3 Wallet for convenient trading access and ecosystem interaction
- Cold Storage Solution: Hardware wallets for long-term holdings exceeding trading needs
- Security Considerations: Enable two-factor authentication, regularly backup wallet recovery phrases, and avoid sharing private keys
V. ID Potential Risks and Challenges
ID Market Risks
- Price Volatility: ID experienced an 83.50% decline over the past year, demonstrating significant price fluctuation potential
- Liquidity Risk: With a market cap of approximately $28 million and trading on 36 exchanges, liquidity may be limited during extreme market conditions
- Market Sentiment Dependency: Performance closely tied to overall Web3 and NFT market cycles, which remain highly speculative
ID Regulatory Risks
- Domain Name Service Regulation: Potential regulatory scrutiny of decentralized naming services and their relationship to traditional DNS systems
- Token Classification Uncertainty: Evolving regulatory frameworks may impact ID token's classification and trading restrictions in different jurisdictions
- Cross-chain Compliance: Multi-chain operations may face varying regulatory requirements across different blockchain ecosystems
ID Technical Risks
- Smart Contract Vulnerabilities: Potential security flaws in Space ID's smart contracts could lead to exploitation or fund losses
- Integration Complexity: SDK adoption depends on successful integration by developers, which may face technical challenges or competitive alternatives
- Blockchain Dependency: Reliance on underlying blockchain networks (ETH, BSC) means performance and costs are affected by those networks' scalability limitations
VI. Conclusion and Action Recommendations
ID Investment Value Assessment
Space ID represents a specialized play in the Web3 identity and domain name service sector, with long-term value tied to the broader adoption of decentralized identity solutions. The project's multi-chain approach and developer-focused SDK position it as infrastructure for the evolving Web3 ecosystem. However, the significant price decline over the past year and relatively low circulating supply ratio (21.53% of total supply) present near-term challenges. The current low price compared to its historical high may present opportunity for risk-tolerant investors who believe in the long-term Web3 infrastructure thesis, though substantial uncertainty remains regarding adoption timelines and competitive dynamics.
ID Investment Recommendations
✅ Beginners: Consider minimal allocation (1-2% of crypto portfolio) only after understanding Web3 domain services and accepting high volatility risk
✅ Experienced Investors: May allocate 3-5% of crypto portfolio with active monitoring of ecosystem development milestones and market conditions
✅ Institutional Investors: Evaluate as part of diversified Web3 infrastructure exposure with appropriate hedging strategies and regular portfolio rebalancing
ID Trading Participation Methods
- Spot Trading: Purchase and hold ID tokens on Gate.com with flexible buying and selling options based on market conditions
- Staking Participation: Stake ID tokens to receive discounts on Space ID domain NFT marketplace fees and Web3 domain registrations
- Ecosystem Engagement: Actively participate in Space ID DAO governance proposals to influence platform development direction
Cryptocurrency investment carries extremely high risk, and this article does not constitute investment advice. Investors should make prudent decisions based on their own risk tolerance and are advised to consult professional financial advisors. Never invest more than you can afford to lose.
FAQ
ID has demonstrated volatile price movements over the past year. The highest price reached approximately $0.85, while the lowest dipped to around $0.12. Overall, ID showed an upward trend with significant fluctuations, reflecting market dynamics and investor sentiment in the crypto sector.
Analyze ID price trends using technical analysis tools like moving averages and RSI indicators. Monitor transaction volume, market sentiment, and on-chain data. Track development milestones and ecosystem growth. Use charting platforms for pattern recognition and historical data analysis to forecast potential price movements.
What are the main factors affecting ID price fluctuations?
ID price movements are driven by market demand, trading volume, network adoption growth, technological developments, broader crypto market sentiment, and regulatory news. Supply dynamics and institutional interest also significantly impact price volatility.
What are professional analysts' predictions for ID's future price?
Professional analysts project ID will experience significant growth driven by increased adoption and utility expansion. Many forecast ID reaching higher valuations as the ecosystem matures, with bullish sentiment supported by growing transaction volume and developer activity in the platform.
What risks exist in ID price prediction? What should investors pay attention to?
ID price prediction involves market volatility, liquidity fluctuations, and sentiment shifts. Monitor trading volume trends, technical indicators, and market conditions. Diversify your portfolio and set clear entry/exit strategies. Stay informed about project developments and macro market factors affecting cryptocurrency valuations.
ID demonstrates strong competitive positioning with higher volatility and growth potential than comparable assets. Its price trajectory reflects robust market demand, superior trading volume, and increasing adoption within the Web3 ecosystem, positioning it favorably against peer tokens.
* The information is not intended to be and does not constitute financial advice or any other recommendation of any sort offered or endorsed by Gate.