This comprehensive article analyzes IDEX token's price trajectory from 2026 to 2031, providing expert forecasts and actionable investment strategies for cryptocurrency investors. Currently trading at $0.009211 with a market cap of $9.17 million, IDEX faces significant headwinds including an 81% yearly decline and extreme market fear (index: 20). The analysis examines supply-demand dynamics, macroeconomic factors, and ecosystem development while presenting three prediction scenarios: conservative ($0.00478-$0.0092), neutral ($0.0092), and optimistic ($0.01278) for 2026, with potential growth to $0.02487 by 2031. The article provides detailed investment methodologies for different investor profiles on Gate, risk management frameworks including 1-10% portfolio allocation guidelines, and critical risk assessments covering market volatility, regulatory challenges, and technical vulnerabilities. Designed for both beginners and experienced traders seeking data-driven insights into IDEX's investment potential.
Introduction: IDEX's Market Position and Investment Value
IDEX (IDEX), as a decentralized smart contract exchange built on Ethereum, has been facilitating real-time trading and high-throughput transactions since its launch in 2019. Established by Aurora DAO, the platform supports limit and market orders while enabling multiple transactions to be completed simultaneously. As of 2026, IDEX maintains a market capitalization of approximately $9.17 million, with a circulating supply of around 995 million tokens, and the price stabilizing at approximately $0.009211. This asset, recognized as a pioneering decentralized exchange token, continues to play a role in the decentralized finance ecosystem.
This article will comprehensively analyze IDEX's price trends from 2026 to 2031, combining historical patterns, market supply and demand dynamics, ecosystem development, and macroeconomic conditions to provide investors with professional price forecasts and practical investment strategies.
I. IDEX Price History Review and Market Status
IDEX Historical Price Evolution Trajectory
- 2020: IDEX reached its all-time low at $0.00563813 on March 23, marking a period of subdued market activity
- 2021: The token experienced significant growth momentum, achieving its all-time high of $0.937763 on September 8, representing substantial appreciation from previous levels
- 2022-2025: Following the peak period, IDEX entered a prolonged correction phase, with prices adjusting downward as market conditions evolved
- 2025-2026: The token has shown continued weakness, declining approximately 81.19% over the past year
IDEX Current Market Situation
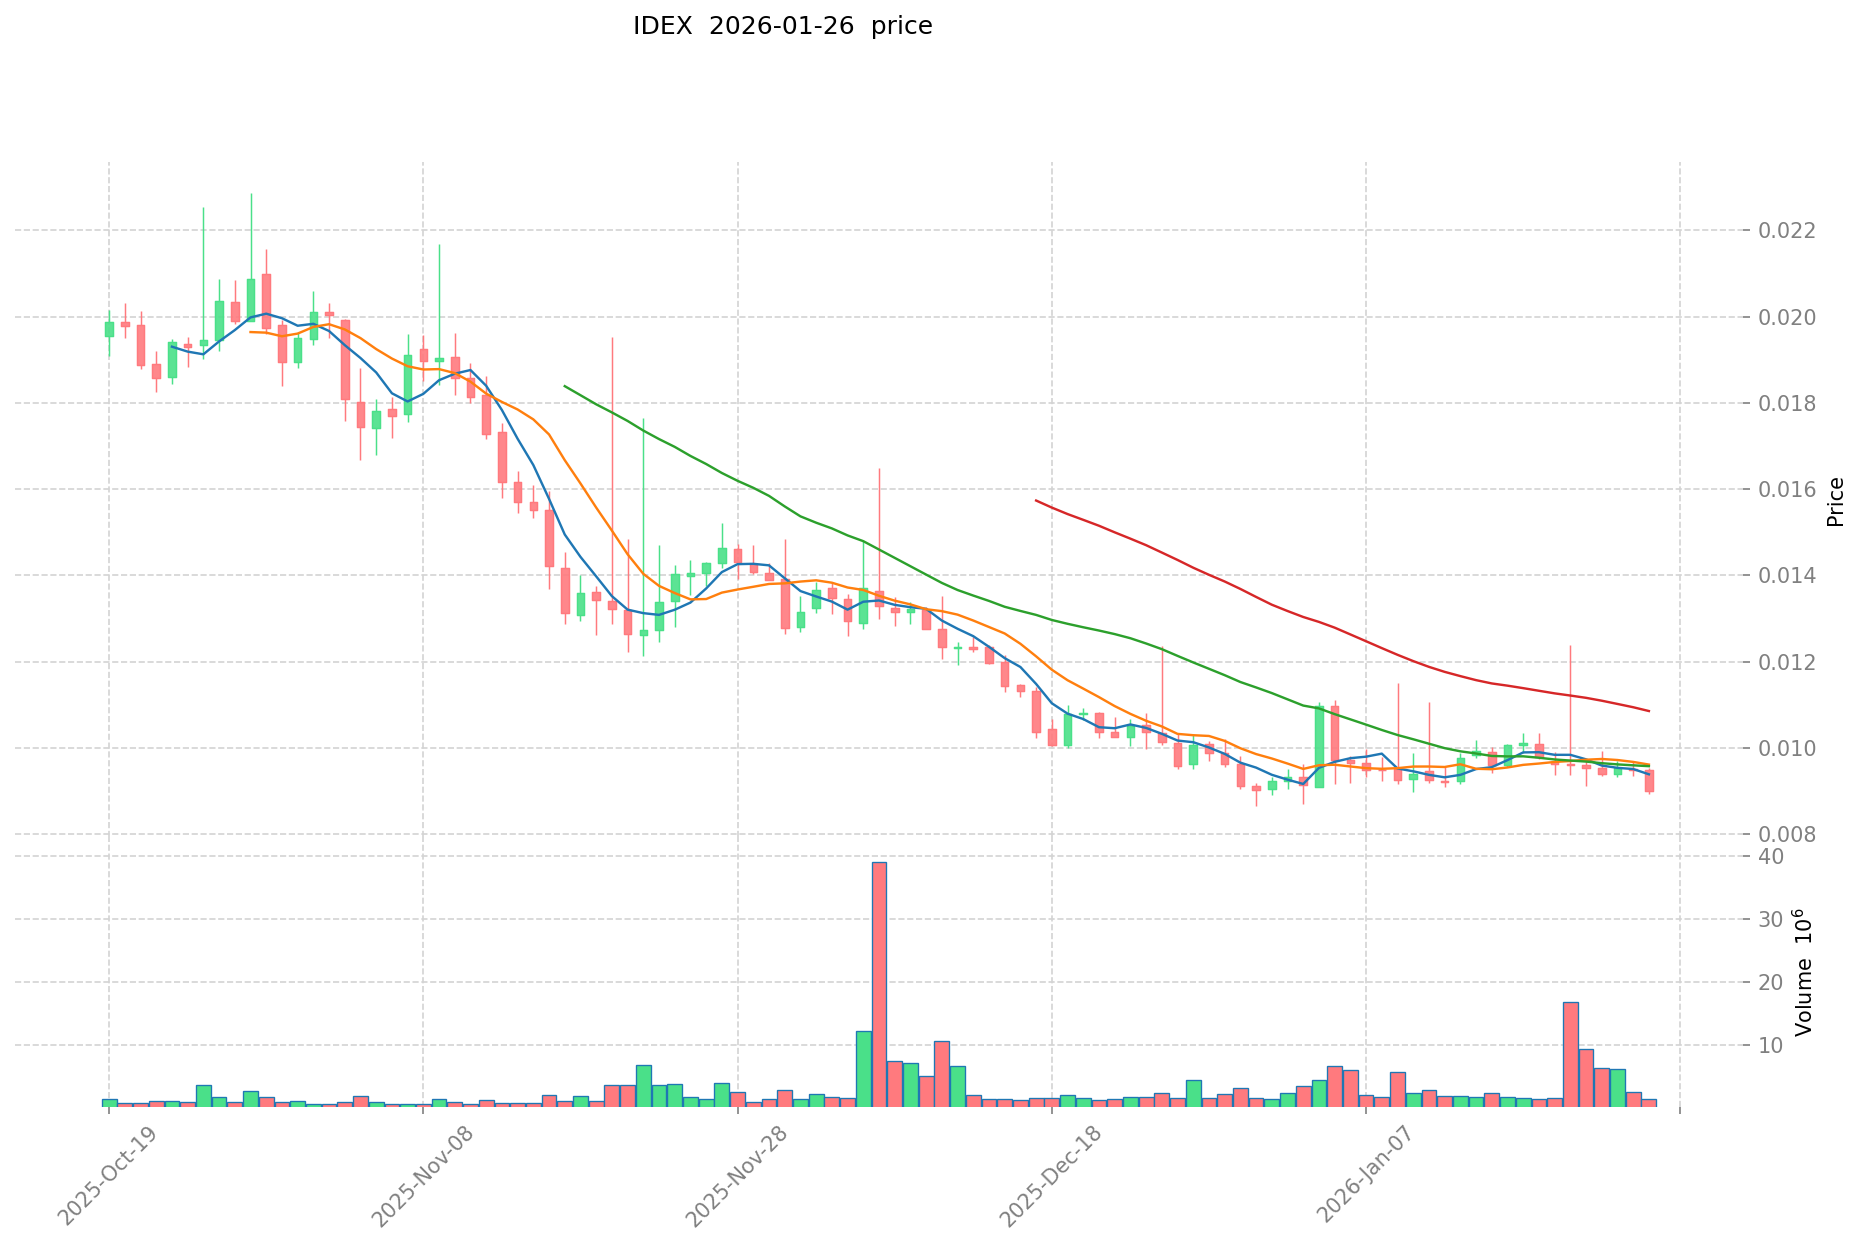
As of January 26, 2026, IDEX is trading at $0.009211, reflecting a modest decline of 0.56% over the past 24 hours. The token has experienced a 24-hour trading range between $0.00894 and $0.009358, with total trading volume reaching $15,685.85.
The current market capitalization stands at approximately $9.17 million, with a circulating supply of 995,161,126.52 IDEX tokens, representing 99.52% of the maximum supply of 1 billion tokens. The fully diluted market cap is $9.21 million, indicating minimal difference between circulating and total valuation. IDEX holds a market dominance of 0.00029% and ranks at position 1240 among tracked crypto assets.
Recent price trends show negative momentum across multiple timeframes: a 0.31% decrease over 1 hour, 3.9% decline over 7 days, and 6.27% drop over 30 days. The token is currently trading approximately 98.02% below its all-time high recorded in September 2021.
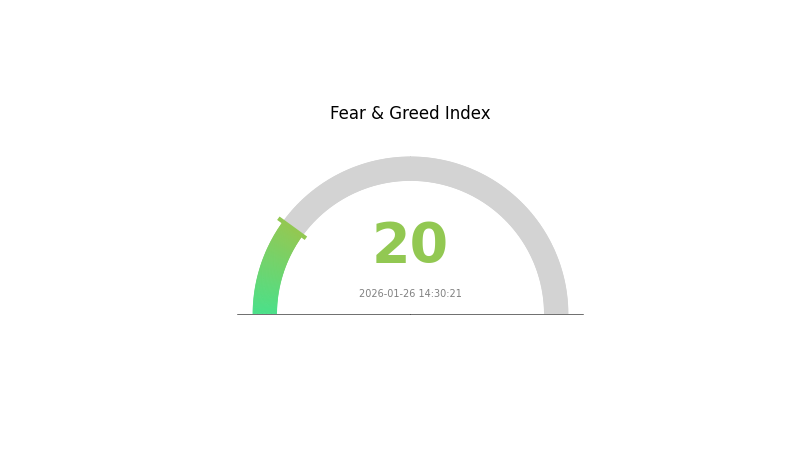
The current market emotion index registers at 20, indicating extreme fear conditions in the broader cryptocurrency market, which may be influencing IDEX's price action alongside other digital assets.
Click to view current IDEX market price
IDEX Market Sentiment Index
2026-01-26 Fear and Greed Index: 20 (Extreme Fear)
Click to view the current Fear & Greed Index
The crypto market is currently experiencing extreme fear, with the index reading at 20. This represents a significant shift in market psychology, where investors are highly risk-averse and pessimistic about near-term price movements. During periods of extreme fear, contrarian traders often see opportunities for strategic accumulation, while conservative investors may exercise caution. Market volatility tends to spike under these conditions. Monitor key support levels and maintain proper risk management strategies when trading in such sentiment extremes.
IDEX Holding Distribution
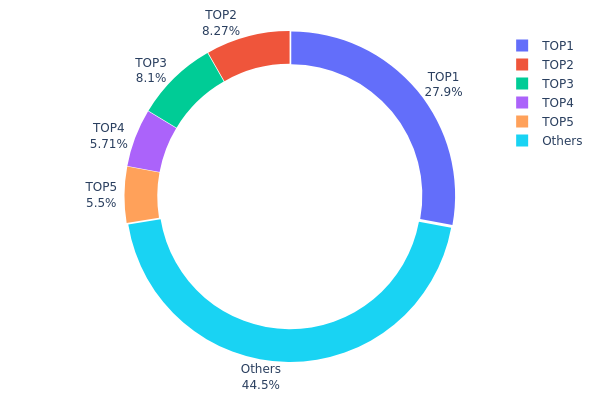
The holding distribution chart represents the concentration of IDEX tokens across different wallet addresses, revealing the extent to which token supply is controlled by major holders versus distributed among smaller participants. This metric serves as a critical indicator of market centralization and potential vulnerability to large-scale sell pressure.
Based on current data, IDEX exhibits a notably concentrated holding structure. The top address controls approximately 27.88% of the total supply (278,840.49K tokens), while the top five addresses collectively hold 55.44% of all circulating tokens. This significant concentration suggests that a relatively small number of entities possess substantial influence over the token's market dynamics. The remaining 44.56% distributed among other addresses indicates moderate decentralization beyond the major holders, though the dominance of top-tier addresses remains pronounced.
This concentration level presents both opportunities and risks for market participants. On one hand, large holders may provide stability through long-term commitment to the project. However, such centralization also creates vulnerability to coordinated selling pressure and potential price manipulation. The substantial holdings of the top address particularly warrant attention, as any significant movement could trigger considerable market volatility. For investors, this distribution pattern necessitates careful monitoring of major holder activities and consideration of liquidity risks during periods of market stress.
Click to view current IDEX Holding Distribution
| Top |
Address |
Holding Qty |
Holding (%) |
| 1 |
0xf977...41acec |
278840.49K |
27.88% |
| 2 |
0xcea6...2a0d13 |
82716.73K |
8.27% |
| 3 |
0x9825...056519 |
80997.17K |
8.09% |
| 4 |
0xad25...e9ea2a |
57098.98K |
5.70% |
| 5 |
0x247e...702d04 |
55000.00K |
5.50% |
| - |
Others |
445346.62K |
44.56% |
II. Core Factors Influencing IDEX's Future Price
Supply and Demand Dynamics
-
Supply-Side Shifts: The diamond market has experienced fundamental changes in supply structure. Historically, De Beers maintained near-monopoly control over global diamond supply at approximately 90%, carefully managing output to support pricing. However, the discovery of new diamond deposits worldwide has gradually eroded this monopoly position.
-
Lab-Grown Diamond Impact: The emergence of lab-grown diamonds represents a transformative supply-side development. These synthetic alternatives can be produced within weeks at costs ranging from 1/10 to 1/5 of natural diamonds, while maintaining identical physical properties including composition, hardness, and optical characteristics. According to industry data, global lab-grown diamond production capacity has reached approximately 40 million carats, with China accounting for roughly 63% at 25.2 million carats.
-
Demand Contraction: Marriage rates in key Asian markets have declined substantially, directly impacting diamond jewelry demand. Japan recorded 489,300 marriages in 2023, the first time below 500,000 since World War II. South Korea has experienced 11 consecutive years of declining marriage registrations since 2012, falling below 300,000 in 2016 and 200,000 in 2021.
-
IDEX Price Trajectory: The International Diamond Exchange (IDEX) diamond index declined from its 2022 peak of 158 to approximately 86.08, representing a decline exceeding 45%. This downward trend has persisted into 2025, with RapNet Diamond Price Index (RAPI) showing 0.5-carat diamond prices falling over 20% throughout the year.
-
Segment Differentiation: Market depreciation has been most pronounced in entry-level diamonds of 0.5 carats and below, which historically dominated bridal jewelry sales. Their secondary market and buyback values have declined significantly. By contrast, diamonds exceeding 1 carat with superior quality grades have demonstrated relatively more stable pricing, though still under pressure.
-
Producer Response: De Beers, as the world's largest diamond producer, implemented unprecedented pricing adjustments. In January 2025, the company substantially reduced prices for rough diamonds above 0.75 carats. Previous reductions in late 2024 ranged from 10% to 15%, marking historically significant decreases as the company responded to market conditions described by industry observers as an unusual recession.
Macroeconomic Context
-
Interest Rate Environment: Short-term diamond pricing remains sensitive to inventory levels and global interest rate movements. Market expectations suggest continued monetary policy adjustments, with potential implications for luxury goods demand and financing costs throughout the supply chain.
-
Consumer Sentiment: The divergence between diamond and gold market performance reflects broader shifts in consumer attitudes toward store-of-value assets. While gold has benefited from concerns over monetary expansion and sovereign debt levels, diamonds face headwinds from changing cultural attitudes toward traditional luxury purchases.
Emerging Growth Opportunities
-
Industrial Applications: New demand channels are emerging beyond traditional jewelry markets. Industry analysis suggests the AI chip sector could create substantial opportunities for diamond heat dissipation solutions. Projections estimate the diamond thermal management market could range from 7.5 billion to 150 billion yuan by 2030, depending on adoption rates across AI chip manufacturing.
-
Long-Term Value Factors: According to Shanghai Diamond Exchange, natural diamond pricing over the long term remains supported by three fundamental factors: inherent scarcity of natural diamonds, steady growth in market demand, and continued global economic development. The ongoing decline in natural diamond extraction volumes may provide structural support for future price stabilization.
III. 2026-2031 IDEX Price Prediction
2026 Outlook
- Conservative Prediction: $0.00478 - $0.0092
- Neutral Prediction: Around $0.0092
- Optimistic Prediction: Up to $0.01278 (requires favorable market conditions and increased trading volume)
2027-2029 Outlook
- Market Stage Expectation: The token may enter a gradual growth phase, with potential volatility as the market matures and adoption expands.
- Price Range Predictions:
- 2027: $0.01055 - $0.01517
- 2028: $0.01112 - $0.01399
- 2029: $0.00907 - $0.01949
- Key Catalysts: Platform upgrades, ecosystem expansion, and broader adoption of decentralized exchange solutions could support price appreciation.
2030-2031 Long-term Outlook
- Baseline Scenario: $0.01387 - $0.02328 (assuming steady platform development and moderate market growth)
- Optimistic Scenario: $0.01651 - $0.02487 (contingent on enhanced liquidity, strategic partnerships, and increased user engagement)
- Transformative Scenario: Potential to reach $0.02487 by 2031 (under conditions of exceptional market momentum and widespread DeFi adoption)
- 2026-01-26: IDEX trading at approximately $0.0092 (current baseline reference point)
| Year |
Predicted High Price |
Predicted Average Price |
Predicted Low Price |
Price Change |
| 2026 |
0.01278 |
0.0092 |
0.00478 |
0 |
| 2027 |
0.01517 |
0.01099 |
0.01055 |
19 |
| 2028 |
0.01399 |
0.01308 |
0.01112 |
41 |
| 2029 |
0.01949 |
0.01353 |
0.00907 |
46 |
| 2030 |
0.02328 |
0.01651 |
0.01387 |
79 |
| 2031 |
0.02487 |
0.0199 |
0.01015 |
116 |
IV. IDEX Professional Investment Strategy and Risk Management
IDEX Investment Methodology
(I) Long-term Holding Strategy
- Suitable for: Investors who believe in decentralized exchange infrastructure and prefer lower volatility exposure
- Operational recommendations:
- Consider accumulating positions during market downturns when price approaches historical support levels
- Monitor the development progress of IDEX platform and ecosystem growth metrics
- For secure storage, utilize Gate Web3 Wallet which supports Ethereum-based tokens with multi-layer security features
(II) Active Trading Strategy
- Technical analysis tools:
- Moving Averages: Utilize 50-day and 200-day moving averages to identify potential trend reversals and entry/exit points
- Volume Analysis: Monitor 24-hour trading volume patterns to confirm price movements and market interest
- Swing trading considerations:
- Pay attention to significant support level around $0.00564 (near historical low) and resistance zones
- Consider the correlation between IDEX price movements and broader decentralized exchange sector trends
IDEX Risk Management Framework
(I) Asset Allocation Principles
- Conservative investors: 1-2% of crypto portfolio
- Moderate investors: 3-5% of crypto portfolio
- Aggressive investors: Up to 8-10% of crypto portfolio
(II) Risk Hedging Solutions
- Portfolio diversification: Balance IDEX holdings with other exchange tokens and DeFi infrastructure projects
- Position sizing: Implement scaled entry and exit strategies to manage average cost basis
(III) Secure Storage Solutions
- Recommended wallet: Gate Web3 Wallet offers comprehensive security features for Ethereum-based tokens like IDEX
- Cold storage option: Consider hardware wallet solutions for long-term holdings exceeding portfolio allocation thresholds
- Security considerations: Enable two-factor authentication, never share private keys, and regularly verify contract addresses before transactions
V. IDEX Potential Risks and Challenges
IDEX Market Risks
- Price volatility: IDEX has experienced significant price fluctuation with a 1-year decline of approximately 81%, indicating high market volatility
- Liquidity concerns: Current 24-hour trading volume of around $15,686 suggests relatively limited market liquidity compared to major cryptocurrencies
- Market cap positioning: With a market capitalization around $9.17 million and ranking at #1240, IDEX faces challenges in market visibility
IDEX Regulatory Risks
- Decentralized exchange scrutiny: Increasing global regulatory attention on DeFi platforms and DEX operations may impact IDEX's operational model
- Compliance evolution: Potential future regulatory requirements for DEX platforms could necessitate operational adjustments
- Cross-border considerations: Different regulatory approaches across jurisdictions may affect IDEX's accessibility and user base
IDEX Technical Risks
- Smart contract vulnerabilities: As an Ethereum-based platform, IDEX faces inherent smart contract security risks
- Network dependency: Platform performance is tied to Ethereum network congestion and gas fee fluctuations
- Competitive pressure: Increasing competition from other decentralized exchanges may affect IDEX's market share and user adoption
VI. Conclusion and Action Recommendations
IDEX Investment Value Assessment
IDEX represents a decentralized exchange infrastructure project with established operational history since 2019. While the platform offers real-time trading, high throughput, and advanced order features, investors should note the significant price depreciation over the past year and relatively modest market capitalization. The project's long-term value proposition depends on successful ecosystem development and user adoption in an increasingly competitive DEX landscape. Short-term risks include market volatility, liquidity constraints, and evolving regulatory environments.
IDEX Investment Recommendations
✅ Beginners: Consider small allocations (1-2% of crypto portfolio) only after thoroughly understanding decentralized exchange mechanisms and accepting high volatility risks
✅ Experienced investors: May employ strategic accumulation during market corrections while maintaining strict position limits and utilizing technical analysis for entry/exit timing
✅ Institutional investors: Conduct comprehensive due diligence on platform metrics, competitive positioning, and regulatory compliance before considering any allocation
IDEX Trading Participation Methods
- Spot trading: Available on Gate.com and other cryptocurrency exchanges supporting IDEX with direct buy/sell capabilities
- Secure storage: Utilize Gate Web3 Wallet for safe custody of IDEX tokens with user-controlled private keys
- Research-based approach: Monitor platform development updates, trading volume trends, and broader DeFi sector movements before making investment decisions
Cryptocurrency investment carries extremely high risks, and this article does not constitute investment advice. Investors should make prudent decisions based on their own risk tolerance and are advised to consult professional financial advisors. Never invest more than you can afford to lose.
FAQ
IDEX has reached an all-time high of $0.97 and an all-time low of $0.0086. Recent 24-hour trading activity shows prices fluctuating between $0.009 and $0.0115, demonstrating moderate market volatility and dynamic price movements.
What are the main factors affecting IDEX price?
IDEX price is primarily influenced by supply mechanisms, market demand, technology upgrades, DeFi ecosystem development, and macroeconomic factors. Trading volume and institutional adoption also significantly impact price movements.
How to conduct IDEX price technical analysis and prediction?
Analyze IDEX price using technical charts to identify support and resistance levels. Apply technical indicators like moving averages and RSI to identify trading patterns and predict future price movements based on historical data trends.
What are the advantages of IDEX compared to other decentralized exchange tokens?
IDEX offers lower trading fees, enhanced security, and superior user experience. It utilizes advanced protocols to reduce intermediary tokens while providing faster transactions and better liquidity compared to other DEX tokens.
What are the main risks of investing in IDEX tokens?
Main risks include intense market competition in the DEX sector, technological iteration demands, potential user loss affecting transaction volume and token value, and the need for continuous ecosystem expansion.
* The information is not intended to be and does not constitute financial advice or any other recommendation of any sort offered or endorsed by Gate.