This comprehensive analysis examines INFINIT (IN) token's price trajectory from 2026 to 2031, providing investors with data-driven forecasts and strategic guidance. As an AI-powered DeFi intelligence protocol, IN currently trades at $0.0768 with a market cap of $17.53 million, backed by prominent investors including Electric Capital and Mirana Ventures. The article evaluates IN's market position, historical price evolution, and holding distribution, revealing moderate concentration with 34.11% controlled by top five addresses. Forecasts suggest conservative 2026 performance ($0.04953-$0.11107), followed by accelerating growth through 2031, potentially reaching $0.17777 under optimistic scenarios. The analysis outlines professional investment methodologies including long-term holding and active trading strategies, alongside comprehensive risk management frameworks. Investment recommendations vary by investor type, from newcomers starting with 1-3% allocation to institutional investors conducting due diligence.
Introduction: IN's Market Position and Investment Value
INFINIT (IN), as an AI-powered DeFi intelligence protocol, has been transforming how users discover, evaluate, and execute DeFi opportunities since its launch in 2025. As of January 24, 2026, IN maintains a market capitalization of approximately $17.53 million, with a circulating supply of about 228.33 million tokens, and a price hovering around $0.0768. This asset, recognized as a "DeFi democratization enabler through AI agents," is playing an increasingly vital role in simplifying DeFi access through intelligent agents and natural language interfaces.
Backed by prominent investors including Electric Capital, Mirana Ventures, Hashed, and Lightspeed Faction, INFINIT powers the Agentic DeFi Economy—a decentralized, agent-based infrastructure where KOLs and DeFi experts can create and monetize strategies while users execute complex multi-step DeFi operations with a single click. With a fully diluted valuation of $76.78 million and a market cap to FDV ratio of 22.83%, IN represents an emerging asset class at the intersection of artificial intelligence and decentralized finance.
This article will comprehensively analyze IN's price trajectory from 2026 to 2031, combining historical patterns, market supply-demand dynamics, ecosystem development, and macroeconomic conditions to provide investors with professional price forecasts and practical investment strategies.
I. IN Price History Review and Current Market Status
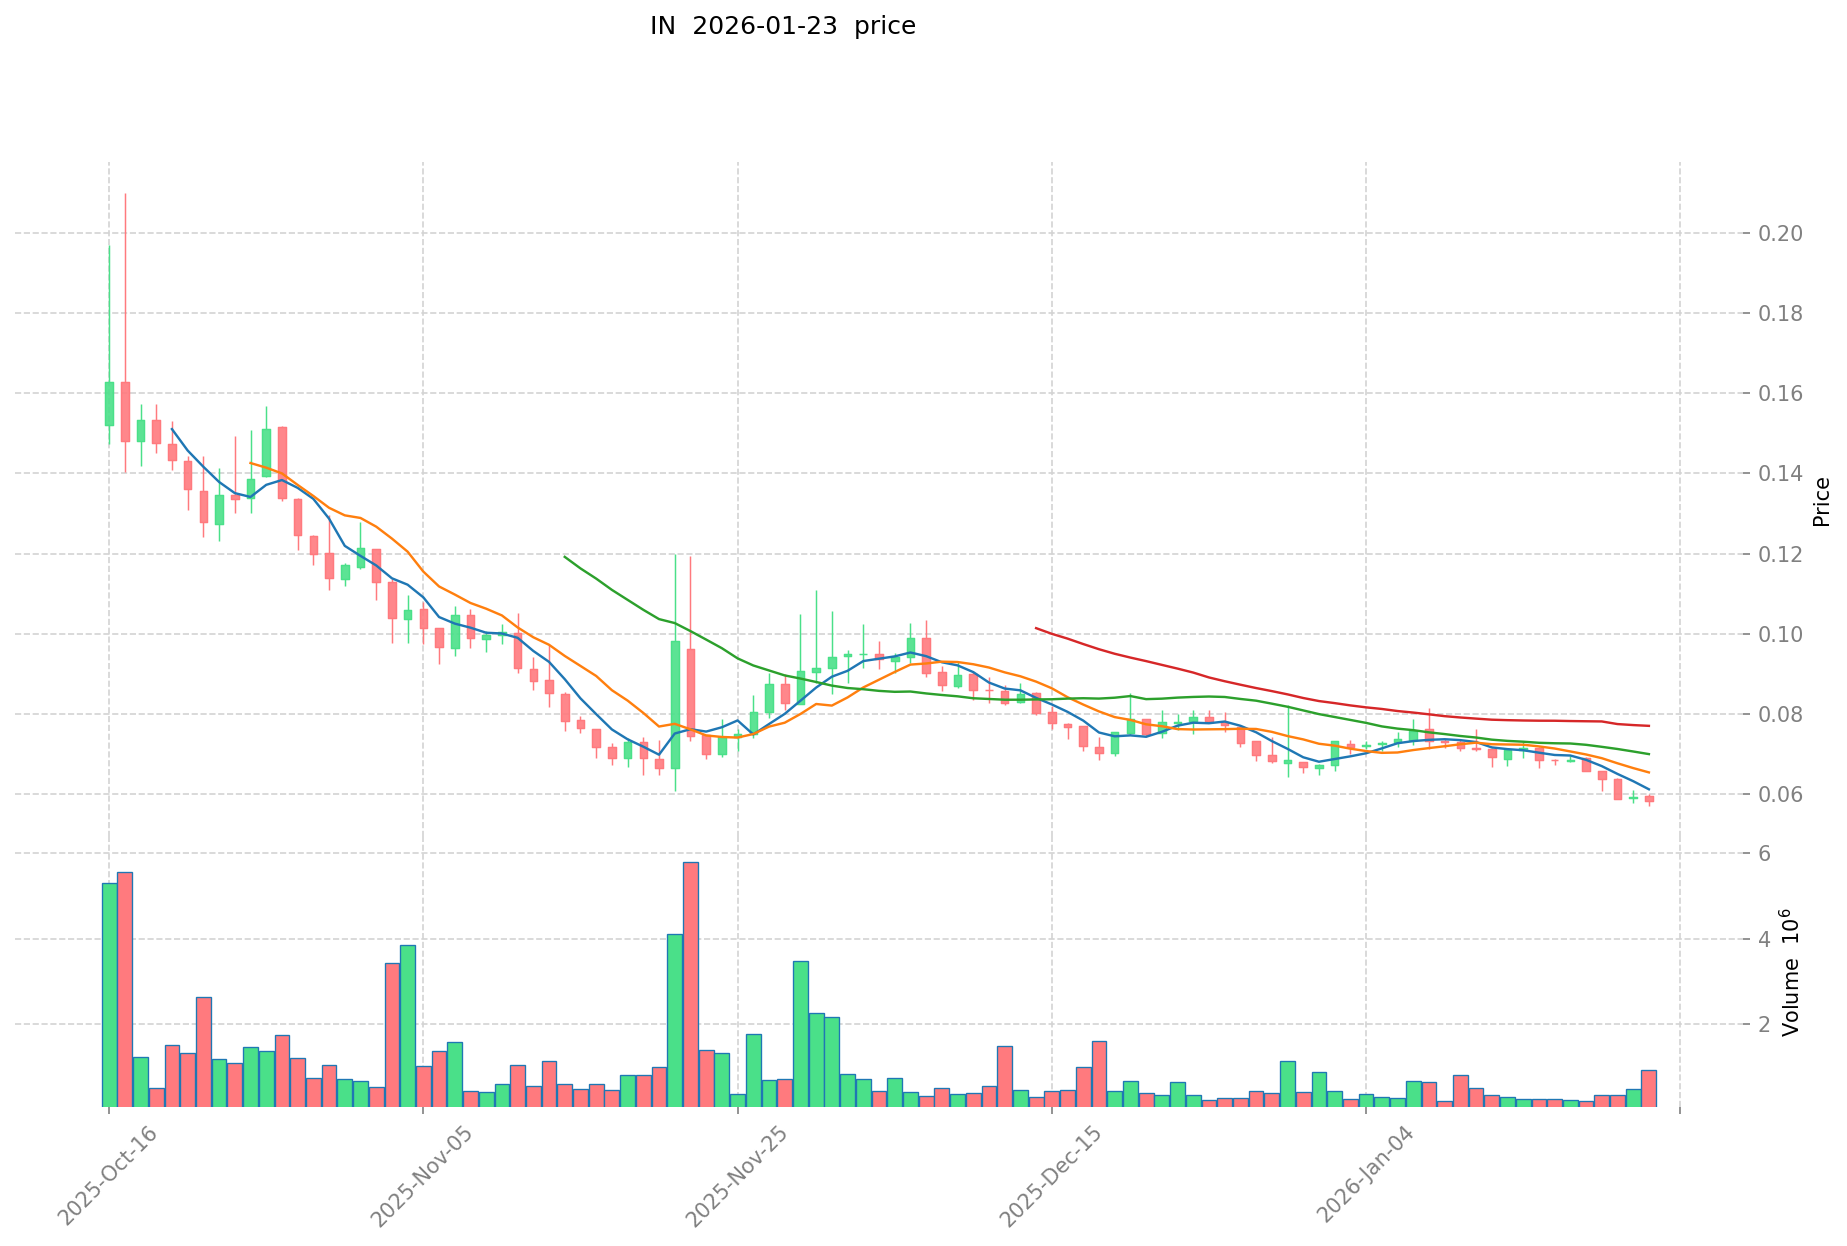
IN Historical Price Evolution Trajectory
- 2025: Token launched in September with initial trading activity, price established a low point at $0.05379
- 2025: October witnessed notable market momentum, price reached a peak of $0.32118
- 2025-2026: Market correction phase, price adjusted from peak levels to current trading range
IN Current Market Status
As of January 24, 2026, IN is trading at $0.07678, representing a 24-hour increase of 31.52%. The token's current market capitalization stands at $17,531,433.33, with a circulating supply of 228,333,333.33 IN tokens, accounting for 22.83% of the total supply of 1 billion tokens.
The trading activity shows a 24-hour volume of $8,002,237.78, with the price fluctuating between $0.05756 and $0.11016 during this period. Over the past 7 days, IN has recorded an 11.97% gain, though the 30-day performance shows a decline of 5.1%. The fully diluted market capitalization is estimated at $76,780,000.
INFINIT ranks 930th by market capitalization, with a market share of 0.0024%. The token is currently held by 603 addresses and is listed on 20 exchanges. The current price reflects a 76.1% distance from its all-time high of $0.32118 recorded in October 2025, while positioned 42.7% above its all-time low of $0.05379 from September 2025.
Click to view current IN market price
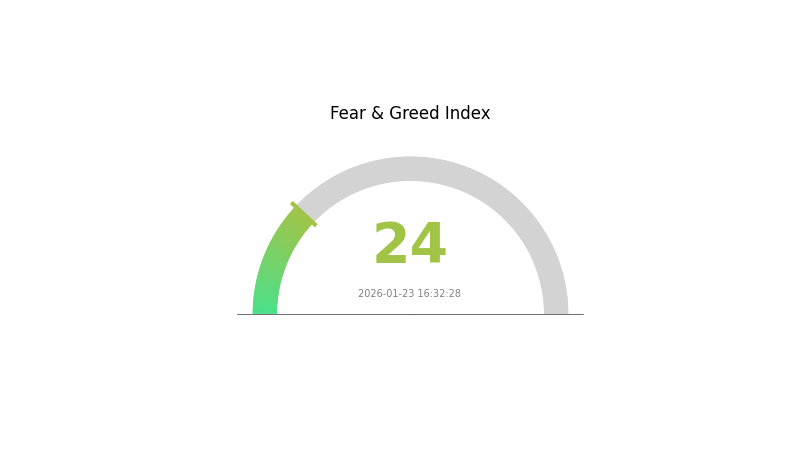
IN Market Sentiment Index
2026-01-23 Fear and Greed Index: 24 (Extreme Fear)
Click to view current Fear & Greed Index
The crypto market is experiencing extreme fear, with the Fear and Greed Index dropping to 24. This indicates significant market anxiety and pessimism among investors. When fear reaches such extreme levels, it often presents contrarian buying opportunities for long-term investors, as assets may be oversold. However, exercise caution during periods of extreme fear, as markets can remain volatile. Monitor key support levels and diversify your portfolio accordingly on Gate.com.
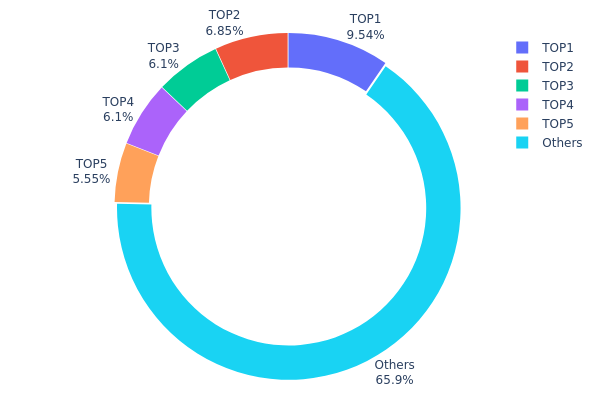
IN Holding Distribution
The holding distribution chart reveals the concentration of tokens across different wallet addresses, serving as a key indicator of decentralization and potential market manipulation risks. According to the current data, the top five addresses collectively hold approximately 34.11% of IN's total supply, with the largest single address controlling 9.53% (85,917.56K tokens). The "Others" category accounts for 65.89% of the distribution, indicating that the remaining supply is dispersed among numerous smaller holders.
This distribution pattern suggests a moderate level of concentration. While no single entity dominates the market with an overwhelming majority, the combined holdings of the top five addresses exceed one-third of the circulating supply. Such concentration levels typically introduce elevated volatility risks, as large holders possess sufficient market influence to impact price movements through significant buy or sell activities. Additionally, the relatively balanced distribution among the top addresses (ranging from 5.54% to 9.53%) indicates that no single whale holds disproportionate control, which partially mitigates centralization concerns.
From a market structure perspective, IN demonstrates reasonable decentralization characteristics. The fact that nearly two-thirds of tokens are held outside the top five addresses suggests healthy retail participation and broader community engagement. However, investors should remain vigilant regarding potential coordinated actions among major holders, as the concentration within the top tier still provides sufficient leverage to influence short-term price dynamics and liquidity conditions.
Click to view current IN Holding Distribution
| Top |
Address |
Holding Qty |
Holding (%) |
| 1 |
0xab0a...486fce |
85917.56K |
9.53% |
| 2 |
0xbe83...daea8a |
61678.46K |
6.84% |
| 3 |
0xaa2d...f0899a |
55000.00K |
6.10% |
| 4 |
0x6e64...f15f40 |
55000.00K |
6.10% |
| 5 |
0x4d07...538f14 |
50000.00K |
5.54% |
| - |
Others |
593349.16K |
65.89% |
II. Core Factors Affecting IN's Future Price
Due to the lack of available data regarding IN's supply mechanisms, institutional dynamics, macroeconomic correlations, and technical developments, a comprehensive analysis of the core factors affecting its future price cannot be provided at this time. Investors are advised to conduct thorough research and monitor official project announcements for the latest information before making any investment decisions.
III. 2026-2031 IN Price Forecast
2026 Outlook
- Conservative forecast: $0.04953 - $0.07505
- Neutral forecast: Around $0.07505
- Optimistic forecast: Up to $0.11107 (requires favorable market conditions and increased adoption)
The 2026 forecast suggests a relatively modest price range, with the token potentially experiencing a slight decline of approximately 2% compared to previous levels. Market participants should anticipate consolidation as the project establishes its market position.
2027-2029 Mid-term Outlook
- Market stage expectation: Progressive recovery and growth phase, with steady momentum building across multiple years
- Price range forecast:
- 2027: $0.08934 - $0.10888, with approximately 21% growth potential
- 2028: $0.07472 - $0.14439, showing 31% upward movement possibilities
- 2029: $0.08956 - $0.13127, projecting 59% growth trajectory
- Key catalysts: Expanding ecosystem adoption, potential protocol upgrades, and broader cryptocurrency market recovery trends may serve as primary drivers for price appreciation during this period.
The mid-term outlook indicates an accelerating growth pattern, with year-over-year improvements suggesting strengthening fundamentals and market confidence.
2030-2031 Long-term Outlook
- Baseline scenario: $0.0838 - $0.12698 (assuming steady ecosystem development and moderate market conditions)
- Optimistic scenario: $0.11733 - $0.17777 (contingent upon significant adoption milestones and favorable regulatory environment)
- Transformative scenario: Potential to approach $0.17777 (requires exceptional market dynamics, widespread institutional adoption, and breakthrough technological implementations)
By 2030, projections suggest a potential 65% growth rate, while 2031 forecasts indicate a possible 98% increase, reflecting sustained long-term confidence in the project's trajectory. These extended forecasts assume continued project development, maintained network security, and positive market sentiment within the broader digital asset ecosystem.
| Year |
Predicted High Price |
Predicted Average Price |
Predicted Low Price |
Price Change |
| 2026 |
0.11107 |
0.07505 |
0.04953 |
-2 |
| 2027 |
0.10888 |
0.09306 |
0.08934 |
21 |
| 2028 |
0.14439 |
0.10097 |
0.07472 |
31 |
| 2029 |
0.13127 |
0.12268 |
0.08956 |
59 |
| 2030 |
0.17777 |
0.12698 |
0.0838 |
65 |
| 2031 |
0.16608 |
0.15237 |
0.11733 |
98 |
IV. IN Professional Investment Strategy and Risk Management
IN Investment Methodology
(1) Long-term Holding Strategy
- Suitable for: DeFi-focused investors and believers in AI-driven protocol innovation
- Operational recommendations:
- Consider accumulating positions during market corrections, given the 22.83% current circulation ratio and potential for gradual token unlocks
- Monitor the development progress of INFINIT's Agentic DeFi Economy infrastructure and adoption metrics
- Store assets in secure wallets such as Gate Web3 Wallet for enhanced security and accessibility
(2) Active Trading Strategy
- Technical analysis tools:
- Volume analysis: Track the 24-hour trading volume of $8,002,237.78 to identify accumulation or distribution phases
- Support and resistance levels: Monitor the recent 24-hour range between $0.05756 and $0.11016 for potential trading opportunities
- Swing trading considerations:
- The token has shown volatility with a 31.52% increase in 24 hours, suggesting active trading opportunities
- Consider the 7-day performance of 11.97% when evaluating short-term momentum
IN Risk Management Framework
(1) Asset Allocation Principles
- Conservative investors: 2-5% of crypto portfolio allocation
- Aggressive investors: 5-10% of crypto portfolio allocation
- Professional investors: Up to 15% with active monitoring and hedging strategies
(2) Risk Hedging Solutions
- Diversification approach: Combine IN holdings with established DeFi blue-chip tokens to balance risk exposure
- Position sizing: Given the early-stage nature and 22.83% circulation ratio, maintain position sizes aligned with risk tolerance
(3) Secure Storage Solutions
- Hot wallet recommendation: Gate Web3 Wallet for convenient trading and DeFi interactions
- Cold storage option: Hardware wallet solutions for long-term holdings exceeding individual risk thresholds
- Security precautions: Enable two-factor authentication, verify contract addresses (0x61fac5f038515572d6f42d4bcb6b581642753d50 on Ethereum), and never share private keys
V. IN Potential Risks and Challenges
IN Market Risks
- Price volatility: The token experienced a 24-hour range from $0.05756 to $0.11016, indicating potential for rapid price swings
- Liquidity considerations: With a market cap of approximately $17.53 million, position exits may impact price during periods of low volume
- Competition risk: The AI-driven DeFi sector is experiencing rapid innovation, with multiple projects competing for market share
IN Regulatory Risks
- DeFi regulatory uncertainty: Evolving global regulatory frameworks for decentralized finance protocols may impact project operations
- AI integration oversight: Potential future regulations regarding AI agents in financial services could affect the platform's core functionality
- Tokenomics compliance: Changes in securities regulations may influence how utility tokens are classified across different jurisdictions
IN Technical Risks
- Smart contract vulnerabilities: As with all DeFi protocols, potential exists for undiscovered bugs or exploits in the protocol's smart contracts
- AI agent reliability: The accuracy and performance of AI-driven investment recommendations depend on data quality and algorithm effectiveness
- Integration complexity: The platform's one-click execution of multi-step DeFi strategies requires reliable integration with multiple protocols
VI. Conclusion and Action Recommendations
IN Investment Value Assessment
INFINIT presents an innovative approach to simplifying DeFi participation through AI-powered agents and natural language interfaces. The project has secured backing from notable investors including Electric Capital, Mirana Ventures, Hashed, and Lightspeed Faction, suggesting institutional confidence in its vision. With a relatively low circulation ratio of 22.83% and a fully diluted valuation of $76.78 million, the project remains in an early stage of development.
The Agentic DeFi Economy concept addresses genuine pain points in DeFi accessibility, potentially positioning INFINIT to benefit from broader trends in both AI and decentralized finance. However, investors should note the inherent volatility reflected in recent price movements and the competitive landscape of AI-DeFi projects. The project's success will largely depend on user adoption, the effectiveness of its AI agents, and the platform's ability to maintain security while delivering on its simplified DeFi execution promise.
IN Investment Recommendations
✅ Newcomers: Begin with small allocations (1-3% of crypto portfolio) to gain exposure while learning about the platform's functionality. Utilize Gate Web3 Wallet for secure storage and monitor project developments through official channels.
✅ Experienced investors: Consider moderate positions (3-7%) with defined entry and exit strategies based on technical indicators. Monitor the platform's user growth metrics and strategic partnerships as indicators of adoption momentum.
✅ Institutional investors: Conduct thorough due diligence on the team's execution capabilities and smart contract security. Consider staged entry strategies given the low current circulation ratio and potential token unlock schedules.
IN Trading Participation Methods
- Spot trading: Available on Gate.com and 19 other exchanges, providing multiple liquidity venues for position building or exits
- DeFi interactions: Direct engagement with the INFINIT platform to experience the AI-driven strategy execution functionality
- Strategic accumulation: Dollar-cost averaging approach during market volatility to build positions over time while managing entry price risk
Cryptocurrency investment carries extremely high risks, and this article does not constitute investment advice. Investors should make prudent decisions based on their own risk tolerance and are advised to consult professional financial advisors. Never invest more than you can afford to lose.
FAQ
What is the current price of IN token? What are its all-time high and all-time low prices?
IN token's current price fluctuates based on market conditions. Historical all-time high reached approximately $0.85, while all-time low stood near $0.02. Real-time pricing varies across different trading venues.
What factors influence IN token price movements?
IN token price is influenced by market demand and trading volume, project developments and partnerships, overall cryptocurrency market sentiment, network adoption rates, and macroeconomic conditions. Technical analysis indicators and investor sentiment also play significant roles in price fluctuations.
How to predict IN token price? What technical analysis methods are recommended?
Analyze IN price trends using candlestick charts, moving averages, and RSI indicators. Monitor trading volume changes and market sentiment. Track resistance and support levels. Study historical price patterns and correlation with broader crypto market movements for comprehensive prediction.
What are the future price prospects of IN token? How do professional analysts view it?
IN token shows strong growth potential driven by increasing adoption and ecosystem expansion. Professional analysts project bullish sentiment, citing its technological innovation and growing transaction volume as key drivers for potential price appreciation in the coming years.
What is the price volatility risk of IN tokens? What should investors pay attention to?
IN token shows moderate volatility typical of emerging crypto assets. Price movements correlate with market sentiment and trading volume. Monitor market trends, diversify holdings, and invest within your risk tolerance. Current momentum suggests growth potential as adoption increases.
How does IN token's price performance compare to other mainstream cryptocurrencies?
IN token demonstrates competitive price momentum with strong volatility advantages. Its price movement often outpaces Bitcoin and Ethereum, offering higher growth potential. Supported by increasing trading volume and adoption, IN maintains resilience during market cycles with notable upward trajectory.
* The information is not intended to be and does not constitute financial advice or any other recommendation of any sort offered or endorsed by Gate.