This comprehensive analysis examines IOST's price trajectory and investment potential from 2026 through 2031. IOST, a blockchain platform backed by institutional investors including Sequoia Capital, currently trades at $0.001582 with a market capitalization of $48.64 million. The article evaluates key value drivers including IOST 3.0's Layer 2 transformation, real-world asset tokenization opportunities, and PayFi solutions. Price forecasts range from $0.00128-$0.00163 in 2026, with extended outlooks reaching $0.00356 by 2031 under optimistic scenarios. The analysis covers technical developments, ecosystem adoption factors, supply mechanics including token burn mechanisms, and institutional support dynamics. Professional investment strategies emphasize risk management through diversified allocation—1-3% for conservative investors to 15% for professionals. Critical risk factors include extreme token concentration (90.79% in single address), limited liquidity, and intense competition from established blockchain
Introduction: IOST's Market Position and Investment Value
IOST (IOST), as a blockchain application platform developed for online service providers and backed by top-tier investment institutions including Sequoia and ZhenFund, has established itself as a notable player in the DApp public chain ecosystem since its inception in 2018. As of 2026, IOST maintains a market capitalization of approximately $48.64 million, with a circulating supply of around 30.75 billion tokens, and a price hovering near $0.001582. This asset, recognized for its horizontal scalability and high throughput capabilities achieved through the PoB consensus mechanism, is playing an increasingly important role in providing value realization platforms for third-party developers, creators, and enterprises.
This article will comprehensively analyze IOST's price trends from 2026 to 2031, combining historical patterns, market supply and demand dynamics, ecosystem development, and macroeconomic environment considerations to provide investors with professional price forecasts and practical investment strategies.
I. IOST Price History Review and Market Status
IOST Historical Price Evolution Trajectory
- 2018: On January 24, IOST reached a significant price milestone during the cryptocurrency market rally, with the token trading at levels substantially higher than its initial offering
- 2025: Market conditions led to considerable price adjustments, with IOST experiencing notable downward pressure throughout the year
- Recent Period: The token underwent substantial fluctuations, reflecting broader market dynamics and evolving sentiment in the blockchain infrastructure sector
IOST Current Market Situation
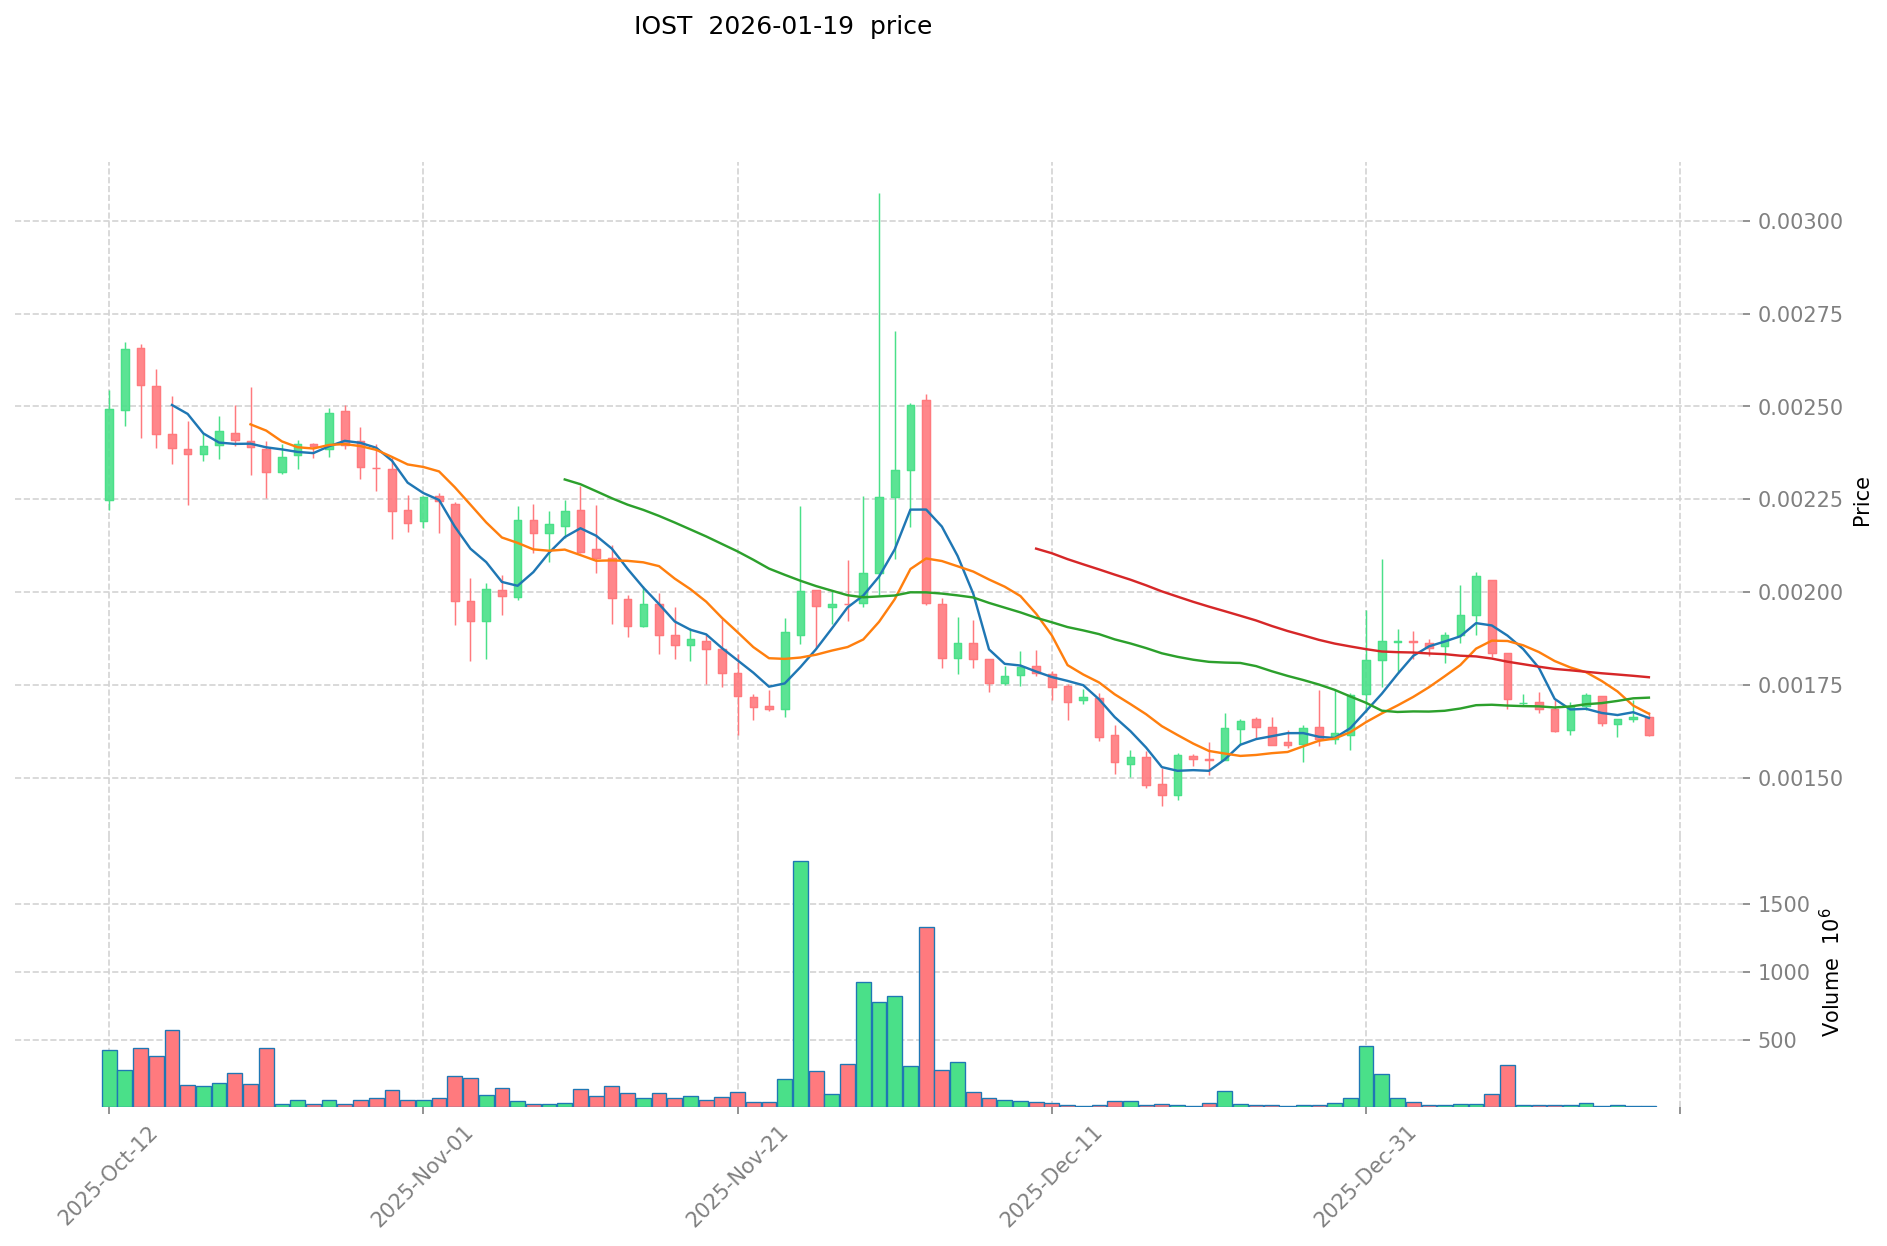
As of January 19, 2026, IOST is trading at $0.001582, representing a decline of 4% over the past 24 hours. The token's trading range for the day spans from $0.001481 to $0.001676, indicating moderate intraday volatility.
Over different timeframes, IOST has shown varied performance: a 0.51% increase in the past hour, a 5.89% decline over the past seven days, and a 2.33% gain over the past 30 days. However, the annual performance shows a significant decrease of 76.89%, reflecting challenges in maintaining upward momentum.
The project maintains a market capitalization of approximately $48.64 million, with a circulating supply of 30.75 billion tokens out of a maximum supply of 90 billion tokens. This represents a circulation ratio of 34.17%. IOST's 24-hour trading volume stands at $29,638.38, indicating ongoing market activity.
The token holds the 530th position in market capitalization rankings, with a market dominance of 0.0014%. The fully diluted market cap equals the current market capitalization at approximately $48.64 million.
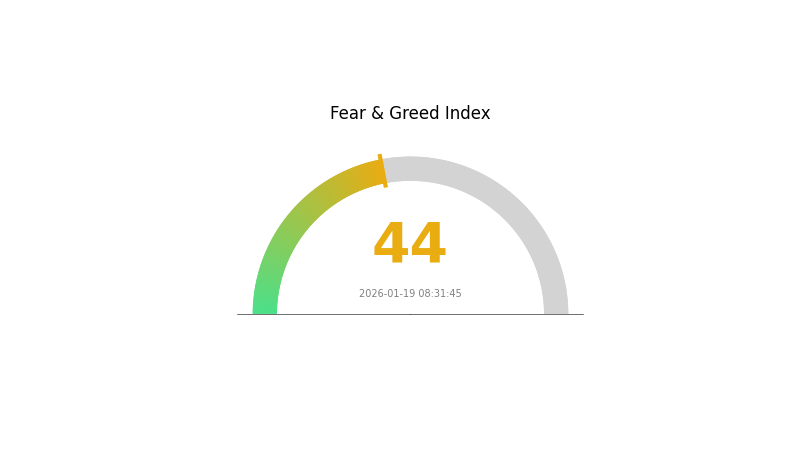
IOST is listed on 25 exchanges and has 38,477 token holders. The cryptocurrency market sentiment index currently registers at 44, indicating a "Fear" sentiment level among market participants.
The token's contract is deployed on the Ethereum blockchain, with the contract address available on Etherscan. IOST serves as the native token for a blockchain application platform designed for online service providers, utilizing a PoB consensus mechanism and layer-2 scaling solutions.
Click to view the current IOST market price
IOST Market Sentiment Indicator
2026-01-19 Fear and Greed Index: 44 (Fear)
Click to view the current Fear & Greed Index
The IOST market is currently experiencing a fear sentiment with an index reading of 44. This indicates heightened caution among investors, suggesting potential market volatility and risk-averse positioning. During fear-driven periods, opportunities may emerge for contrarian investors seeking favorable entry points. Monitor market developments closely and consider your risk tolerance before making investment decisions on Gate.com.
IOST Holding Distribution
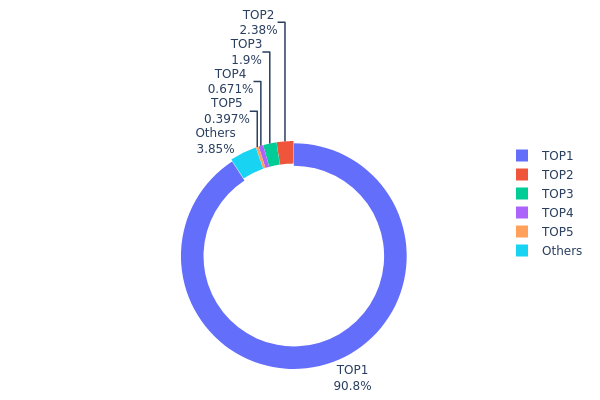
The holding distribution chart reveals the allocation of token supply across different wallet addresses, serving as a critical indicator of asset concentration and decentralization. According to the latest on-chain data, IOST exhibits an extremely high concentration pattern, with the top address holding 19,066,978.54K tokens, accounting for 90.79% of the total supply. The second-largest address holds 500,000.00K tokens (2.38%), while the third holds 400,010.00K tokens (1.90%). The top five addresses collectively control 95.13% of the circulating supply, leaving only 3.87% distributed among other participants.
This extreme concentration structure poses significant implications for market dynamics. The dominance of a single address holding over 90% of supply suggests potential centralized control mechanisms, which could be attributed to project reserves, foundation holdings, or ecosystem development funds. Such concentration significantly amplifies liquidity risk and price volatility, as large-scale movements from major holders could trigger substantial market fluctuations. Additionally, this distribution pattern creates an environment susceptible to price manipulation, where dominant addresses possess disproportionate influence over market sentiment and trading activity.
From a decentralization perspective, IOST's current holding structure deviates substantially from the distributed ownership model typically associated with blockchain networks. The minimal participation share of retail and institutional investors outside the top addresses indicates limited community distribution and potential barriers to broader adoption. This concentration metric serves as a cautionary signal for market participants, highlighting the need for enhanced transparency regarding the purpose and lock-up mechanisms of major holdings to ensure long-term network stability and trust.
Click to view current IOST Holding Distribution
| Top |
Address |
Holding Qty |
Holding (%) |
| 1 |
0x0000...000000 |
19066978.54K |
90.79% |
| 2 |
0xf977...41acec |
500000.00K |
2.38% |
| 3 |
0x5d3d...15ff03 |
400010.00K |
1.90% |
| 4 |
0xa023...fc947e |
140825.40K |
0.67% |
| 5 |
0x21a3...285549 |
83333.33K |
0.39% |
| - |
Others |
808852.72K |
3.87% |
II. Core Factors Influencing IOST's Future Price
Supply Mechanism
- Limited Token Supply: IOST has a fixed total token supply, which according to market economic principles means that increased demand could create upward price pressure. The limited issuance volume provides potential for price appreciation when network usage grows.
- Token Burn Mechanism: IOST has implemented four interconnected token burn mechanisms to maintain network health, economic balance, and introduce deflationary factors. After the IOST Layer 2 launch, gas fees will be denominated in IOST within six months, with a portion being burned to reduce circulating supply.
- Community-Centric Allocation: The new token economic model allocates 97% of ecosystem growth reserves to community development, node operations, and ecosystem expansion, with the remaining 3% for sustainable operations. This distribution mechanism demonstrates IOST's commitment to community-driven growth.
Institutional and Stakeholder Dynamics
- Institutional Support: IOST, established in 2017 and headquartered in Singapore, is backed by globally recognized investment institutions including Sequoia Capital, Matrix Partners, and ZhenFund.
- Strategic Financing: IOST completed a $21 million strategic financing round to accelerate RWA 3.0 development, strengthening its financial foundation for future expansion.
- Leadership Expansion: The IOST Foundation officially appointed Blake Jeong as Co-CEO to accelerate global compliance processes and ecosystem development, enhancing organizational capacity.
Macroeconomic Environment
- Web3 Payment Infrastructure Demand: The demand for efficient, low-cost payment infrastructure in the Web3 sector is experiencing explosive growth, with transaction volumes expected to increase by orders of magnitude in the future.
- Real-World Asset Tokenization: The RWA tokenization trend has emerged, indicating a massive market with potential value reaching hundreds of billions of dollars. This presents opportunities for IOST's positioning in institutional-grade financial infrastructure.
- Market Supply-Demand Dynamics: According to market economics theory, supply-demand relationships directly impact pricing. With IOST's limited supply and potential demand increases, favorable conditions exist for price appreciation.
Technical Development and Ecosystem Building
- IOST 3.0 Transformation: IOST is transforming into a BNB Chain Layer 2 solution focused on Real-World Assets, aiming to introduce institutional-grade financial infrastructure into Web3 and build a bridge connecting traditional finance with decentralized finance.
- Proven Technical Performance: IOST has successfully processed over 930 million transactions without any downtime, demonstrating robust technical capabilities and providing unique advantages in connecting traditional payment systems with Web3 innovation.
- Cross-Chain Compatibility Potential: If IOST achieves cross-chain compatibility with emerging chains such as Polkadot, this could contribute to price appreciation by expanding interoperability and use cases.
- PayFi and RWA Solutions: Through RWA tokenization, liquidity engines, and PayFi solutions, IOST 3.0 provides enterprise-grade on-chain payment and asset management services, enhancing asset liquidity, transparency, and transaction efficiency.
- Merchant Incentive Programs: The project provides financial support for integrating IOST into payment systems, encouraging expansion of practical application scenarios and driving ecosystem adoption.
- DePIN Development: The rise of Decentralized Physical Infrastructure Networks marks fundamental changes in financing, operation, and incentive mechanisms for real-world infrastructure, with IOST positioned to benefit from this emerging sector.
- Platform Adoption Growth: As more developers build applications on the IOST platform, increased adoption rates and network usage could positively influence token value.
III. 2026-2031 IOST Price Forecast
2026 Outlook
- Conservative Forecast: $0.00128 - $0.00158
- Neutral Forecast: $0.00158
- Optimistic Forecast: $0.00163 (requires sustained market momentum and increased trading volume)
2027-2029 Outlook
- Market Stage Expectation: Gradual recovery phase with progressive adoption and ecosystem development
- Price Range Forecast:
- 2027: $0.00107 - $0.00212
- 2028: $0.00123 - $0.0027
- 2029: $0.00123 - $0.00251
- Key Catalysts: Network upgrades, strategic partnerships, and broader blockchain adoption trends driving potential value appreciation
2030-2031 Long-term Outlook
- Baseline Scenario: $0.00184 - $0.00239 (assuming steady ecosystem growth and moderate market conditions)
- Optimistic Scenario: $0.0026 - $0.00356 (contingent upon significant protocol enhancements and expanded use cases)
- Transformative Scenario: Above $0.00356 (requiring exceptional market conditions, major institutional adoption, and breakthrough technological implementations)
- 2026-01-19: IOST trading within established range as market evaluates long-term potential
| Year |
Predicted High Price |
Predicted Average Price |
Predicted Low Price |
Price Change |
| 2026 |
0.00163 |
0.00158 |
0.00128 |
0 |
| 2027 |
0.00212 |
0.0016 |
0.00107 |
1 |
| 2028 |
0.0027 |
0.00186 |
0.00123 |
18 |
| 2029 |
0.00251 |
0.00228 |
0.00123 |
44 |
| 2030 |
0.0028 |
0.00239 |
0.00184 |
51 |
| 2031 |
0.00356 |
0.0026 |
0.00208 |
64 |
IV. IOST Professional Investment Strategy and Risk Management
IOST Investment Methodology
(1) Long-term Holding Strategy
- Suitable for: Value-oriented investors with long-term blockchain ecosystem outlook
- Operational Recommendations:
- Consider accumulating positions during periods of price consolidation
- Monitor the development progress of IOST's DApp ecosystem and technical upgrades
- Secure storage solution: Use Gate Web3 Wallet for convenient and secure asset management
(2) Active Trading Strategy
- Technical Analysis Tools:
- Moving Averages: Monitor 50-day and 200-day moving averages to identify potential trend reversals
- Volume Analysis: Observe trading volume patterns to confirm price movements and market sentiment
- Key Points for Swing Trading:
- Set clear entry and exit points based on support and resistance levels
- Implement stop-loss orders to limit potential downside exposure
IOST Risk Management Framework
(1) Asset Allocation Principles
- Conservative Investors: 1-3% of crypto portfolio
- Aggressive Investors: 5-10% of crypto portfolio
- Professional Investors: Up to 15% with active hedging strategies
(2) Risk Hedging Approaches
- Diversification: Combine IOST with other blockchain platform tokens to reduce concentration risk
- Position Sizing: Scale into positions gradually rather than allocating full capital at once
(3) Secure Storage Solutions
- Hot Wallet Option: Gate Web3 Wallet for convenient access and trading flexibility
- Cold Storage Approach: Hardware wallet solutions for larger holdings intended for long-term storage
- Security Precautions: Enable two-factor authentication, regularly update security settings, and never share private keys or seed phrases
V. IOST Potential Risks and Challenges
IOST Market Risks
- Price Volatility: IOST has experienced significant price fluctuations, with historical high of $0.129829 and recent trading around $0.001582
- Limited Liquidity: With a 24-hour trading volume of approximately $29,638, market depth may be insufficient for large transactions
- Market Share Decline: IOST holds only 0.0014% market dominance, indicating competitive challenges in the blockchain platform sector
IOST Regulatory Risks
- Jurisdictional Uncertainty: Evolving global cryptocurrency regulations may impact IOST's operational flexibility and market accessibility
- Compliance Requirements: Potential regulatory changes could require modifications to IOST's network or token structure
- Exchange Listing Risk: Regulatory pressures may affect IOST's availability on certain trading platforms
IOST Technical Risks
- Competition Pressure: Faces intense competition from established platforms like Ethereum and emerging Layer 2 solutions
- Development Execution: Success depends on the team's ability to deliver promised technical upgrades and ecosystem expansion
- Network Security: Like all blockchain platforms, IOST faces ongoing challenges related to smart contract vulnerabilities and potential network attacks
VI. Conclusion and Action Recommendations
IOST Investment Value Assessment
IOST presents a mixed investment profile with both opportunities and challenges. As a blockchain platform supported by notable investment institutions and featuring innovations like the PoB consensus mechanism, IOST offers potential for ecosystem growth. However, the significant decline from its all-time high, limited market share, and intense competition from other platforms present considerable risks. The project's value proposition centers on its scalability and decentralization features, but long-term success depends heavily on ecosystem development and market adoption.
IOST Investment Recommendations
✅ Beginners: Consider small exploratory positions only after thoroughly understanding blockchain technology and accepting the possibility of substantial losses
✅ Experienced Investors: May allocate a minor portion of crypto portfolio with clear risk parameters and regular monitoring of ecosystem developments
✅ Institutional Investors: Conduct comprehensive due diligence on IOST's technical roadmap, team execution capabilities, and competitive positioning before considering allocation
IOST Trading Participation Methods
- Spot Trading: Purchase IOST directly through cryptocurrency exchanges like Gate.com for straightforward exposure
- Dollar-Cost Averaging: Implement systematic periodic purchases to smooth out price volatility over time
- Portfolio Rebalancing: Periodically adjust IOST allocation based on performance relative to overall portfolio goals
Cryptocurrency investment carries extreme risks, and this article does not constitute investment advice. Investors should make prudent decisions based on their own risk tolerance and are advised to consult professional financial advisors. Never invest more than you can afford to lose.
FAQ
What is the IOST token price prediction for 2024-2025?
Analysts predict IOST will experience moderate growth in 2025, with prices expected to fluctuate between $0.02 and $0.03. Some forecasts suggest it could reach $0.024-$0.025 by end of 2025.
What are the main factors affecting IOST price?
IOST price is influenced by market sentiment, blockchain technology development, trading volume, competition from other platforms, regulatory changes, team announcements, and DApp ecosystem growth.
What are IOST's technical advantages and development prospects?
IOST leverages Proof of Believability (PoB) consensus algorithm, enabling high transaction throughput and efficiency. With strong infrastructure for decentralized applications, IOST shows promising growth potential in the Web3 ecosystem.
Is IOST suitable for long-term holding? What are the investment risks?
IOST shows strong technical foundation and ecosystem development potential for long-term holding. However, market volatility, regulatory uncertainty, and competitive pressures present inherent risks. Investors should research thoroughly before committing.
How does IOST differ from other public chains like SOL and NEAR?
IOST focuses on enterprise-grade applications with efficient consensus mechanisms and low transaction fees, while SOL and NEAR emphasize high performance and broad dApp ecosystems. IOST aims to deliver more stable and cost-effective enterprise solutions.
* The information is not intended to be and does not constitute financial advice or any other recommendation of any sort offered or endorsed by Gate.