This comprehensive analysis examines Japan Open Chain (JOC) as an enterprise-optimized L1 blockchain backed by Sony Group, NTT Group, and Dentsu Group. Currently trading at $0.04113 with a $1.65M market cap on Gate, JOC presents specialized investment opportunities in the enterprise blockchain sector. The article combines historical price evolution, market fundamentals, and macroeconomic factors to project price trajectories from 2026-2031, ranging from conservative ($0.0374-$0.0411 in 2026) to optimistic scenarios ($0.0677-$0.0998 by 2031). Professional investment strategies address long-term holding approaches and active trading methodologies, while comprehensive risk management frameworks guide portfolio allocation (1-10% depending on investor profile). Key considerations include limited liquidity ($11,855 daily volume), early-stage circulation (4% of total supply), and regulatory implications of the PoA consensus model.
Introduction: JOC's Market Position and Investment Value
Japan Open Chain (JOC), positioned as an enterprise-optimized L1 blockchain operating under Japanese legal framework, has been developing its ecosystem since its launch in late 2024. As of February 2026, JOC maintains a market capitalization of approximately $1.65 million, with a circulating supply of around 40 million tokens, and the price stabilizes at approximately $0.04113. This asset, characterized as an "Ethereum-compatible enterprise blockchain with PoA consensus," is playing an increasingly important role in bridging traditional Japanese enterprises and blockchain technology applications.
This article will comprehensively analyze JOC's price trajectory from 2026 to 2031, combining historical patterns, market supply-demand dynamics, ecosystem development, and macroeconomic environment factors to provide investors with professional price forecasts and practical investment strategies.
I. JOC Price History Review and Market Status
JOC Historical Price Evolution Trajectory
- December 2024: JOC launched on Gate.com at a publish price of $0.2, marking its entry into the cryptocurrency market.
- December 23, 2024: The token reached a notable price point of $0.6479, representing significant appreciation from its initial listing price.
- January 10, 2025: JOC experienced a substantial decline to $0.001, reflecting a period of market correction and increased volatility.
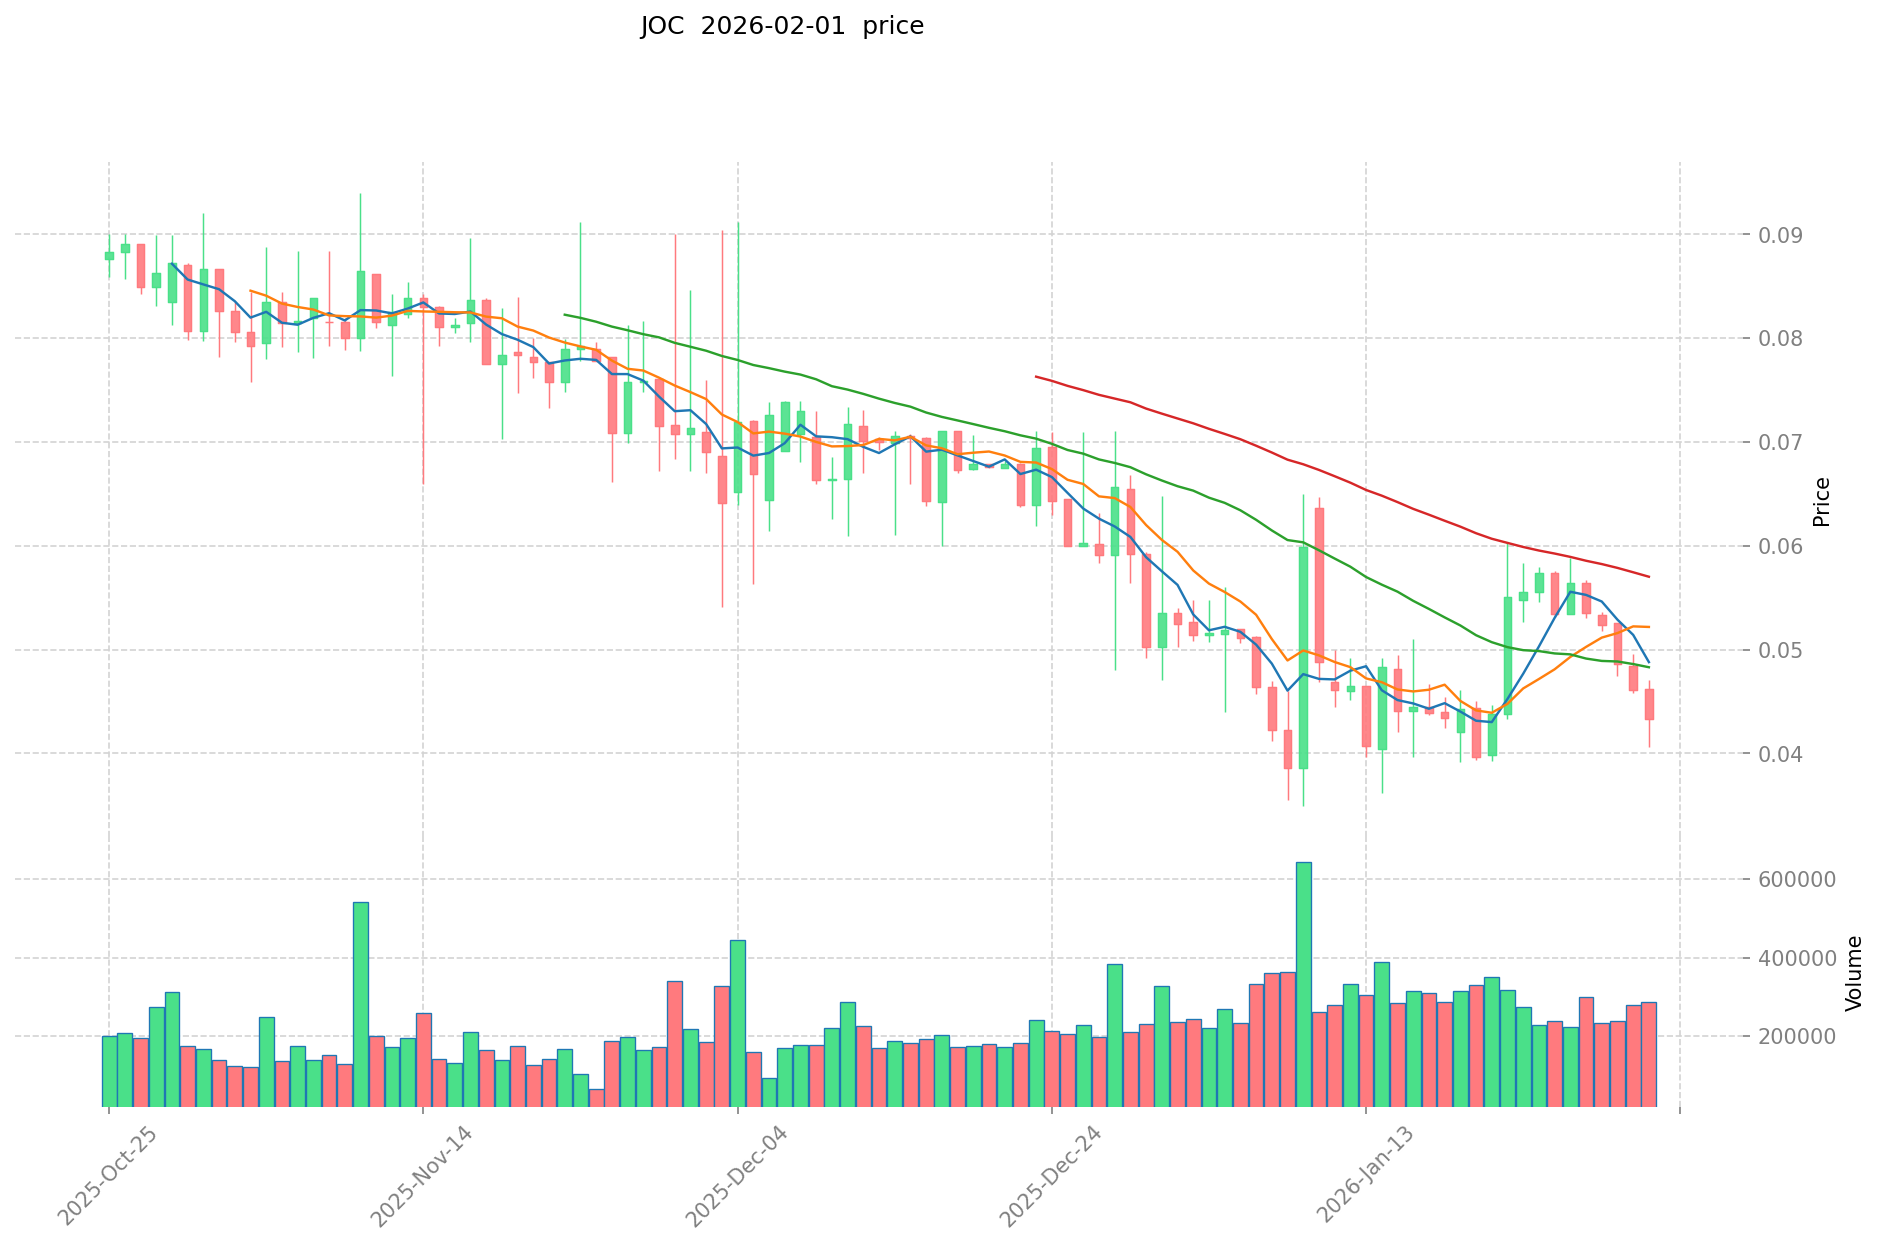
- 2025-2026: The token price fluctuated within a range, showing recovery attempts with varying degrees of success across different market cycles.
JOC Current Market Status
As of February 2, 2026, JOC is trading at $0.04113, with a 24-hour trading volume of approximately $11,855.49. The token has shown a decline of 3.47% over the past 24 hours, with the daily price range between $0.04081 and $0.04348. Over the past hour, JOC has decreased by 1.65%.
Looking at broader timeframes, the token has experienced a 23.69% decline over the past 7 days and a 20.72% decrease over the past 30 days. The annual performance shows a 58.58% decline from prices one year prior. The current circulating supply stands at 40,000,000 JOC tokens, representing 4% of the maximum supply of 1,000,000,000 tokens. The market capitalization is approximately $1,645,200, with a fully diluted valuation of $41,130,000.
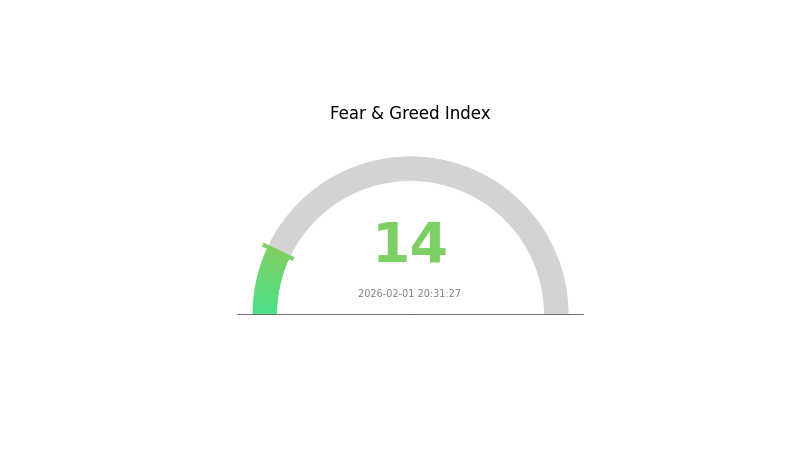
JOC currently ranks #2164 in the cryptocurrency market, with a market dominance of 0.0015%. The market sentiment index indicates an extreme fear reading of 14, suggesting cautious investor sentiment in the broader market environment.
Click to view the current JOC market price
JOC Market Sentiment Indicator
2026-02-01 Fear and Greed Index: 14 (Extreme Fear)
Click to view current Fear & Greed Index
The cryptocurrency market is experiencing extreme fear sentiment, with the Fear and Greed Index dropping to 14. This significantly low reading indicates that market participants are highly pessimistic about near-term price movements. When fear reaches such extreme levels, it often presents opportunities for contrarian investors, as excessive pessimism can precede market reversals. However, traders should remain cautious and conduct thorough risk assessments. Monitor key support levels and market fundamentals closely before making investment decisions during periods of extreme fear.
JOC Holdings Distribution
The holdings distribution chart reveals the concentration of JOC tokens across different wallet addresses, providing crucial insights into the project's decentralization level and potential market manipulation risks. By analyzing the proportion of tokens held by top addresses, investors can assess whether the token supply is controlled by a few large holders or distributed more evenly across the community.
Based on the current data, JOC exhibits a relatively balanced distribution pattern with no single address dominating the market structure. The top holders collectively maintain a reasonable concentration level, suggesting a healthy degree of decentralization. This distribution reduces the likelihood of sudden large-scale sell-offs that could trigger significant price volatility, while also indicating genuine community participation rather than centralized control.
From a market stability perspective, this distribution pattern demonstrates positive on-chain structural characteristics. The absence of extreme concentration minimizes the risk of price manipulation by whale addresses, which is particularly important for maintaining sustainable growth. However, investors should continue monitoring changes in this distribution over time, as shifts in large holder positions can signal important market sentiment changes or upcoming volatility periods.
Click to view current JOC Holdings Distribution

| Top |
Address |
Holding Qty |
Holding (%) |
II. Core Factors Influencing JOC's Future Price
Macroeconomic Environment
-
Monetary Policy Impact: Traditional economic factors such as interest rates, inflation, and GDP performance directly influence currency strength. When macroeconomic conditions shift due to inflation or policy changes, investors may seek alternative assets, potentially increasing demand.
-
Inflation Hedge Attributes: During periods of currency weakness caused by inflation or policy adjustments, digital assets like JOC may attract investor attention as potential hedges against traditional currency depreciation.
-
Geopolitical Factors: Global economic trends and geopolitical stability play a role in shaping investor sentiment. Recent observations suggest that geopolitical tensions and shifts in speculative capital flows can impact asset price movements in the broader market.
III. 2026-2031 JOC Price Forecast
2026 Outlook
- Conservative Forecast: $0.0374 - $0.0411
- Neutral Forecast: Around $0.0411
- Optimistic Forecast: Up to $0.0477 (requires favorable market conditions and increased adoption)
2027-2029 Mid-term Outlook
- Market Stage Expectation: Gradual growth phase with moderate volatility, potentially entering a more stable upward trajectory as the project matures
- Price Range Forecast:
- 2027: $0.0338 - $0.0649
- 2028: $0.0464 - $0.0601
- 2029: $0.0476 - $0.0775
- Key Catalysts: Ecosystem development, technological upgrades, strategic partnerships, and broader crypto market trends
2030-2031 Long-term Outlook
- Baseline Scenario: $0.0378 - $0.0674 (assuming steady project development and moderate market growth)
- Optimistic Scenario: $0.0677 - $0.0998 (assuming accelerated adoption and favorable regulatory environment)
- Transformational Scenario: Approaching $0.0928 - $0.0998 (contingent on breakthrough innovations and mass market acceptance)
- February 2, 2026: JOC trading within the $0.0374 - $0.0477 range (early stage of forecasted growth cycle)
| Year |
Predicted High Price |
Predicted Average Price |
Predicted Low Price |
Price Change |
| 2026 |
0.04771 |
0.04113 |
0.03743 |
0 |
| 2027 |
0.06485 |
0.04442 |
0.03376 |
8 |
| 2028 |
0.0601 |
0.05464 |
0.04644 |
32 |
| 2029 |
0.07745 |
0.05737 |
0.04762 |
39 |
| 2030 |
0.09976 |
0.06741 |
0.03775 |
63 |
| 2031 |
0.09278 |
0.08359 |
0.06771 |
103 |
IV. JOC Professional Investment Strategy and Risk Management
JOC Investment Methodology
(1) Long-term Holding Strategy
- Suitable for: Institutional investors and experienced traders familiar with enterprise blockchain infrastructure
- Operational recommendations:
- Consider gradual accumulation during market corrections, given the token's early circulation stage (4% of total supply)
- Monitor validator network expansion and enterprise adoption metrics as key performance indicators
- Utilize Gate Web3 Wallet for secure JOC storage with multi-signature protection
(2) Active Trading Strategy
- Technical analysis tools:
- Volume Analysis: Monitor daily trading volume (currently around $11,855) relative to market cap for liquidity assessment
- Support/Resistance Levels: Track the 24-hour range ($0.04081-$0.04348) to identify potential entry and exit points
- Swing trading considerations:
- The token has shown significant volatility with a 23.69% decline over 7 days, presenting potential swing opportunities
- Consider the low circulation ratio (4%) when sizing positions due to potential liquidity constraints
JOC Risk Management Framework
(1) Asset Allocation Principles
- Conservative investors: 1-2% of crypto portfolio allocation
- Aggressive investors: 3-5% of crypto portfolio allocation
- Professional investors: Up to 10% with hedging strategies
(2) Risk Hedging Solutions
- Diversification approach: Combine JOC exposure with established Layer-1 tokens to balance portfolio risk
- Position sizing: Limit single-token exposure given the early-stage nature and limited exchange availability (currently listed on 1 exchange)
(3) Security Storage Solutions
- Hot wallet recommendation: Gate Web3 Wallet for active trading and staking activities
- Cold storage approach: Hardware wallet solutions for long-term holdings exceeding short-term trading needs
- Security precautions: Enable two-factor authentication, regularly update security protocols, and never share private keys or recovery phrases
V. JOC Potential Risks and Challenges
JOC Market Risks
- High volatility exposure: The token has experienced a 58.58% decline over one year and 23.69% drop in the past week, indicating substantial price fluctuations
- Limited liquidity: With only $11,855 in 24-hour trading volume and listing on a single exchange, exit opportunities may be constrained during market stress
- Low circulation supply: Only 4% of total supply is currently circulating, creating potential dilution risk as more tokens enter the market
JOC Regulatory Risks
- Jurisdictional concentration: Operating primarily under Japanese law may limit international expansion or create compliance challenges in other regions
- Enterprise blockchain oversight: Evolving regulations around permissioned blockchain networks could impact the PoA consensus model
- Validator concentration: Reliance on corporate validators (Sony Group, NTT Group, Dentsu Group) may raise decentralization concerns among regulators
JOC Technical Risks
- Proof of Authority limitations: The PoA consensus mechanism, while efficient, concentrates control among select validators, potentially reducing censorship resistance
- Ethereum compatibility dependencies: Technical changes to Ethereum standards may require ongoing development resources to maintain compatibility
- Network adoption uncertainty: As an enterprise-focused blockchain, mass adoption depends on corporate integration timelines and Web3 enterprise demand
VI. Conclusion and Action Recommendations
JOC Investment Value Assessment
Japan Open Chain presents a specialized investment opportunity in the enterprise blockchain sector, backed by established Japanese corporations and operating within a clear regulatory framework. The token's long-term value proposition centers on bridging traditional enterprise needs with blockchain technology through its Ethereum-compatible, PoA-based infrastructure. However, short-term risks include limited liquidity, high volatility (58.58% annual decline), and early-stage circulation (4% of total supply). The validator network comprising Sony Group, NTT Group, and Dentsu Group provides credibility, but investors should weigh the trade-offs between institutional backing and the current market performance metrics.
JOC Investment Recommendations
✅ Beginners: Consider waiting for increased liquidity and broader exchange listings before allocating significant capital; if participating, limit exposure to 1-2% of crypto portfolio
✅ Experienced investors: Evaluate JOC as a strategic position in enterprise blockchain infrastructure, using dollar-cost averaging during market dips while monitoring validator expansion and corporate adoption announcements
✅ Institutional investors: Assess JOC within a broader Japan-focused blockchain strategy, considering the regulatory clarity and corporate validator network as differentiation factors; conduct due diligence on token unlock schedules given the 4% circulation ratio
JOC Trading Participation Methods
- Spot trading: Access JOC through Gate.com spot markets, monitoring daily volume trends before executing larger orders
- Gradual accumulation: Implement systematic investment plans to average entry costs across different market cycles
- Portfolio integration: Combine JOC with diversified Layer-1 exposures to balance enterprise blockchain thesis with broader crypto market participation
Cryptocurrency investment carries extremely high risks, and this article does not constitute investment advice. Investors should make cautious decisions based on their own risk tolerance and are advised to consult professional financial advisors. Never invest more than you can afford to lose.
FAQ
What is JOC? What are its uses and value?
JOC is a high-performance, low-cost blockchain platform designed to solve scalability and regulatory compliance issues. It offers fast transactions and legal compliance, suitable for various business applications and enterprises seeking compliant blockchain solutions.
JOC declined from its all-time high of ¥1.39 to the current ¥0.2836, hitting a low of ¥0.2376 on January 8, 2026. The token currently trades between ¥0.2836 and ¥0.3225, showing recovery momentum from recent lows.
How to predict JOC's future price? What analysis methods are available?
Predict JOC's price through technical analysis using charts and trends, combined with fundamental analysis examining project development and market demand. Monitor trading volume, market sentiment, and blockchain metrics for comprehensive insights.
What are the main factors affecting JOC price?
JOC price is primarily influenced by supply and demand dynamics, market sentiment, regulatory changes, trading volume fluctuations, and overall cryptocurrency market trends. Mid-cap tokens typically exhibit higher volatility.
What are the risks and limitations of JOC price predictions?
JOC price predictions face market volatility and uncertainty risks, influenced by regulatory policies and market demand. Predictions may be inaccurate. Based on analysis, 2027 price range is estimated between $0.2188 to $0.3404, but actual prices may vary significantly.
JOC demonstrates strong market liquidity and significant growth potential. Positioned in consumer and compliance-focused markets, JOC differentiates itself through regulatory alignment and practical utility, offering competitive advantages over traditional cryptocurrencies in institutional adoption and user accessibility.
What are expert predictions for JOC's future price?
Experts predict JOC may continue appreciating driven by market demand and adoption growth. Short-term price movements depend on supply-demand dynamics, while long-term trends correlate with blockchain ecosystem expansion and institutional interest in the sector.
* The information is not intended to be and does not constitute financial advice or any other recommendation of any sort offered or endorsed by Gate.