This comprehensive analysis examines JOE, the governance token for Trader Joe's decentralized exchange on Avalanche, currently trading at $0.05919 with a market capitalization of $23.89 million. The article provides detailed price projections spanning 2026-2031, with conservative to optimistic scenarios ranging from $0.03831 to $0.12737, suggesting potential 65% growth by 2031. It analyzes JOE's historical performance, including its 2021 peak of $5.09 and recent 82.62% annual decline, while assessing current market sentiment showing extreme fear conditions. The guide presents actionable investment strategies for beginners through institutional investors, including long-term holding approaches and active trading techniques via Gate.com. Additionally, it addresses critical risk factors including price volatility, regulatory uncertainties, and smart contract vulnerabilities, alongside comprehensive risk management frameworks and security recommendations for token holders.
Introduction: JOE's Market Position and Investment Value
JOE, the governance token of Trader Joe, serves as a core asset in the decentralized finance ecosystem on the Avalanche network. Since its launch in 2021, JOE has established itself as a one-stop decentralized trading platform, integrating DEX services with DeFi lending to provide users with comprehensive trading functionalities. As of January 2026, JOE maintains a market capitalization of approximately $23.89 million, with a circulating supply of around 403.57 million tokens, trading at approximately $0.05919. This asset, recognized for its role in decentralized exchange and liquidity provision, continues to serve an important function within the Avalanche ecosystem.
This article will comprehensively analyze JOE's price trajectory from 2026 to 2031, examining historical patterns, market supply and demand dynamics, ecosystem developments, and macroeconomic factors to provide investors with professional price forecasts and practical investment strategies.
I. JOE Price History Review and Market Status
JOE Historical Price Evolution Trajectory
- 2021: JOE reached its all-time high of $5.09 on November 21, experiencing significant growth during the initial market expansion phase
- 2021: Shortly after launch, the token hit its all-time low of $0.02658814 on August 11, representing the early price discovery period
- 2025-2026: During the recent market cycle, JOE experienced substantial price correction, declining by 82.62% over the past year
JOE Current Market Status
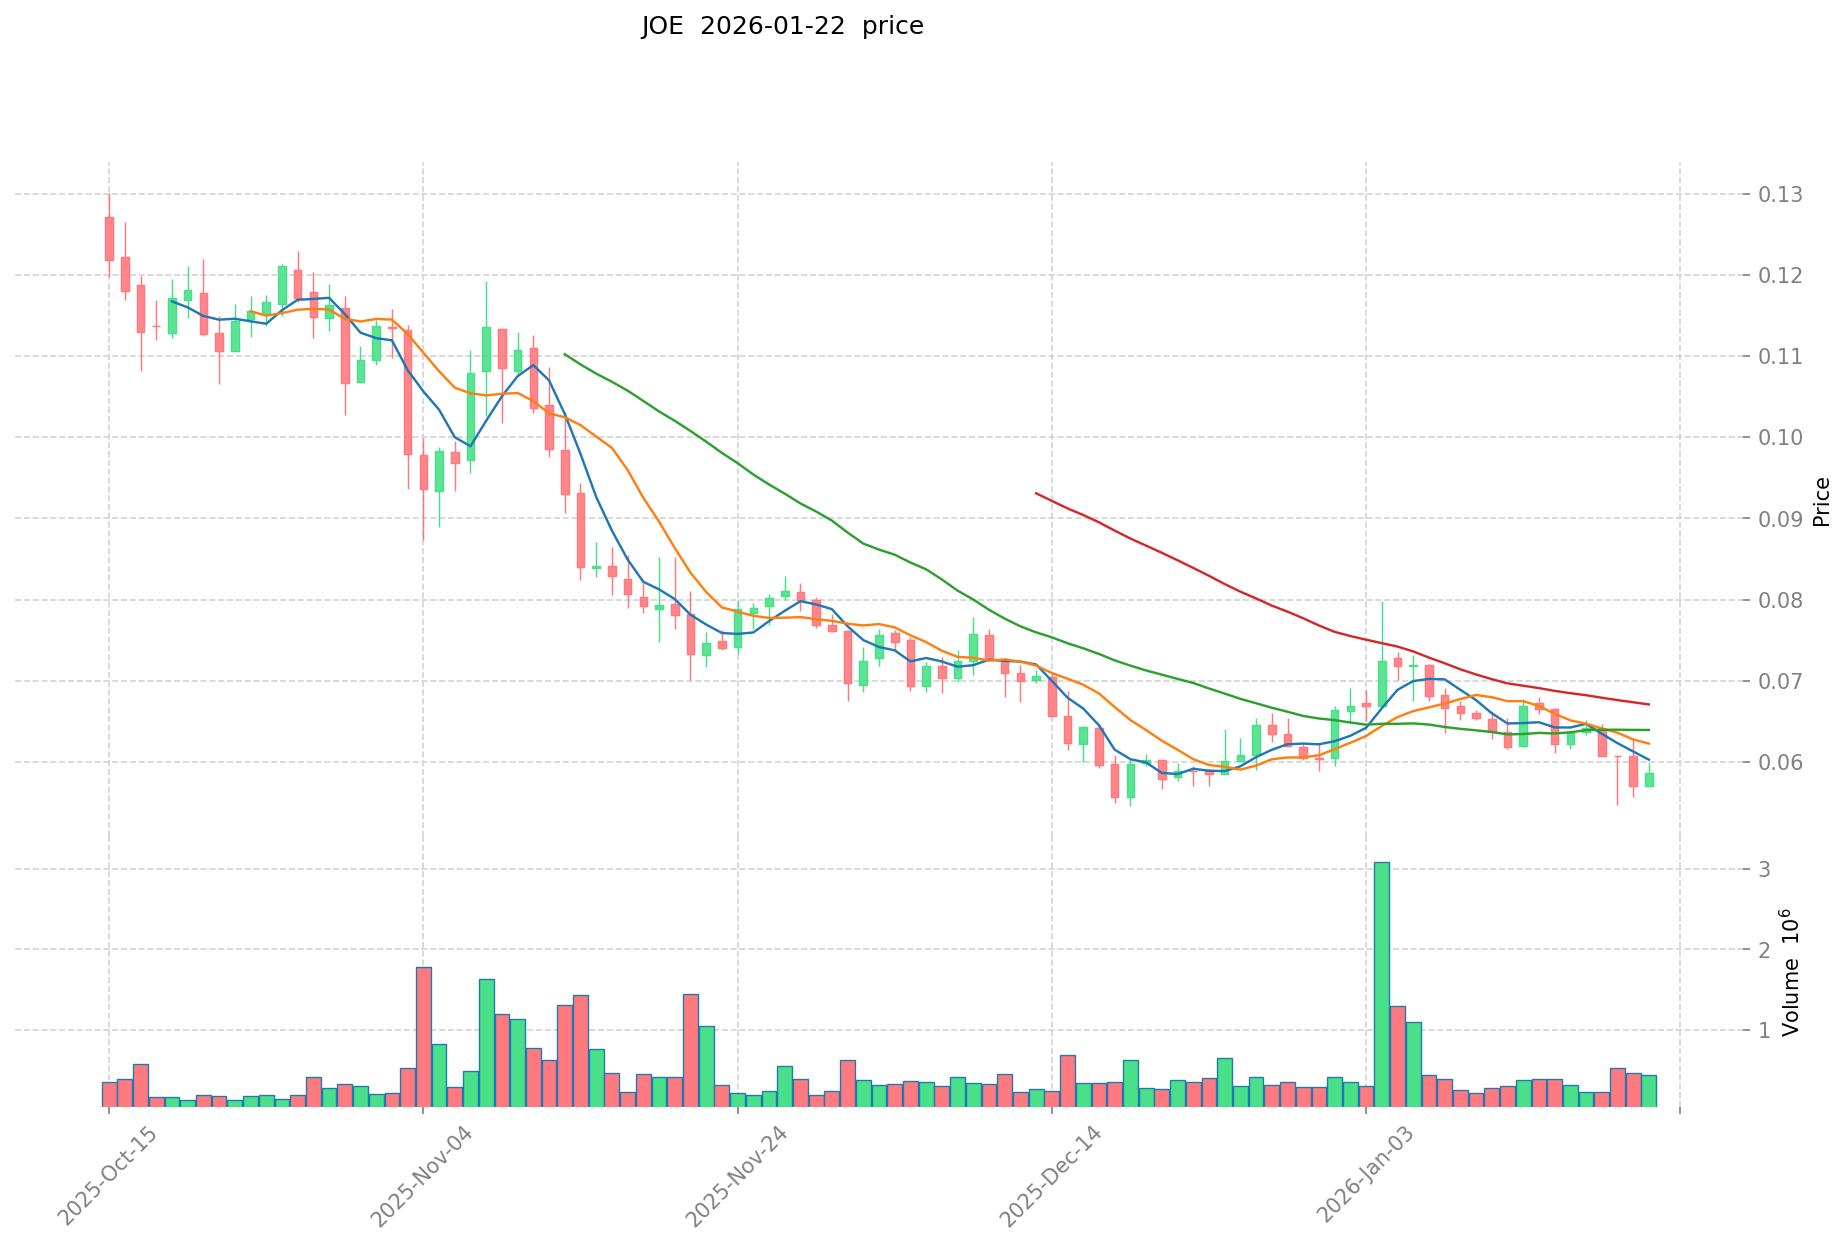
As of January 22, 2026, JOE is trading at $0.05919, showing a modest 24-hour increase of 0.37%. The token demonstrated intraday volatility with a high of $0.05987 and a low of $0.0571. Short-term momentum appears negative, with the 1-hour change at -0.59% and a more pronounced 7-day decline of 8.81%.
The project maintains a circulating supply of 403.57 million tokens out of a maximum supply of 500 million, representing an 80.71% circulation ratio. The current market capitalization stands at approximately $23.89 million, with a fully diluted valuation of $29.58 million. The market cap to FDV ratio of 80.71% indicates relatively high token circulation.
Trader Joe operates as a one-stop decentralized trading platform on the Avalanche network, with JOE serving as its governance token. The token provides holders with a share of exchange revenue, establishing a value accrual mechanism within the ecosystem. The platform has attracted a community of 149,960 holders and maintains trading presence across 23 exchanges, with active trading on Gate.com.
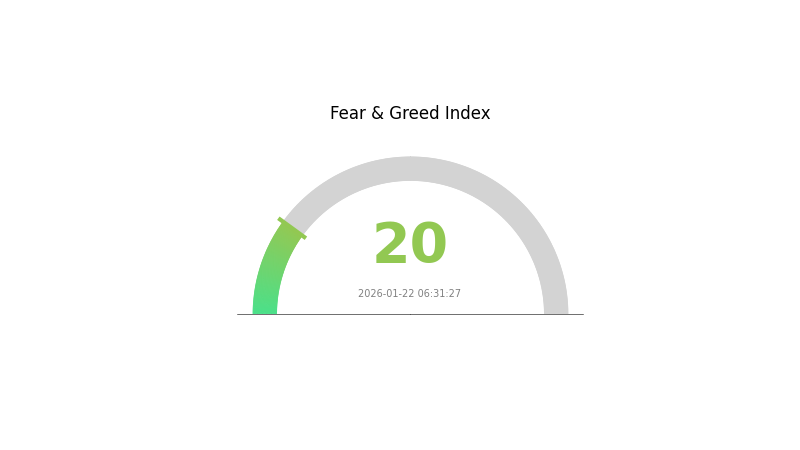
The 24-hour trading volume reached $24,290.74, reflecting moderate market activity. Market dominance remains minimal at 0.00092%, positioning JOE within the broader DeFi ecosystem landscape. Current market sentiment indicators show a VIX score of 20, suggesting an environment of extreme fear in the broader cryptocurrency market.
Click to view current JOE market price
JOE Market Sentiment Indicator
2026-01-22 Fear and Greed Index: 20 (Extreme Fear)
Click to view current Fear & Greed Index
Today's market sentiment shows an extreme fear level at 20 points, indicating significantly heightened market anxiety. This extreme fear period typically presents contrasting opportunities for investors. Risk-averse traders may adopt defensive strategies, while seasoned investors often view such market conditions as potential entry points for long-term positions. Monitor market developments closely and maintain a balanced investment approach aligned with your risk tolerance.
JOE Holding Distribution
The holding distribution chart illustrates how JOE tokens are allocated across different wallet addresses, providing critical insights into token concentration and decentralization levels. This metric helps assess whether token ownership is distributed broadly among many holders or concentrated in a few large addresses, which directly impacts market stability and manipulation risk.
According to the current on-chain data, JOE exhibits significant concentration characteristics. The top holder controls approximately 204.74 million tokens, accounting for 40.96% of total supply, while the top five addresses collectively hold 343.70 million tokens, representing 68.74% of circulating supply. This substantial concentration in major addresses indicates a centralized ownership structure, where a small number of entities possess controlling stakes in the token ecosystem.
This concentrated distribution pattern presents several implications for market dynamics. The dominance of large holders creates heightened volatility risk, as significant sell pressure from any top addresses could trigger sharp price movements. Additionally, the concentration level raises concerns about potential market manipulation, where coordinated actions by major holders could disproportionately influence price discovery. The "Others" category, comprising only 31.26% of holdings distributed among numerous smaller addresses, suggests limited retail participation and a market structure vulnerable to whale movements. From a decentralization perspective, this distribution indicates that JOE's on-chain governance and price stability remain susceptible to decisions made by a concentrated group of large stakeholders.
Click to view current JOE Holding Distribution
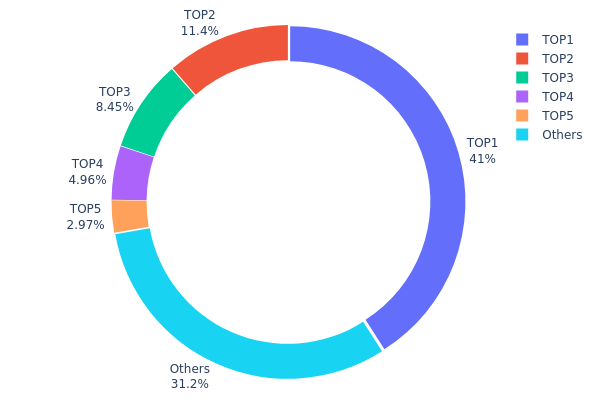
| Top |
Address |
Holding Qty |
Holding (%) |
| 1 |
0x1a73...43cb51 |
204741.08K |
40.96% |
| 2 |
0xd858...2410ee |
57074.78K |
11.41% |
| 3 |
0x4aef...a013e8 |
42248.36K |
8.45% |
| 4 |
0x8f38...dd032d |
24779.25K |
4.95% |
| 5 |
0x5a52...70efcb |
14852.03K |
2.97% |
| - |
Others |
156097.24K |
31.26% |
II. Core Factors Influencing JOE's Future Price
Based on the current available information, there is insufficient data to provide a comprehensive analysis of the core factors that may influence JOE's future price trajectory. The analysis requires detailed information about supply mechanisms, institutional holdings, macroeconomic conditions, and technical developments that are not present in the provided materials.
A thorough evaluation of JOE's price drivers would typically include supply-side dynamics, institutional adoption patterns, broader market conditions, and ecosystem development metrics. However, without access to specific data points in these areas, it would not be appropriate to make speculative assessments.
Investors and traders interested in JOE should conduct their own research using reliable sources and consider consulting with financial advisors before making investment decisions.
III. 2026-2031 JOE Price Prediction
2026 Outlook
- Conservative Prediction: $0.03831 - $0.05894
- Neutral Prediction: Around $0.05894
- Optimistic Prediction: Up to $0.06189 (requires favorable market conditions and increased adoption)
2027-2029 Outlook
- Market Stage Expectation: The token may enter a gradual growth phase, with increasing market recognition and ecosystem development potentially driving moderate appreciation.
- Price Range Predictions:
- 2027: $0.05196 - $0.08095
- 2028: $0.06149 - $0.08553
- 2029: $0.0617 - $0.09607
- Key Catalysts: Platform upgrades, expanding user base, broader DeFi integration, and overall crypto market sentiment could serve as primary drivers for price movement during this period.
2030-2031 Long-term Outlook
- Baseline Scenario: $0.08186 - $0.10886 by 2030 (assuming steady ecosystem growth and stable market conditions)
- Optimistic Scenario: $0.0578 - $0.12737 by 2031 (contingent on significant protocol enhancements and widespread adoption)
- Transformative Scenario: Potential to reach the upper range of $0.12737 (requires exceptional market conditions, major partnerships, and substantial platform innovation)
- 2026-01-22: JOE price predictions suggest potential growth of up to 65% by 2031 compared to 2026 baseline levels (based on current analytical models)
| Year |
Predicted High Price |
Predicted Average Price |
Predicted Low Price |
Price Change |
| 2026 |
0.06189 |
0.05894 |
0.03831 |
0 |
| 2027 |
0.08095 |
0.06041 |
0.05196 |
2 |
| 2028 |
0.08553 |
0.07068 |
0.06149 |
19 |
| 2029 |
0.09607 |
0.07811 |
0.0617 |
31 |
| 2030 |
0.10886 |
0.08709 |
0.08186 |
47 |
| 2031 |
0.12737 |
0.09797 |
0.0578 |
65 |
IV. JOE Professional Investment Strategy and Risk Management
JOE Investment Methodology
(1) Long-term Holding Strategy
- Target Investors: Investors who believe in the long-term development of decentralized exchange platforms and the Avalanche ecosystem
- Operational Recommendations:
- Consider accumulating JOE tokens during market corrections when prices fall below key support levels
- Monitor the development progress of Trader Joe platform and its trading volume growth on Avalanche network
- Store assets in secure wallets such as Gate Web3 Wallet for long-term custody
(2) Active Trading Strategy
- Technical Analysis Tools:
- Moving Averages: Use 50-day and 200-day moving averages to identify trend directions and potential entry points
- Volume Analysis: Monitor 24-hour trading volume changes to confirm price movement validity
- Swing Trading Key Points:
- Pay attention to the price range between $0.0571 (recent 24h low) and $0.0599 (recent 24h high) for short-term trading opportunities
- Set stop-loss orders to limit potential losses, especially given the token's high volatility
JOE Risk Management Framework
(1) Asset Allocation Principles
- Conservative Investors: 1-3% of crypto portfolio
- Aggressive Investors: 5-10% of crypto portfolio
- Professional Investors: May allocate up to 15% based on thorough research and market conditions
(2) Risk Hedging Solutions
- Portfolio Diversification: Combine JOE with other layer-1 tokens and stablecoins to reduce concentration risk
- Position Scaling: Use dollar-cost averaging to gradually build positions rather than investing lump sums
(3) Security Storage Solutions
- Hot Wallet Recommendation: Gate Web3 Wallet for convenient trading and staking access
- Cold Storage Solution: Hardware wallets for long-term holdings exceeding personal risk tolerance
- Security Precautions: Never share private keys, enable two-factor authentication, and verify contract addresses before transactions
V. JOE Potential Risks and Challenges
JOE Market Risks
- Price Volatility: JOE has experienced significant price fluctuations, with a 1-year decline of 82.62%, indicating high market volatility
- Limited Market Share: With a market dominance of only 0.00092%, JOE faces intense competition from larger DEX platforms
- Trading Volume Concentration: The relatively modest 24-hour trading volume of approximately $24,291 may result in liquidity challenges during market stress
JOE Regulatory Risks
- DeFi Regulatory Uncertainty: Evolving global regulations on decentralized exchanges may impact Trader Joe's operations
- Governance Token Classification: Potential regulatory scrutiny regarding the classification of JOE as a governance token
- Cross-border Compliance: Operating on a global scale may expose the platform to varying regulatory requirements across jurisdictions
JOE Technical Risks
- Smart Contract Vulnerabilities: DeFi platforms face inherent risks of smart contract exploits or bugs
- Network Dependency: JOE's performance is closely tied to the Avalanche network's stability and development
- Competition Risk: Rapid innovation in the DeFi space may render current features obsolete if the platform fails to evolve
VI. Conclusion and Action Recommendations
JOE Investment Value Assessment
JOE represents a governance token for Trader Joe, a decentralized exchange platform on the Avalanche network. While the platform offers one-stop DeFi services combining DEX and lending functionalities, the token has experienced substantial price depreciation over the past year. The current market capitalization stands at approximately $23.89 million with 80.71% of total supply in circulation. Short-term performance shows modest 24-hour gains of 0.37%, but faces pressure from a 7-day decline of 8.81%. Long-term value depends on the platform's ability to grow trading volume, expand its user base beyond the current 149,960 holders, and compete effectively in the increasingly crowded DEX landscape.
JOE Investment Recommendations
✅ Beginners: Start with minimal allocation (1-2% of crypto portfolio) and focus on understanding DeFi mechanics before increasing exposure. Use reputable platforms like Gate.com for initial purchases.
✅ Experienced Investors: Consider JOE as a speculative position within a diversified DeFi portfolio, monitoring Avalanche ecosystem developments and Trader Joe's competitive positioning. Implement strict risk management with predetermined exit strategies.
✅ Institutional Investors: Conduct comprehensive due diligence on Trader Joe's protocol security, treasury management, and competitive advantages. Consider position sizing based on thorough fundamental and technical analysis while accounting for liquidity constraints.
JOE Trading Participation Methods
- Spot Trading: Purchase JOE directly on Gate.com or other exchanges supporting the token, suitable for long-term holding strategies
- Liquidity Provision: Participate in Trader Joe's liquidity pools to earn trading fees, though this involves impermanent loss risks
- Governance Participation: Stake JOE tokens to participate in platform governance decisions and potentially earn protocol revenue shares
Cryptocurrency investments carry extremely high risks. This article does not constitute investment advice. Investors should make prudent decisions based on their own risk tolerance and are advised to consult professional financial advisors. Never invest more than you can afford to lose.
FAQ
JOE token has experienced significant volatility since launch. Starting from under $1, it peaked above $3 in 2021-2022 bull market, then corrected during the 2022 crypto winter. Currently trading with strong recovery momentum, showing resilience in market cycles and bullish long-term potential.
What are the main factors affecting JOE price?
JOE price is influenced by market demand and supply, trading volume, overall crypto market sentiment, Avalanche ecosystem developments, token utility growth, liquidity provision changes, and macroeconomic conditions affecting the broader digital asset market.
What is the JOE price prediction for 2024?
Based on market analysis, JOE showed strong momentum throughout 2024, with predictions suggesting potential prices ranging from $0.50 to $1.20 USD. Growth drivers included ecosystem expansion and increased trading volume. However, actual performance depends on market conditions and adoption rates.
How to analyze and predict future price trends of JOE token?
Analyze JOE's price trends by monitoring trading volume, market capitalization, developer activity, and on-chain metrics. Track liquidity pools and user adoption rates. Consider macroeconomic factors and crypto market cycles for comprehensive price predictions.
What advantages does JOE token have compared to other DEX governance tokens?
JOE token offers superior liquidity incentives, efficient capital allocation through Avalanche's fast finality, and strong community governance. It provides attractive yield farming opportunities and lower transaction costs than competing DEX tokens, driving sustained user growth and ecosystem expansion.
What risks should I be aware of when investing in JOE tokens?
JOE token investments carry market volatility risks, liquidity fluctuations, and protocol-specific risks. Smart contract vulnerabilities, regulatory changes, and ecosystem dependencies may impact token value. Consider your risk tolerance and conduct thorough research before investing.
* The information is not intended to be and does not constitute financial advice or any other recommendation of any sort offered or endorsed by Gate.