This comprehensive analysis examines K21, a tokenized NFT art vault project trading at $0.01788 as of February 2026, with a market capitalization of approximately $322,317. The article reviews K21's historical price trajectory from its 2021 launch peak of $11.59 to current levels, analyzing market dynamics, holder distribution, and sentiment indicators revealing extreme fear conditions. Expert price forecasts project potential recovery ranging from $0.01341 to $0.03146 through 2031, contingent upon ecosystem development and broader cryptocurrency market recovery. Investment strategies encompass long-term accumulation during downturns and active trading approaches, complemented by comprehensive risk management frameworks and portfolio allocation guidelines. The analysis addresses critical risks including high volatility, limited liquidity on Gate.com, regulatory uncertainties surrounding NFT classification, and smart contract dependencies, providing actionable recommendations for beginners, experienced investo
Introduction: K21's Market Position and Investment Value
K21, as a tokenized NFT art vault project developed by Kanon, has been operating since its launch in 2021. As of February 2026, K21 maintains a market capitalization of approximately $322,317, with a circulating supply of around 18.03 million tokens, and the price currently stands at $0.01788. This asset, which enables fractional ownership of curated NFT collections, is playing a role in the intersection of blockchain technology and digital art ownership.
This article will comprehensively analyze K21's price trends from 2026 to 2031, combining historical patterns, market supply and demand dynamics, ecosystem developments, and macroeconomic conditions to provide investors with professional price predictions and practical investment strategies.
I. K21 Price History Review and Market Status
K21 Historical Price Evolution Trajectory
- March 2021: K21 launched with an initial price of 5.78, reaching its historical peak of 11.59 on March 27, 2021, representing substantial early momentum.
- 2021-2025: The token experienced a prolonged downward trend, reflecting broader market corrections and adjustments in the NFT and art-focused crypto sectors.
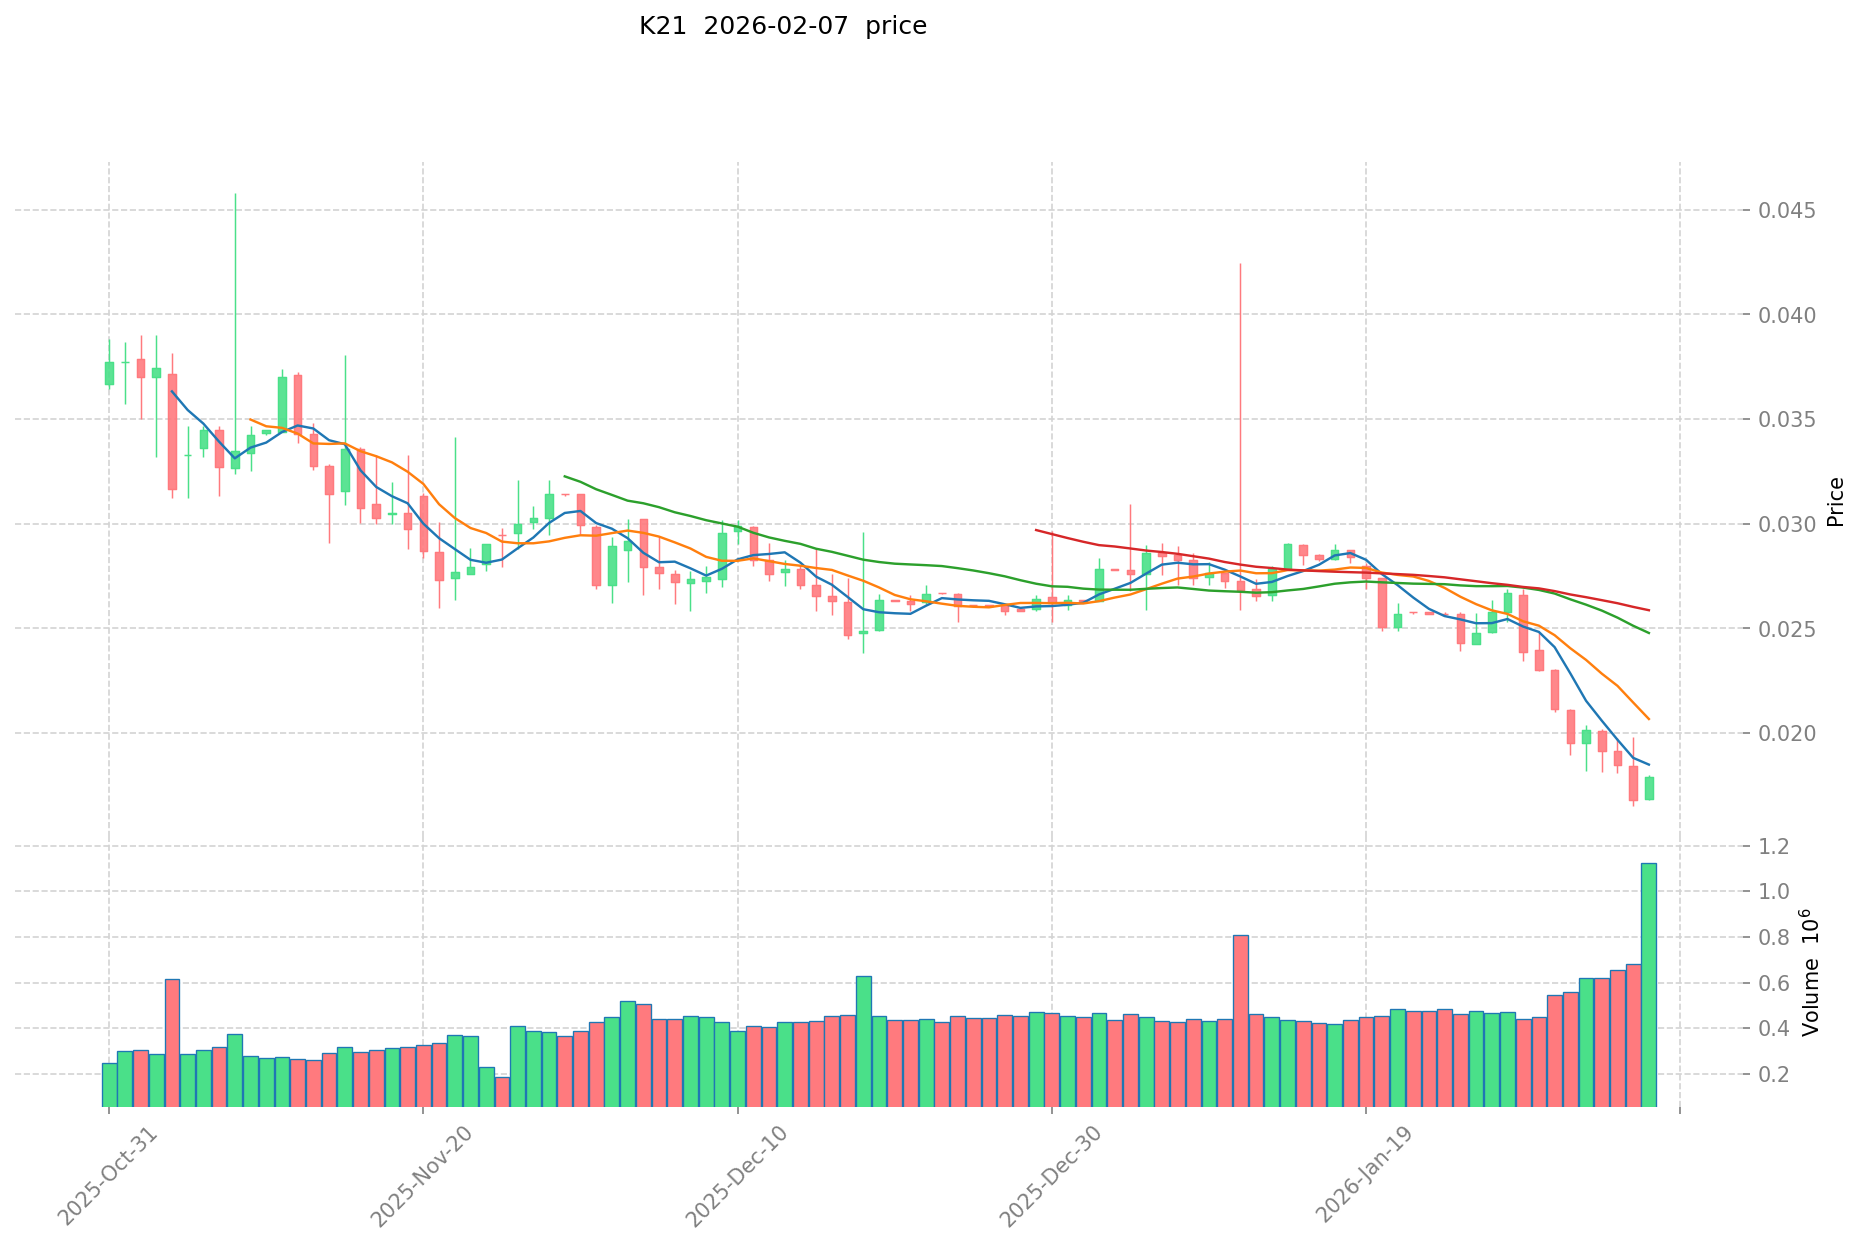
- February 2026: K21 touched its historical low of 0.01649066 on February 6, 2026, marking a notable decline from its peak levels.
K21 Current Market Status
As of February 7, 2026, K21 is trading at 0.01788, showing a 6.3% increase over the past 24 hours with a trading range between 0.01682 and 0.01798. Despite this short-term recovery, the token has experienced a 22.33% decline over the past week and a 36.78% decrease over the past month. The one-year performance indicates a 64.22% reduction.
The token's market capitalization stands at approximately 322,317.36, with a fully diluted market cap of 375,480. K21 has a circulating supply of 18,026,697.92 tokens, representing 85.84% of the maximum supply of 21,000,000 tokens. The 24-hour trading volume amounts to 20,278.42. The token is held by 3,769 addresses, indicating a moderate level of distribution among participants. The current market sentiment index registers at 6, reflecting extreme fear conditions in the broader cryptocurrency market.
K21's market share is relatively limited at 0.000014% of the total crypto market. The token is available for trading on Gate.com and operates as an ERC-20 token on the Ethereum blockchain.
Click to view current K21 market price
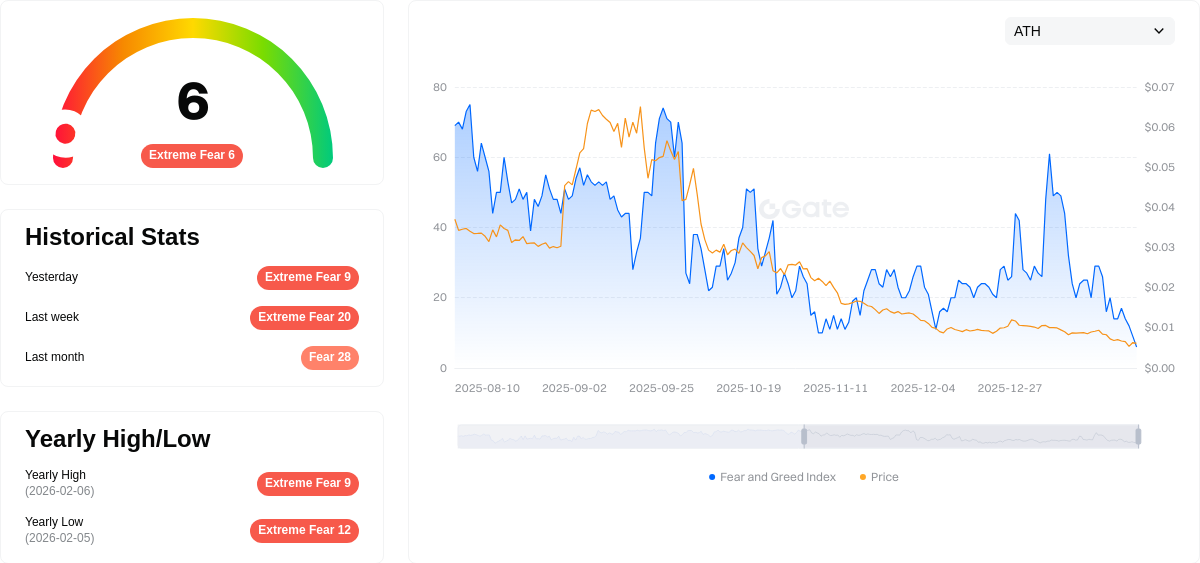
K21 Market Sentiment Indicator
2026-02-07 Fear and Greed Index: 6 (Extreme Fear)
Click to view current Fear & Greed Index
The cryptocurrency market is currently experiencing extreme fear, with the Fear and Greed Index hitting a low of 6. This indicates significant market pessimism and heightened risk aversion among investors. When the index reaches such extreme levels, it often signals potential oversold conditions. Market participants should remain vigilant, as periods of extreme fear can present contrarian opportunities for long-term investors. However, caution is advised, as further market volatility may persist. Monitor key support levels and risk management strategies closely during this phase of market uncertainty.
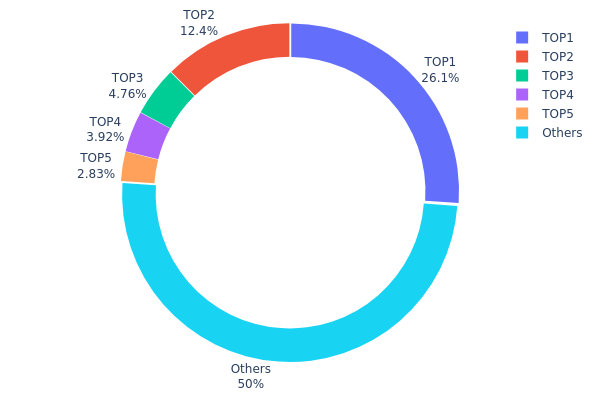
K21 Holding Distribution
Based on the current holding distribution data, K21 exhibits a relatively concentrated ownership structure. The top holder controls approximately 26.11% of the total supply (5.48 million tokens), while the second-largest address holds 12.42% (2.61 million tokens). The top five addresses collectively account for about 50.02% of the total supply, indicating that half of K21's circulating tokens are concentrated among a small group of major holders. Meanwhile, the remaining 49.98% is distributed across all other addresses, suggesting a moderate level of decentralization among smaller participants.
This concentration pattern presents both opportunities and risks for the K21 market. On one hand, the presence of large holders may provide price stability during periods of market uncertainty, as these addresses typically represent institutional investors or long-term holders who are less likely to engage in panic selling. On the other hand, such concentrated holdings create potential vulnerability to significant price volatility if any top holder decides to liquidate their position. The ability of a single address to influence nearly one-quarter of the supply raises concerns about potential market manipulation and the token's resilience to sudden sell pressure.
From a market structure perspective, K21's current distribution reflects a semi-centralized ownership model that falls between fully decentralized community-driven tokens and heavily concentrated project-controlled assets. While not ideal for pure decentralization advocates, this structure is relatively common among tokenized asset funds and may align with K21's operational requirements. However, investors should monitor any significant changes in top holder positions, as such movements could signal shifts in market sentiment or upcoming strategic decisions that may impact token price and liquidity.
Click to view the current K21 Holding Distribution
| Top |
Address |
Holding Qty |
Holding (%) |
| 1 |
0x3bf8...5aa7f3 |
5483.23K |
26.11% |
| 2 |
0xa4fc...dec59a |
2608.36K |
12.42% |
| 3 |
0x3a5e...661af1 |
999.33K |
4.75% |
| 4 |
0x573f...507ef5 |
822.35K |
3.91% |
| 5 |
0x478a...599735 |
594.82K |
2.83% |
| - |
Others |
10491.91K |
49.98% |
II. Core Factors Influencing K21's Future Price
Supply Mechanism
Based on the available materials, specific information regarding K21's supply mechanism, historical supply patterns, or current supply expectations was not found. Without concrete data on token economics, emission schedules, or supply adjustments, this section cannot be accurately completed.
Institutional and Major Holder Dynamics
The provided materials do not contain information about institutional holdings, corporate adoption, or national policies specifically related to K21. References in the materials primarily concern unrelated entities such as infrastructure projects, real estate development, and manufacturing companies. No verifiable data exists regarding institutions holding K21 tokens or enterprises utilizing K21 in their operations.
Macroeconomic Environment
While the materials mention general economic factors like exchange rate fluctuations and inflation management in various contexts, there is no specific connection established between these macroeconomic conditions and K21. The materials reference currency policy considerations and inflation impacts in isolated business contexts, but lack direct applicability to cryptocurrency price dynamics or K21 specifically.
Technical Development and Ecosystem Building
The available materials do not provide information about K21's technical upgrades, protocol improvements, or ecosystem applications. Without data on network enhancements, DApp development, or ecosystem projects built on K21, this analysis cannot identify specific technical factors that may influence future price movements.
Note: The materials provided do not contain substantive information about K21 as a cryptocurrency asset. A comprehensive analysis of price-influencing factors would require access to K21-specific documentation, including tokenomics, development roadmaps, partnership announcements, and market data.
III. 2026-2031 K21 Price Forecast
2026 Outlook
- Conservative forecast: $0.01341 - $0.01788
- Neutral forecast: approximately $0.01788
- Optimistic forecast: up to $0.01895 (requires favorable market conditions)
2027-2029 Outlook
- Market phase expectation: The token may enter a gradual growth phase, with projected year-over-year increases ranging from 3% to 25%
- Price range forecast:
- 2027: $0.01694 - $0.02339
- 2028: $0.01589 - $0.02383
- 2029: $0.02169 - $0.03154
- Key catalysts: Market sentiment improvements, ecosystem development progress, and broader cryptocurrency market trends could serve as primary drivers for price appreciation
2030-2031 Long-term Outlook
- Baseline scenario: $0.02695 - $0.02776 (assuming stable market conditions and continued project development)
- Optimistic scenario: $0.02653 - $0.03146 (assuming accelerated adoption and enhanced utility)
- Transformative scenario: prices could potentially reach the upper range of forecasts (requires significant breakthrough developments and widespread market acceptance)
- February 7, 2026: K21 current reference point for tracking subsequent price movements and forecast accuracy
| Year |
Predicted High Price |
Predicted Average Price |
Predicted Low Price |
Price Change |
| 2026 |
0.01895 |
0.01788 |
0.01341 |
0 |
| 2027 |
0.02339 |
0.01842 |
0.01694 |
3 |
| 2028 |
0.02383 |
0.0209 |
0.01589 |
16 |
| 2029 |
0.03154 |
0.02237 |
0.02169 |
25 |
| 2030 |
0.02776 |
0.02695 |
0.01509 |
50 |
| 2031 |
0.03146 |
0.02736 |
0.02653 |
52 |
IV. K21 Professional Investment Strategy and Risk Management
K21 Investment Methodology
(I) Long-term Holding Strategy
- Suitable for: Investors interested in NFT-backed digital art projects with a medium to long-term horizon
- Operational Recommendations:
- Consider accumulating positions during market downturns, given the token's significant decline from its historical high
- Monitor the project's art vault development and community governance participation rates
- Utilize secure storage solutions such as Gate Web3 Wallet for long-term holding
(II) Active Trading Strategy
- Technical Analysis Tools:
- Volume Analysis: Monitor the daily trading volume of approximately $20,278 to identify liquidity patterns
- Support and Resistance Levels: Track the 24-hour range between $0.01682 and $0.01798 for short-term trading opportunities
- Swing Trading Points:
- Consider the 7-day decline of 22.33% as a potential oversold condition for tactical entries
- Set stop-loss orders below recent lows to manage downside risk
K21 Risk Management Framework
(I) Asset Allocation Principles
- Conservative investors: 0.5-1% of crypto portfolio
- Aggressive investors: 2-3% of crypto portfolio
- Professional investors: Up to 5% with active monitoring
(II) Risk Hedging Solutions
- Diversification: Combine K21 with other NFT and art-related tokens to reduce project-specific risk
- Position Sizing: Limit initial exposure given the 64.22% decline over one year
(III) Secure Storage Solutions
- Software Wallet Recommendation: Gate Web3 Wallet for convenient access and trading
- Multi-signature Option: Consider multi-signature wallets for larger holdings
- Security Precautions: Never share private keys, enable two-factor authentication, and regularly update security settings
V. K21 Potential Risks and Challenges
K21 Market Risk
- High Volatility: The token has experienced a 64.22% decline over the past year, indicating substantial price volatility
- Limited Liquidity: With a market cap of approximately $322,317 and trading on only one exchange, liquidity may be constrained during large transactions
- Market Share: The token represents only 0.000014% of the total crypto market, suggesting limited mainstream adoption
K21 Regulatory Risk
- NFT Classification: Regulatory uncertainty surrounding NFT-backed tokens may impact the project's operations
- Art Market Regulations: Potential scrutiny from traditional art market regulators regarding tokenized art ownership
- Cross-border Transactions: Legal complexities in different jurisdictions may affect international trading
K21 Technical Risk
- Smart Contract Dependency: The project relies on smart contracts for vault buyout voting mechanisms, which may contain undiscovered vulnerabilities
- Ethereum Network Risk: As an ERC-20 token, K21 is subject to Ethereum network congestion and gas fee fluctuations
- Custody Model: The centralized custody of physical NFTs and art pieces introduces counterparty risk
VI. Conclusion and Action Recommendations
K21 Investment Value Assessment
K21 represents a unique intersection of digital art, NFTs, and decentralized ownership. While the project offers innovative exposure to curated art collections through tokenization, the substantial price decline from its all-time high of $11.59 to the current price of $0.01788 reflects significant market headwinds. The limited liquidity, with trading on only one exchange, and the small holder base of 3,769 users suggest the project remains in a niche stage. Long-term value depends on the project's ability to expand its art vault, increase community engagement, and navigate evolving NFT market dynamics. Short-term risks include continued price volatility, limited trading volume, and broader NFT market sentiment.
K21 Investment Recommendations
✅ Beginners: Approach with extreme caution and allocate no more than 0.5% of crypto portfolio; prioritize education about NFT-backed tokens before investing
✅ Experienced Investors: Consider small speculative positions during market dips, maintain strict stop-loss disciplines, and monitor project developments closely
✅ Institutional Investors: Conduct comprehensive due diligence on the art vault composition, legal structure, and governance mechanisms before committing capital
K21 Trading Participation Methods
- Spot Trading: Purchase K21 tokens directly on Gate.com for long-term holding or short-term trading
- Dollar-Cost Averaging: Implement systematic purchases to mitigate timing risk in volatile market conditions
- Community Participation: Engage with the project's governance mechanisms, including vault buyout voting rights, to influence project direction
Cryptocurrency investment carries extremely high risk, and this article does not constitute investment advice. Investors should make prudent decisions based on their own risk tolerance and are advised to consult professional financial advisors. Never invest more than you can afford to lose.
FAQ
What is K21 and what are its key characteristics?
K21 is a digital asset designed for the Web3 ecosystem, featuring fast transaction speeds, low fees, and decentralized governance. Key characteristics include smart contract capability, cross-chain compatibility, and sustainable tokenomics for long-term value appreciation.
What factors influence K21 price movements?
K21 price movements are driven by market sentiment, trading volume, technological advancements, and user adoption trends in the ecosystem.
What are expert predictions for K21 price in 2024-2025?
Expert predictions suggest K21 could reach $15-$20 by 2025, driven by market adoption and network growth. Analysis indicates positive momentum based on current market trends and development progress.
How to analyze K21 price trends and technical indicators?
Analyze K21 price trends using historical data and technical indicators like moving averages and RSI. Identify chart patterns, support/resistance levels, and trading volume. Use MetaTrader for detailed analysis. Monitor market cycles and develop risk management strategies based on price fluctuations.
What are the risks associated with K21 price volatility?
K21 price volatility presents risks of significant short-term fluctuations, potential market manipulation, and high speculative risk due to its emerging cryptocurrency status in the market.
K21 has a market cap of $362,072, comparable to assets like VinuChain and KlimaDAO. Its all-time high reached $7.55. With 24-hour trading volume at $12,443, K21 demonstrates solid market activity among similar-cap assets in the crypto ecosystem.
* The information is not intended to be and does not constitute financial advice or any other recommendation of any sort offered or endorsed by Gate.