This comprehensive analysis examines KERNEL token's price trajectory from 2026 through 2031, providing expert forecasts for investors in the restaking ecosystem. The article reviews KERNEL's market history since its April 2025 launch on Gate, current trading at $0.07464 with $12.12 million market cap, and holding distribution patterns revealing 79.66% concentration among top five addresses. Core sections deliver three-year price predictions across conservative, neutral, and optimistic scenarios, complemented by professional investment strategies including long-term holding and active trading methodologies. Risk management frameworks, regulatory considerations, technical risks, and secure storage solutions guide both beginner and institutional investors. The analysis combines on-chain metrics, ecosystem fundamentals, and macroeconomic factors to assess KERNEL's potential within the competitive DeFi infrastructure landscape, emphasizing that cryptocurrency investment carries substantial risks.
Introduction: KERNEL's Market Position and Investment Value
KernelDAO (KERNEL), positioned as a restaking ecosystem on Ethereum and BNB Chain, has established itself as a significant player in the DeFi infrastructure space since its launch in 2025. The project has achieved notable milestones, including securing over $2 billion in Total Value Locked (TVL) across 10 blockchain networks, partnering with more than 50 DeFi protocols, and supporting over 30 projects building within its ecosystem. As of January 25, 2026, KERNEL maintains a market capitalization of approximately $12.12 million, with a circulating supply of around 162.32 million tokens and a current price hovering near $0.07464. This asset, recognized for its innovative approach to shared security and automated vault strategies, is playing an increasingly important role in maximizing the utility of staked assets including ETH, BTC, and BNB.
This article will comprehensively analyze KERNEL's price trajectory from 2026 through 2031, combining historical patterns, market supply-demand dynamics, ecosystem development, and macroeconomic conditions to provide investors with professional price forecasts and practical investment strategies.
I. KERNEL Price History Review and Market Status
KERNEL Historical Price Evolution Trajectory
- 2025: KERNEL launched on Gate.com in April 2025, reaching its historical peak of $0.4998 on April 14, 2025, shortly after its debut
- 2025: The token experienced significant volatility throughout the year, with price declining sharply from its all-time high
- 2025: Market correction led to a substantial drawdown, with KERNEL reaching its historical low of $0.05612 on December 18, 2025, representing a decline of approximately 88.8% from its peak
KERNEL Current Market Situation
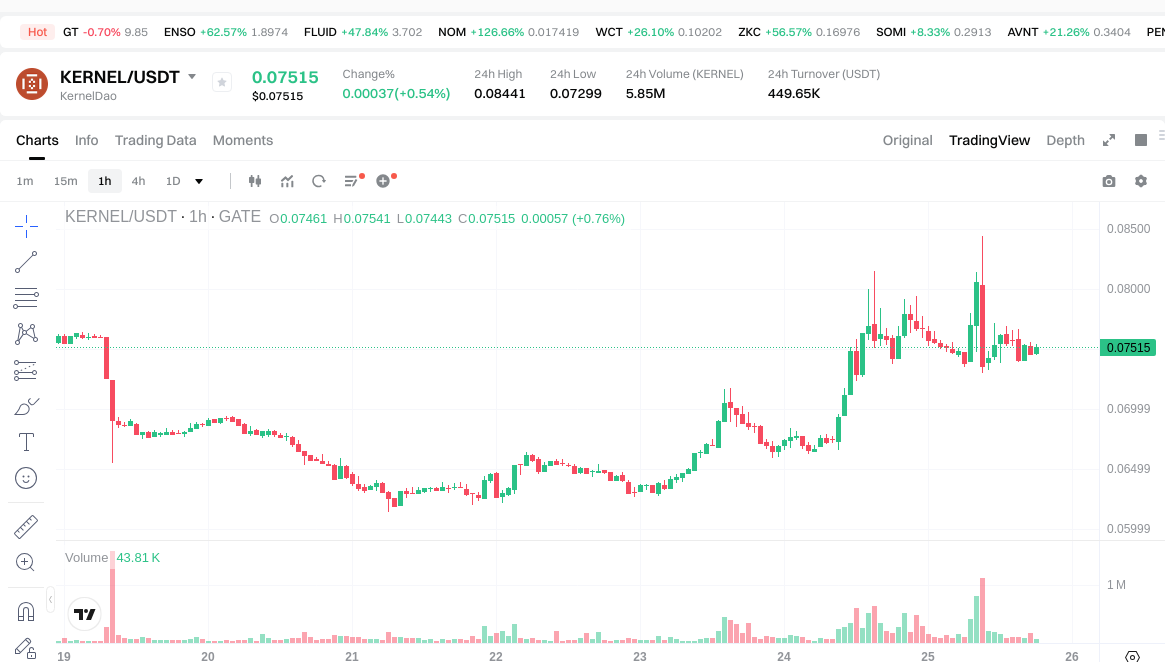
As of January 25, 2026, KERNEL is trading at $0.07464, showing a modest increase of 0.21% over the past 24 hours. The token has demonstrated some recovery from its December 2025 lows, gaining 0.59% over the past week and 8.74% over the past 30 days.
The current market capitalization stands at approximately $12.12 million, with a circulating supply of 162.32 million KERNEL tokens, representing 16.23% of the total supply of 1 billion tokens. The fully diluted market cap is calculated at $74.64 million. The 24-hour trading volume reaches $449,295.77, indicating moderate market activity.
KERNEL's market cap to fully diluted valuation ratio of 16.23% suggests a relatively low circulating supply compared to its maximum supply. The token maintains a market dominance of 0.0023% within the broader cryptocurrency ecosystem. With 13,192 holders across its network, KERNEL has established a presence within the restaking ecosystem community.
The current price of $0.07464 represents a 33.0% recovery from its all-time low but remains approximately 85.1% below its all-time high reached in April 2025. The token is currently trading within a 24-hour range between $0.07299 and $0.08441, showing intraday volatility of approximately 15.6%.
KERNEL is listed on 32 exchanges, with Gate.com being a primary trading venue. The project operates as a restaking ecosystem on Ethereum and BNB Chain, focusing on automated vault strategies and shared security mechanisms. According to available information, the platform has attracted over $2 billion in Total Value Locked (TVL) across 10 blockchain networks, partnering with more than 50 DeFi protocols and supporting 30+ projects building within the Kernel ecosystem.
Click to view current KERNEL market price
KERNEL Market Sentiment Index
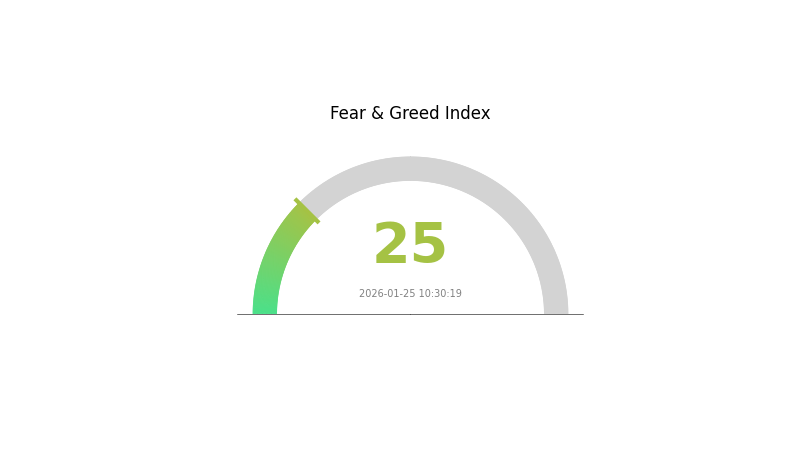
2026-01-25 Fear & Greed Index: 25 (Extreme Fear)
Click to view current Fear & Greed Index
The cryptocurrency market is currently gripped by extreme fear, with the Fear & Greed Index standing at 25. This historically low reading indicates pronounced market anxiety and pessimism among investors. During such periods, panic selling often accelerates, creating significant downward pressure on asset prices. However, extreme fear has traditionally presented contrarian investment opportunities for long-term investors. Market capitalization and trading volumes may experience sharp declines as participants rush to reduce exposure. Traders should exercise heightened caution and implement robust risk management strategies while monitoring key support levels and fundamental developments that could signal potential market stabilization or recovery.
KERNEL Holding Distribution
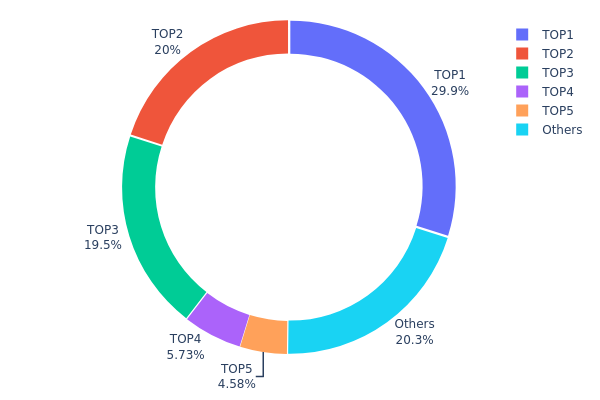
The holding distribution chart illustrates the allocation of KERNEL tokens across different wallet addresses, providing insights into the token's concentration among holders. As of January 25, 2026, the top five addresses collectively control approximately 79.66% of the total supply, indicating a relatively high concentration level that warrants careful examination.
The data reveals that the largest holder possesses 298,532.26K tokens (29.85%), followed by the second and third largest addresses holding 20.00% and 19.51% respectively. This concentration pattern suggests that nearly half of the circulating supply is controlled by just three addresses. The fourth and fifth positions hold 5.73% and 4.57% respectively, while the remaining addresses collectively account for only 20.34% of the total supply. Such distribution characteristics typically signal elevated centralization risks, as major holders possess significant influence over market dynamics and price movements.
From a market structure perspective, this concentration level could contribute to increased volatility and reduced liquidity depth. Large holders have the capacity to create substantial market impacts through their trading activities, potentially leading to sharp price fluctuations. The limited token distribution among smaller holders may also indicate lower retail participation or restricted token circulation in the broader ecosystem. While concentrated holdings do not necessarily imply malicious intent, they do present inherent risks related to market manipulation potential and sudden supply shocks that investors should carefully monitor when evaluating KERNEL's on-chain fundamentals.
Click to view the current KERNEL holding distribution
| Top |
Address |
Holding Qty |
Holding (%) |
| 1 |
0xa7cd...7f4290 |
298532.26K |
29.85% |
| 2 |
0x226b...29f5e7 |
200000.00K |
20.00% |
| 3 |
0x52ad...98828b |
195159.72K |
19.51% |
| 4 |
0x09fd...c80393 |
57342.70K |
5.73% |
| 5 |
0xf977...41acec |
45751.55K |
4.57% |
| - |
Others |
203213.77K |
20.34% |
II. Core Factors Influencing KERNEL's Future Price
Based on the current available information, there is insufficient data to provide a comprehensive analysis of the core factors that may influence KERNEL's future price movements. Key areas that would typically be covered include supply mechanisms, institutional and whale dynamics, macroeconomic environment impacts, and technological developments within the ecosystem.
As more information becomes available regarding KERNEL's tokenomics, adoption patterns, and technical roadmap, a more detailed analysis can be provided to assess potential price catalysts and risks.
III. 2026-2031 KERNEL Price Forecast
2026 Outlook
- Conservative forecast: $0.0616 - $0.0751
- Neutral forecast: $0.0751 (average market conditions)
- Optimistic forecast: $0.1045 (requires favorable market sentiment and increased adoption)
2027-2029 Outlook
- Market stage expectation: Gradual growth phase with potential accumulation periods and moderate volatility as the project matures
- Price range forecast:
- 2027: $0.0548 - $0.1033
- 2028: $0.0743 - $0.1410
- 2029: $0.1033 - $0.1567
- Key catalysts: Progressive market adoption, technological developments within the ecosystem, and broader crypto market recovery trends
2030-2031 Long-term Outlook
- Baseline scenario: $0.0813 - $0.1377 (assuming steady ecosystem development and stable market conditions)
- Optimistic scenario: $0.1377 - $0.1667 (contingent upon significant protocol upgrades and expanded use cases)
- Transformational scenario: $0.1522 - $0.1796 (requires exceptional market conditions, widespread institutional adoption, and major breakthrough in utility)
- 2026-01-25: KERNEL trading within established range (current market consolidation phase)
| Year |
Predicted High Price |
Predicted Average Price |
Predicted Low Price |
Price Change |
| 2026 |
0.10446 |
0.07515 |
0.06162 |
0 |
| 2027 |
0.10327 |
0.0898 |
0.05478 |
20 |
| 2028 |
0.14095 |
0.09654 |
0.07434 |
29 |
| 2029 |
0.15674 |
0.11874 |
0.10331 |
59 |
| 2030 |
0.16667 |
0.13774 |
0.08127 |
84 |
| 2031 |
0.1796 |
0.15221 |
0.1172 |
103 |
IV. KERNEL Professional Investment Strategy and Risk Management
KERNEL Investment Methodology
(1) Long-term Holding Strategy
- Target Investors: Long-term believers in the restaking ecosystem and DeFi protocol development
- Operational Recommendations:
- Consider accumulating positions during market corrections, particularly when price approaches key support levels
- Monitor the project's TVL growth across its 10-chain ecosystem and partnerships with 50+ DeFi platforms as fundamental indicators
- Implement a secure storage solution using Gate Web3 Wallet for asset custody
(2) Active Trading Strategy
- Technical Analysis Tools:
- Moving Averages: Track 50-day and 200-day moving averages to identify trend direction and potential reversal points
- Volume Analysis: Monitor 24-hour trading volume ($449,295.77) relative to market cap to gauge liquidity and trading interest
- Swing Trading Considerations:
- Observe price volatility patterns within the recent range between support at $0.05612 and resistance levels
- Set stop-loss orders to manage downside risk, particularly given the token's historical volatility
KERNEL Risk Management Framework
(1) Asset Allocation Principles
- Conservative Investors: 1-3% of crypto portfolio allocation
- Aggressive Investors: 5-8% of crypto portfolio allocation
- Professional Investors: Up to 10% with active risk monitoring
(2) Risk Hedging Solutions
- Portfolio Diversification: Balance KERNEL exposure with established DeFi blue-chip tokens and stablecoins
- Position Sizing: Utilize dollar-cost averaging to reduce timing risk in volatile market conditions
(3) Secure Storage Solutions
- Hot Wallet Recommendation: Gate Web3 Wallet for active trading and staking participation
- Cold Storage Option: Consider hardware wallet solutions for long-term holdings exceeding trading needs
- Security Precautions: Enable two-factor authentication, regularly verify contract addresses on Etherscan, and avoid sharing private keys
V. KERNEL Potential Risks and Challenges
KERNEL Market Risks
- High Volatility: The token has experienced significant price fluctuations, with current price at $0.07464 representing a substantial decline from historical levels
- Limited Market Capitalization: With a market cap of approximately $12.12 million and market dominance of only 0.0023%, the token may be susceptible to liquidity constraints
- Trading Volume Concentration: Relatively modest 24-hour trading volume may result in slippage during larger transactions
KERNEL Regulatory Risks
- Restaking Protocol Scrutiny: Evolving regulatory frameworks for staking and restaking mechanisms may impact operations across Ethereum and BNB Chain
- Cross-chain Compliance: Operating across 10 different blockchain networks may present complex jurisdictional compliance challenges
- Token Classification Uncertainty: Regulatory authorities may reassess the classification of governance and utility tokens in restaking ecosystems
KERNEL Technical Risks
- Smart Contract Dependencies: The project's integration of complex smart contract systems for asset management carries inherent technical risks
- Cross-chain Bridge Vulnerabilities: Operating across multiple chains requires secure bridging infrastructure that may face technical challenges
- Ecosystem Competition: The restaking sector faces growing competition, which may impact KernelDAO's market position and TVL retention
VI. Conclusion and Action Recommendations
KERNEL Investment Value Assessment
KernelDAO presents an interesting proposition within the restaking ecosystem, with infrastructure spanning 10 chains and partnerships with over 50 DeFi protocols. However, the token's significant price volatility and relatively small market capitalization suggest elevated risk levels. The project's long-term value proposition depends on sustained TVL growth and successful execution of its shared security model, while short-term risks include market volatility, competitive pressures, and evolving regulatory landscapes.
KERNEL Investment Recommendations
✅ Beginners: Consider starting with minimal exposure (1-2% of crypto portfolio) after thoroughly researching the restaking ecosystem and understanding the associated risks
✅ Experienced Investors: May allocate 3-5% with active monitoring of TVL metrics, partnership developments, and technical indicators for potential position adjustments
✅ Institutional Investors: Conduct comprehensive due diligence on smart contract audits, governance mechanisms, and regulatory compliance before considering strategic positions
KERNEL Trading Participation Methods
- Spot Trading: Execute buy and sell orders on Gate.com with attention to liquidity conditions and order book depth
- Strategic Accumulation: Consider dollar-cost averaging approach during market downturns to build positions gradually
- Portfolio Rebalancing: Regularly assess KERNEL allocation relative to overall portfolio strategy and risk tolerance adjustments
Cryptocurrency investment carries extremely high risks, and this article does not constitute investment advice. Investors should make cautious decisions based on their own risk tolerance and are advised to consult professional financial advisors. Never invest more than you can afford to lose.
FAQ
What is KERNEL token and what is its purpose?
KERNEL is a governance token that enables holders to participate in protocol decision-making and earn rewards. It powers the ecosystem by granting voting rights on key upgrades and strategic initiatives within the network.
What factors affect KERNEL token price?
KERNEL price is influenced by market demand and supply dynamics, trading volume in the market, overall crypto market sentiment, project developments and announcements, network adoption rates, and macroeconomic conditions affecting the broader cryptocurrency sector.
How to conduct KERNEL price prediction analysis?
Analyze KERNEL price trends by examining historical charts, trading volume data, market sentiment, and on-chain metrics. Monitor technical indicators like moving averages and resistance levels. Consider macroeconomic factors and ecosystem developments to forecast potential price movements.
What is the historical price trend of KERNEL?
KERNEL has experienced significant growth since launch, with price appreciation driven by increasing adoption and ecosystem development. The token has shown resilience through market cycles, with notable rallies during bull markets and strategic corrections during downturns. Long-term holders have benefited from substantial returns as the project matured.
What risks should I pay attention to when investing in KERNEL?
KERNEL carries volatility risks typical of crypto assets. Monitor market conditions, project developments, and liquidity. Diversify your portfolio and only invest what you can afford to lose. Stay updated on tokenomics changes and regulatory developments.
What are the advantages of KERNEL compared to other tokens?
KERNEL offers superior governance features, lower transaction fees, and faster settlement times. Its innovative tokenomics ensure sustainable value growth, while enhanced security protocols and active community support provide reliable long-term utility and adoption potential.
* The information is not intended to be and does not constitute financial advice or any other recommendation of any sort offered or endorsed by Gate.