This comprehensive guide analyzes Layer3 (L3) token price dynamics from 2026 through 2031, combining historical market data with expert forecasting. Currently trading at $0.01248 with a $14.85 million market cap, L3 serves as an omnichain identity and attention economy protocol addressing blockchain fragmentation. The article examines L3's price trajectory, token distribution patterns showing 66.32% concentration in top 5 addresses, and provides detailed price forecasts across conservative, neutral, and optimistic scenarios. It presents actionable investment strategies through long-term holding and active trading approaches, outlines comprehensive risk management frameworks for different investor types, and identifies key technical, regulatory, and competitive challenges. Designed for beginners, experienced traders, and institutional investors on Gate exchange, this analysis equips readers with professional insights for informed decision-making regarding L3 token investments while emphasizing rigorous risk as
Introduction: L3's Market Position and Investment Value
Layer3 (L3), as an omnichain identity and distribution protocol infrastructure, has been establishing its presence in the decentralized attention economy since its launch in 2023. As of 2026, Layer3 holds a market capitalization of approximately $14.85 million, with a circulating supply of around 1.19 billion tokens, and a price hovering around $0.01248. This asset, positioned as a protocol that commoditizes attention—one of the world's most valuable resources—is playing an increasingly important role in addressing blockchain ecosystem fragmentation and user engagement challenges.
This article will comprehensively analyze L3's price trajectory from 2026 through 2031, combining historical patterns, market supply and demand dynamics, ecosystem development, and macroeconomic conditions to provide investors with professional price forecasts and practical investment strategies.
I. L3 Price History Review and Market Status
L3 Historical Price Evolution Trajectory
- 2023: L3 token launched in June with an initial price of $0.09, marking the project's entry into the cryptocurrency market
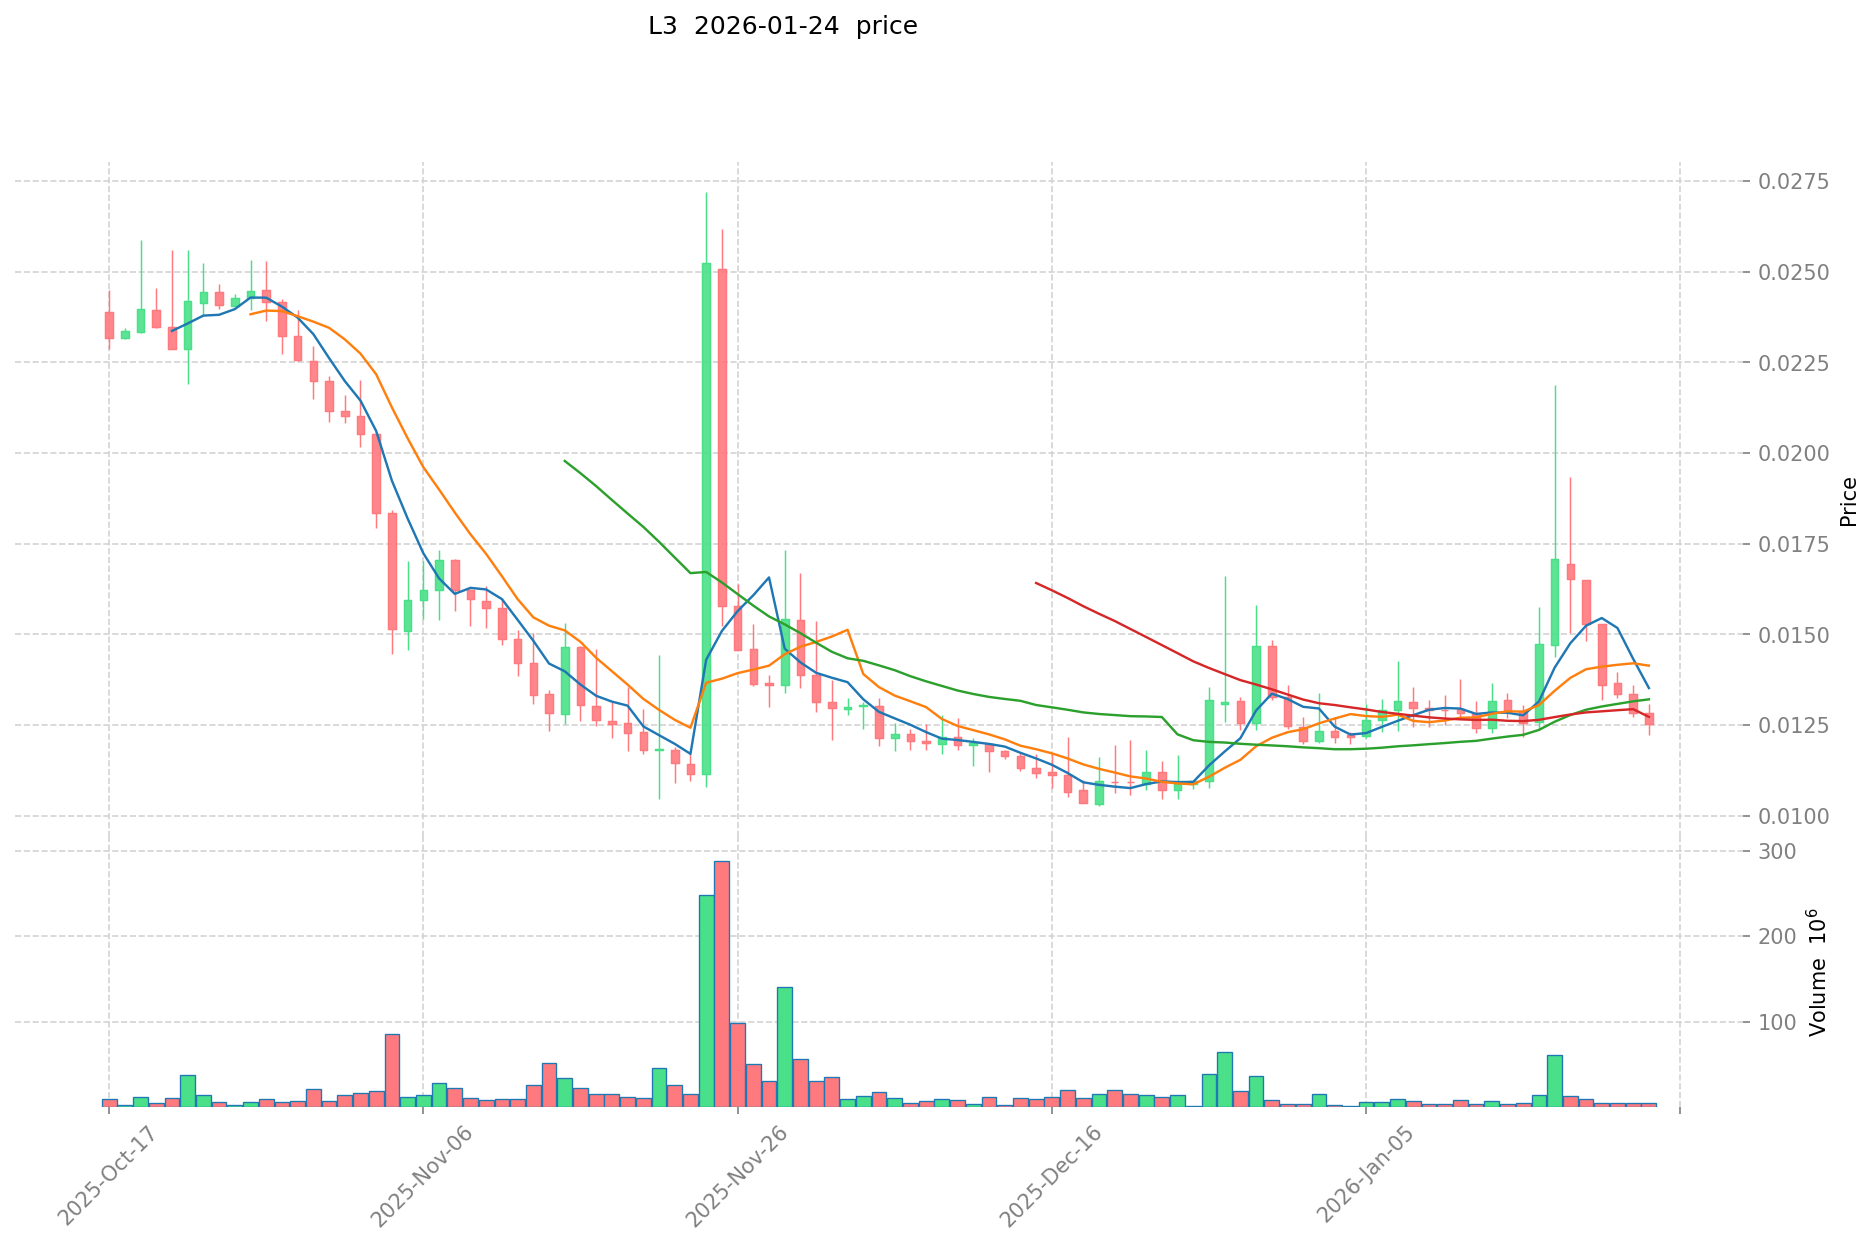
- 2025: In March, the token experienced significant upward momentum, reaching its historical peak at $0.16087
- 2025: By December, market conditions led to a substantial correction, with the price declining to its historical low of $0.01026
L3 Current Market Situation
As of January 24, 2026, L3 is trading at $0.01248, showing a decrease of 2.95% over the past 24 hours. The token has experienced notable volatility in recent periods, with a 7-day decline of 30.76%, while demonstrating a 30-day recovery of 15.29%. Over the past year, the token has decreased by 88.42% from previous levels.
The current market capitalization stands at approximately $14.85 million, with a circulating supply of 1.19 billion tokens representing 35.7% of the total supply of 3.33 billion tokens. The fully diluted market cap is valued at $41.6 million. Trading volume over the past 24 hours reached $90,394.51, with the token available on 18 exchanges and held by 22,890 addresses.
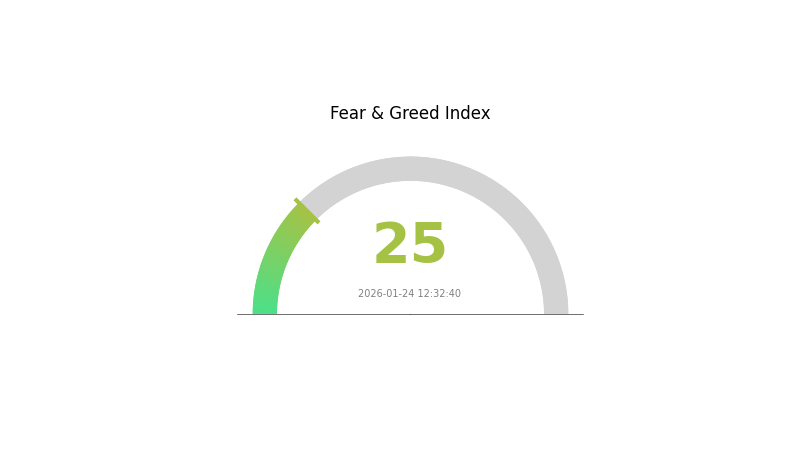
The 24-hour trading range shows fluctuation between $0.01223 and $0.01295. Current market sentiment indicators suggest an extreme fear level with a volatility index of 25, reflecting cautious investor behavior in the broader cryptocurrency market.
Click to view current L3 market price
L3 Market Sentiment Indicator
2026-01-24 Fear and Greed Index: 25 (Extreme Fear)
Click to view current Fear & Greed Index
The cryptocurrency market is experiencing extreme fear, with the Fear and Greed Index at 25. This indicates significant market pessimism and investor anxiety regarding digital assets. During periods of extreme fear, opportunities often emerge for contrarian investors. However, traders should exercise caution and conduct thorough research before making investment decisions. Market volatility remains elevated, and risk management is essential. Long-term investors may view such downturns as potential accumulation opportunities, while short-term traders should remain vigilant and adapt their strategies accordingly to current market conditions.
L3 Holding Distribution
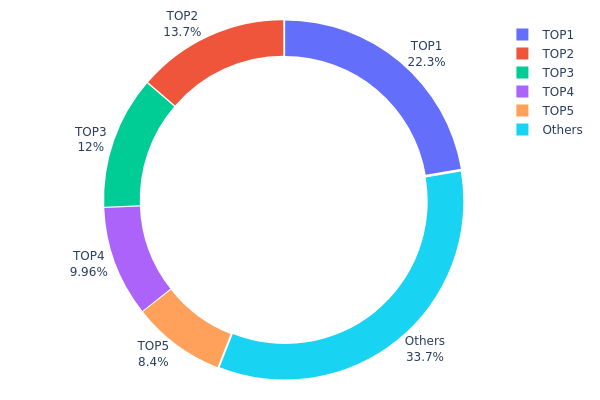
The holding distribution chart reveals the concentration of L3 tokens across different wallet addresses, providing crucial insights into the token's decentralization level and potential market dynamics. Based on current data, the top 5 addresses collectively hold 66.32% of the total L3 supply, indicating a relatively high concentration level that warrants careful examination.
The largest holder controls 22.32% of the circulating supply, while the second and third positions account for 13.70% and 11.95% respectively. This concentrated structure suggests that L3's distribution remains in its early stages, with significant portions held by potentially strategic investors, project teams, or institutional stakeholders. The remaining 33.68% distributed among other addresses demonstrates limited widespread adoption at the retail level.
This concentration pattern presents both opportunities and risks. On one hand, major holders typically represent committed long-term stakeholders with vested interests in the project's success. On the other hand, such distribution creates vulnerability to large-scale liquidations that could trigger substantial price volatility. The current structure indicates that L3's market remains susceptible to whale movements, and any coordinated selling from top addresses could significantly impact price stability and market sentiment.
Click to view current L3 holding distribution
| Top |
Address |
Holding Qty |
Holding (%) |
| 1 |
0x2ea1...643f59 |
744313.20K |
22.32% |
| 2 |
0x8e02...7f7d10 |
456846.34K |
13.70% |
| 3 |
0xb0ae...34b935 |
398477.52K |
11.95% |
| 4 |
0x49b7...3c6435 |
332013.23K |
9.96% |
| 5 |
0x1dab...b720e3 |
279866.98K |
8.39% |
| - |
Others |
1121816.06K |
33.68% |
II. Core Factors Affecting L3's Future Price
Based on the available information, there is currently insufficient data to provide a comprehensive analysis of the core factors affecting L3's future price. The reference materials do not contain specific information regarding L3's supply mechanisms, institutional dynamics, macroeconomic environment impact, or technical development details.
For accurate price analysis and predictions, more detailed information about L3's tokenomics, adoption metrics, technical roadmap, and market positioning would be required.
III. 2026-2031 L3 Price Prediction
2026 Outlook
- Conservative Prediction: $0.01098 - $0.01248
- Neutral Prediction: Around $0.01248
- Optimistic Prediction: Up to $0.01335 (requires favorable market conditions and increased adoption)
2027-2029 Outlook
- Market Phase Expectation: The token may experience gradual consolidation in 2027, followed by moderate growth momentum entering 2028-2029 as the broader crypto market matures
- Price Range Prediction:
- 2027: $0.00956 - $0.0133 (approximately 3% change from previous year)
- 2028: $0.01141 - $0.01888 (approximately 4% growth trajectory)
- 2029: $0.01296 - $0.02015 (potential 27% increase reflecting market recovery)
- Key Catalysts: Ecosystem development progress, potential partnerships expansion, and overall cryptocurrency market sentiment improvement
2030-2031 Long-term Outlook
- Base Scenario: $0.01066 - $0.02440 in 2030 (assuming steady platform growth and moderate market conditions)
- Optimistic Scenario: $0.01911 - $0.02251 by 2031 (assuming successful technology implementations and increased user adoption, representing approximately 69% cumulative growth)
- Transformative Scenario: Prices could potentially reach upper ranges if significant breakthroughs in Layer 3 scaling solutions occur alongside widespread institutional adoption
- 2026-01-24: L3 trading within the predicted range of $0.01098 - $0.01335 (current market positioning reflects early-stage valuation)
| Year |
Predicted High Price |
Predicted Average Price |
Predicted Low Price |
Price Change |
| 2026 |
0.01335 |
0.01248 |
0.01098 |
0 |
| 2027 |
0.0133 |
0.01292 |
0.00956 |
3 |
| 2028 |
0.01888 |
0.01311 |
0.01141 |
4 |
| 2029 |
0.02015 |
0.01599 |
0.01296 |
27 |
| 2030 |
0.0244 |
0.01807 |
0.01066 |
44 |
| 2031 |
0.02251 |
0.02124 |
0.01911 |
69 |
IV. L3 Professional Investment Strategy and Risk Management
L3 Investment Methodology
(I) Long-term Holding Strategy
- Suitable for: Investors seeking exposure to decentralized identity and attention economy protocols with a multi-year horizon
- Operational Recommendations:
- Consider accumulating positions during periods of lower volatility, given the token's historical price range between $0.01026 and $0.16087
- Monitor Layer3's ecosystem development and user adoption metrics as indicators of long-term value
- Implement a secure storage solution such as Gate Web3 Wallet for non-custodial asset management
(II) Active Trading Strategy
- Technical Analysis Tools:
- Moving Averages: Track short-term (7-day) and medium-term (30-day) trends; recent data shows -30.76% weekly decline versus +15.29% monthly gain, indicating potential reversal zones
- Volume Analysis: Monitor the 24-hour trading volume of approximately $90,394 to identify accumulation or distribution phases
- Swing Trading Considerations:
- Establish entry zones near recent support levels around $0.0122 (24-hour low)
- Set position sizes accounting for the token's demonstrated volatility, with price swings exceeding 30% over weekly periods
L3 Risk Management Framework
(I) Asset Allocation Principles
- Conservative Investors: 1-2% of crypto portfolio allocation
- Active Investors: 3-5% of crypto portfolio allocation
- Professional Investors: Up to 8% of crypto portfolio allocation, with hedging strategies
(II) Risk Hedging Solutions
- Portfolio Diversification: Balance L3 holdings with established layer-1 assets and stablecoins to mitigate sector-specific risks
- Position Scaling: Implement dollar-cost averaging during accumulation phases to reduce timing risk
(III) Secure Storage Solutions
- Non-custodial Wallet Recommendation: Gate Web3 Wallet provides secure storage for ERC-20 tokens like L3
- Hardware Wallet Option: Transfer significant holdings to cold storage solutions for enhanced security
- Security Precautions: Verify the official contract address (0x88909d489678dd17aa6d9609f89b0419bf78fd9a on Ethereum) before any transaction; enable two-factor authentication on all exchange accounts; never share private keys or seed phrases
V. L3 Potential Risks and Challenges
L3 Market Risks
- High Volatility: The token has experienced substantial price fluctuations, declining 88.42% from its historical high of $0.16087 in March 2025 to current levels around $0.01248
- Limited Liquidity: With a market capitalization of approximately $14.85 million and circulating supply of 1.19 billion tokens (35.7% of total supply), liquidity constraints may amplify price movements
- Market Capitalization Concentration: Representing only 0.0013% of the total crypto market, L3 faces challenges in attracting sustained institutional interest
L3 Regulatory Risks
- Identity Protocol Scrutiny: Decentralized identity solutions may face regulatory examination regarding data privacy and compliance with KYC/AML frameworks
- Token Classification Uncertainty: Evolving regulatory standards for utility tokens and attention-based reward mechanisms could impact L3's operational model
- Cross-chain Compliance: As an omnichain protocol, Layer3 may encounter varied regulatory requirements across different blockchain jurisdictions
L3 Technical Risks
- Smart Contract Vulnerabilities: ERC-20 token architecture and protocol integrations present potential attack surfaces requiring ongoing security audits
- Network Fragmentation: The protocol's success depends on addressing blockchain fragmentation, yet this challenge continues to intensify with new layer-1 and layer-2 launches
- Competitive Landscape: Numerous projects are developing attention economy and identity solutions, creating technological obsolescence risks if Layer3 fails to maintain innovation pace
VI. Conclusion and Action Recommendations
L3 Investment Value Assessment
Layer3 (L3) positions itself as infrastructure for decentralized identity and attention monetization in an increasingly fragmented blockchain ecosystem. The protocol's long-term value proposition centers on solving critical distribution challenges as new networks proliferate. However, short-term risks include substantial volatility (88.42% decline over the past year), limited liquidity with approximately $90,394 in daily trading volume, and intense competition in the identity solutions space. The current market cap to fully diluted valuation ratio of 35.7% suggests significant token supply inflation risks as the remaining 64.3% of tokens enter circulation.
L3 Investment Recommendations
✅ Beginners: Allocate no more than 1-2% of your crypto portfolio to L3; prioritize education on identity protocols and attention economy models before investing; use established platforms like Gate.com for initial exposure with small position sizes
✅ Experienced Investors: Consider L3 as a speculative allocation (3-5% of crypto portfolio) with awareness of volatility patterns; implement technical analysis to identify optimal entry points near support zones; diversify across multiple infrastructure protocols to mitigate sector-specific risks
✅ Institutional Investors: Conduct thorough due diligence on Layer3's technological differentiation and partnership ecosystem; evaluate token unlocking schedules given the 35.7% circulating supply ratio; consider strategic positions sized according to risk tolerance with appropriate hedging mechanisms
L3 Trading Participation Methods
- Spot Trading: Purchase L3 tokens directly on Gate.com and other exchanges supporting the ERC-20 token; suitable for investors seeking direct exposure without leverage
- Custody Solutions: Transfer holdings to Gate Web3 Wallet for non-custodial storage, ensuring control of private keys while maintaining accessibility for trading
- Portfolio Integration: Incorporate L3 as part of a diversified infrastructure token strategy, balancing exposure across identity, interoperability, and layer-2 scaling solutions
Cryptocurrency investments carry extreme risk, and this article does not constitute investment advice. Investors should make prudent decisions based on their individual risk tolerance and are advised to consult professional financial advisors. Never invest more than you can afford to lose.
FAQ
What is L3 (Layer 3 scaling)? How does it differ from L1 and L2?
L3 is a third-layer scaling solution built on L2 chains, offering even faster transactions and lower fees. L1 is the base blockchain, L2 reduces congestion via rollups or sidechains, and L3 provides additional optimization for specific applications, enabling ultra-high throughput with minimal costs.
What factors affect L3 project token prices?
L3 token prices are influenced by network adoption rates, transaction volume, developer activity, ecosystem partnerships, market sentiment, Bitcoin correlation, and overall crypto market conditions. Strong adoption and growth metrics typically drive price appreciation.
What are the main L3 projects or solutions currently available?
Major L3 solutions include Arbitrum Orbit, Optimism Stack, Polygon CDK, and StarkNet. These platforms enable scalable dApps with enhanced throughput and lower costs while maintaining security through their parent chains.
What are the investment advantages and risks of L3 tokens compared to L2 tokens?
L3 tokens offer higher growth potential through enhanced scalability and lower transaction costs. Advantages include faster innovation cycles and expanded ecosystem adoption. Risks include lower liquidity, higher volatility, and less proven security infrastructure compared to established L2 solutions.
How to analyze and predict the long-term value of L3 projects?
Analyze L3 projects by examining technical architecture, ecosystem development, transaction volume, developer activity, and adoption metrics. Evaluate tokenomics, governance, and competitive positioning. Monitor network growth trends and partnerships to forecast long-term value potential.
How is the adoption rate and market size growth expected for L3 technology?
L3 scaling solutions are projected to achieve significant adoption with market size expanding to billions by 2026. Enterprise integration and cross-chain interoperability drive growth. Trading volume on L3s expected to surge as users seek lower fees and faster transactions.
How significantly does L3 ecosystem development impact its token price?
L3 ecosystem growth directly drives token demand. Strong developer adoption, increased transaction volume, and expanding DeFi applications create fundamental value. As the ecosystem matures and TVL grows, token price typically appreciates substantially, especially during major infrastructure upgrades and protocol innovations.
* The information is not intended to be and does not constitute financial advice or any other recommendation of any sort offered or endorsed by Gate.