This comprehensive analysis examines LightLink (LL), an Ethereum Layer 2 blockchain solution, providing expert price predictions and investment strategies for 2026-2031. Currently trading at $0.004293 with an $1.79 million market cap on Gate, LL has experienced significant volatility since its April 2024 launch at $0.3. The article evaluates core price drivers including macroeconomic conditions, enterprise adoption potential, and Layer 2 ecosystem development, projecting LL could reach $0.00632 by 2029 under favorable conditions. Professional investment strategies address different investor profiles with risk management frameworks and secure storage solutions on Gate Web3 Wallet. Critical considerations include extreme market concentration (66.55% held by top two addresses), minimal trading volume ($21,184 daily), and regulatory uncertainties surrounding Layer 2 solutions. Suitable for investors with high risk tolerance seeking exposure to emerging blockchain infrastructure.
Introduction: LL's Market Position and Investment Value
LightLink (LL), positioned as an Ethereum Layer 2 blockchain solution providing instant, gasless transactions for dApps and enterprise users, has been developing blockchain solutions since 2017. As of 2026, LL has a market capitalization of approximately $1.79 million, with a circulating supply of about 417.88 million tokens, and the price maintains around $0.004293. This asset, characterized as an enterprise-focused Layer 2 infrastructure, is playing an increasingly important role in bridging decentralized applications with enterprise-level users and fostering interconnected economies.
This article will comprehensively analyze LL's price trends from 2026 to 2031, combining historical patterns, market supply and demand dynamics, ecosystem development, and macroeconomic environments to provide investors with professional price forecasts and practical investment strategies.
I. LL Price History Review and Current Market Status
LL Historical Price Evolution Trajectory
-
2024: LightLink (LL) launched on Gate.com in April 2024 at a price of $0.3, marking the token's initial entry into the cryptocurrency market. Following its launch, the price experienced significant volatility as the project established its presence in the Ethereum Layer 2 ecosystem.
-
2024-2025: The token underwent substantial market correction, with price declining from the launch level as the broader cryptocurrency market faced challenges and investor sentiment shifted. The price movement reflected typical post-launch adjustment patterns common in emerging blockchain projects.
-
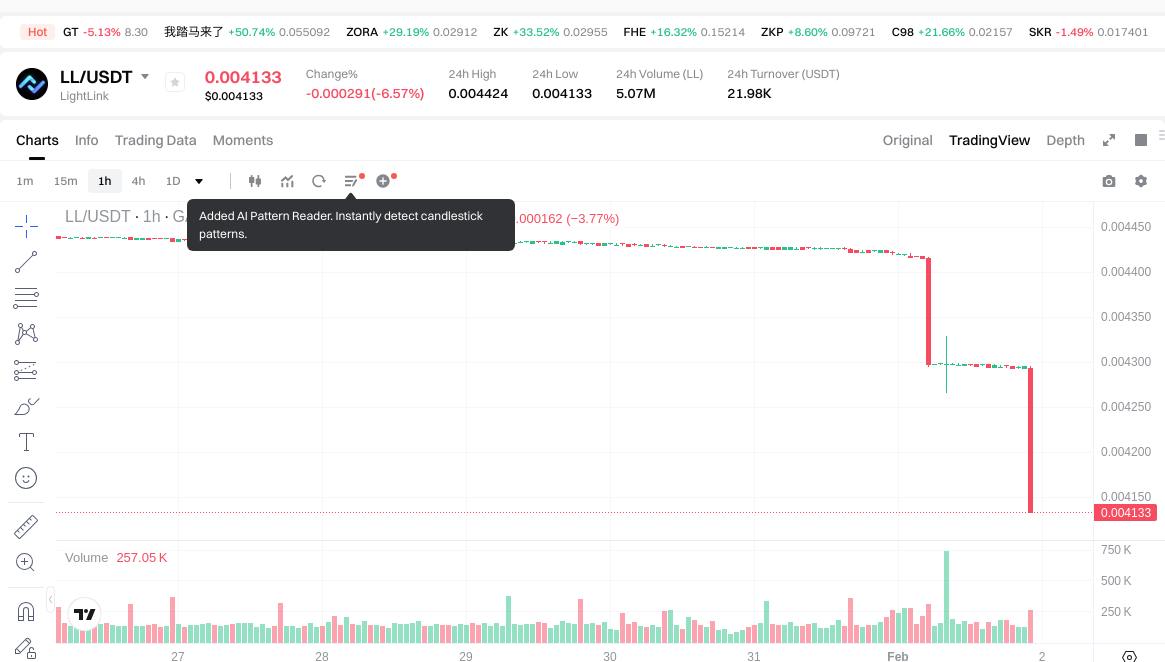
2026: As of February 1, 2026, LL recorded a low of $0.004133, representing a considerable decline from its initial trading price. This period reflects ongoing market consolidation and adjustment in the Layer 2 blockchain sector.
LL Current Market Status
As of February 1, 2026, LightLink (LL) is trading at $0.004293, with a 24-hour trading volume of approximately $21,184. The token has experienced a decline of 2.91% over the past 24 hours, with the price range fluctuating between $0.004265 and $0.004424.
Over different time periods, LL has shown varied performance: a marginal increase of 0.05% in the past hour, a decline of 3.29% over the past week, and a significant decrease of 40.55% over the past 30 days. The one-year performance indicates a decline of 84.59% from previous levels.
The token's market capitalization stands at approximately $1.79 million, with a circulating supply of 417,882,774.68 LL tokens, representing 41.79% of the total supply of 1 billion tokens. The fully diluted market capitalization is calculated at $4.29 million. The market capitalization to fully diluted valuation ratio stands at 41.79%, indicating a substantial portion of tokens already in circulation.
LL holds the #2119 position in cryptocurrency rankings, with a market dominance of 0.00015%. The token is held by approximately 4,937 addresses, deployed as an ERC20 token on the Ethereum blockchain. Currently, LL is available for trading on 2 exchanges, with Gate.com being a major trading platform.
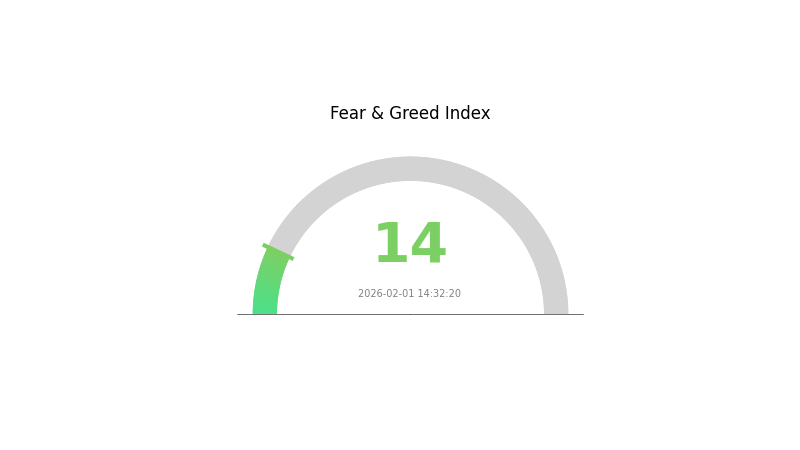
The cryptocurrency market sentiment index currently shows a reading of 14, indicating an "Extreme Fear" environment, which may be influencing trading activity and price movements across the broader market including LL.
Click to view current LL market price
LL Market Sentiment Index
2026-02-01 Fear and Greed Index: 14 (Extreme Fear)
Click to view current Fear & Greed Index
The cryptocurrency market is currently experiencing extreme fear with the Fear and Greed Index at 14. This exceptionally low reading indicates severe market pessimism and heightened risk aversion among investors. During such extreme fear periods, market participants often panic sell, creating potential opportunities for contrarian investors. However, caution is advised as further downside cannot be ruled out. Monitor market developments closely and consider your risk tolerance before making investment decisions on Gate.com.
LL Token Holder Distribution
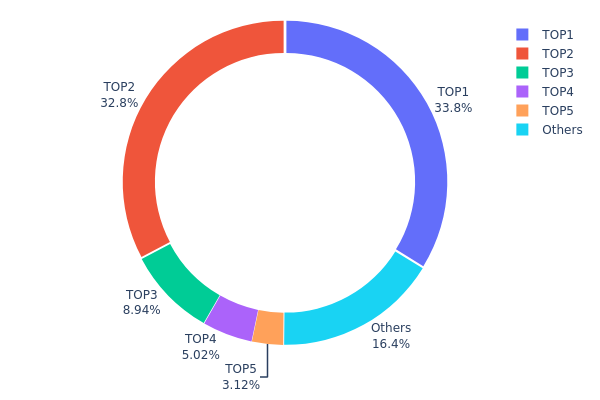
The token holder distribution chart illustrates how LL tokens are allocated across different wallet addresses, revealing the degree of concentration or decentralization within the token's ownership structure. By analyzing this metric, we can assess potential risks related to market manipulation, liquidity constraints, and overall ecosystem health.
Based on the current data as of February 1, 2026, LL exhibits a notably high concentration pattern. The top two addresses collectively control 66.55% of the total token supply, with the largest holder possessing 33.79% (337.96M tokens) and the second-largest holding 32.76% (327.60M tokens). The third address holds 8.94%, while the fourth and fifth positions account for 5.01% and 3.11% respectively. The remaining distribution, categorized as "Others," represents only 16.39% of the total supply spread across multiple smaller addresses.
This concentration structure presents several implications for market dynamics. The dominant positions held by the top two addresses suggest potential vulnerability to significant price volatility if either entity decides to liquidate portions of their holdings. Such concentrated ownership could also facilitate coordinated market manipulation or create liquidity challenges during periods of high trading activity. However, it's worth noting that these large positions might belong to project treasury wallets, liquidity pools, or institutional partnerships rather than individual speculative holders. From a decentralization perspective, the current distribution indicates limited token democratization, with over two-thirds of the supply controlled by just two entities. This raises questions about governance centralization and the project's resilience against single points of failure in its on-chain architecture.
Click to view the current LL Token Holder Distribution
| Top |
Address |
Holding Qty |
Holding (%) |
| 1 |
0x6310...121ee9 |
337964.36K |
33.79% |
| 2 |
0x8c6e...80ca8e |
327601.76K |
32.76% |
| 3 |
0x2da1...82872e |
89403.72K |
8.94% |
| 4 |
0xf89d...5eaa40 |
50197.53K |
5.01% |
| 5 |
0x58ed...a36a51 |
31183.57K |
3.11% |
| - |
Others |
163649.06K |
16.39% |
II. Core Factors Influencing LL's Future Price
Macroeconomic Environment
-
Monetary Policy Impact: Global interest rate trends significantly affect investment strategies in real estate and related assets. Central banks' policy adjustments, particularly in developed markets, influence capital allocation decisions. The current environment shows long-term government bond yields stabilizing after significant increases, with expectations of gradual rate reductions in major economies. This creates a complex backdrop where the balance between rate cuts and persistent inflation concerns may impact asset valuations.
-
Economic Growth Patterns: Global economic conditions, including the transition from previous growth cycles, shape investor confidence and capital flows. Structural changes are accelerating, leading to increased volatility and shorter business cycles. The environment is characterized by demographic shifts, including aging populations and shrinking labor forces, which may result in weaker aggregate demand over the long term.
-
Market Competition and Transparency: Higher market transparency and institutional maturity have intensified competition, reducing opportunities for excess profits. Capital markets have grown larger and more sophisticated, leading to more stable institutional allocations while new capital inflows become increasingly scarce. This competitive landscape requires investors to adopt more proactive strategies to achieve desired returns.
Investment Environment Factors
-
Capital Value Dynamics: Asset price movements depend on two primary drivers: yield compression and rental growth. However, both factors face constraints in the current cycle. Real estate yields move in sync with long-term government bond yields plus risk premiums. With bond yields reaching or approaching expected stable levels and risk premiums at extremely low levels, the space for further yield compression remains quite limited during the recovery phase.
-
Tenant Demand Evolution: Tenant requirements have become more complex and diversified. Occupiers demand greater flexibility in both building usage and lease agreements, reflecting changing workplace dynamics and business models. This shift in tenant behavior creates additional considerations for property valuations and investment strategies.
Policy and Geopolitical Considerations
-
Regulatory Environment: Policy changes and regulatory frameworks continue to shape market conditions. Potential shifts in fiscal policies, including tax structures and deregulation initiatives in certain markets, may influence corporate fundamentals and investment attractiveness.
-
Geopolitical Uncertainty: International relations and trade dynamics introduce additional layers of complexity. Emerging market economies face particular exposure to policy spillovers from developed markets, especially regarding trade policies and protectionist measures. These factors contribute to increased uncertainty in capital flows and asset allocation decisions across different geographic regions.
III. 2026-2031 LL Price Prediction
2026 Outlook
- Conservative Prediction: $0.0024 - $0.00413
- Neutral Prediction: Around $0.00413
- Optimistic Prediction: Up to $0.00529 (requires favorable market conditions and increased adoption)
2027-2029 Outlook
- Market Stage Expectation: Gradual growth phase with moderate volatility, as the project continues to develop its ecosystem and expand user base
- Price Range Predictions:
- 2027: $0.00302 - $0.00509 (approximately 14% increase from 2026)
- 2028: $0.00392 - $0.00564 (approximately 18% increase from 2026)
- 2029: $0.00279 - $0.00632 (approximately 27% increase from 2026)
- Key Catalysts: Potential technological upgrades, strategic partnerships, broader market adoption, and overall cryptocurrency market sentiment
2030-2031 Long-term Outlook
- Base Scenario: $0.00394 - $0.00603 (assuming steady project development and stable market conditions)
- Optimistic Scenario: $0.00579 - $0.00621 (assuming accelerated adoption and positive regulatory environment)
- Transformative Scenario: Potential to reach $0.00632 by 2029 (under extremely favorable conditions including major ecosystem breakthroughs and institutional adoption)
- 2026-02-01: LL trading within the predicted range of $0.0024 - $0.00529 (early stage of long-term growth trajectory)
| Year |
Predicted High Price |
Predicted Average Price |
Predicted Low Price |
Price Change |
| 2026 |
0.00529 |
0.00413 |
0.0024 |
0 |
| 2027 |
0.00509 |
0.00471 |
0.00302 |
14 |
| 2028 |
0.00564 |
0.0049 |
0.00392 |
18 |
| 2029 |
0.00632 |
0.00527 |
0.00279 |
27 |
| 2030 |
0.00603 |
0.00579 |
0.00394 |
40 |
| 2031 |
0.00621 |
0.00591 |
0.0039 |
43 |
IV. LL Professional Investment Strategy and Risk Management
LL Investment Methodology
(1) Long-term Holding Strategy
- Suitable for: Investors seeking exposure to Ethereum Layer 2 infrastructure with high risk tolerance
- Operational Recommendations:
- Consider dollar-cost averaging over 6-12 months to mitigate entry timing risk
- Monitor LightLink's enterprise partnership announcements and transaction volume growth
- Utilize Gate Web3 Wallet for secure storage with multi-signature protection
(2) Active Trading Strategy
- Technical Analysis Tools:
- Moving Averages: Track 50-day and 200-day moving averages to identify trend reversals; LL's current downtrend suggests cautious positioning
- Volume Analysis: Monitor the current $21,183 daily trading volume for liquidity assessment before large positions
- Swing Trading Considerations:
- Set stop-loss orders 8-10% below entry points given LL's high volatility (84.59% decline over one year)
- Consider the narrow trading range between $0.004265 and $0.004424 for short-term position sizing
LL Risk Management Framework
(1) Asset Allocation Principles
- Conservative Investors: 0.5-1% of crypto portfolio
- Aggressive Investors: 2-5% of crypto portfolio
- Professional Investors: Up to 10% with active hedging strategies
(2) Risk Hedging Solutions
- Portfolio Diversification: Balance LL exposure with established Layer 2 tokens and ETH
- Position Sizing: Limit initial allocation given the token's 41.79% circulating supply and potential dilution risk
(3) Secure Storage Solutions
- Hot Wallet Recommendation: Gate Web3 Wallet for active trading positions with multi-factor authentication
- Cold Storage Protocol: Transfer long-term holdings to hardware wallets, maintaining only trading positions on exchanges
- Security Precautions: Verify the official contract address (0x0921799cb1d702148131024d18fcde022129dc73) before any transactions; enable withdrawal whitelisting
V. LL Potential Risks and Challenges
LL Market Risks
- Severe Price Depreciation: LL has declined 84.59% from its launch price of $0.3 to current levels, reflecting significant market skepticism
- Liquidity Constraints: With only $21,183 in 24-hour trading volume and listings on 2 exchanges, large orders may experience substantial slippage
- Market Capitalization Vulnerability: The $1.79 million market cap represents 0.00015% market dominance, exposing the token to extreme volatility
LL Regulatory Risks
- Enterprise Partnership Compliance: LightLink's focus on enterprise blockchain solutions may face evolving corporate blockchain regulations
- Layer 2 Regulatory Uncertainty: Regulatory frameworks for Layer 2 scaling solutions remain undefined in major jurisdictions
- Cross-border Transaction Scrutiny: The gasless transaction model may attract regulatory attention regarding transaction monitoring requirements
LL Technical Risks
- Smart Contract Vulnerabilities: As an ERC-20 token on Ethereum, LL inherits potential smart contract risks despite audit measures
- Layer 2 Bridge Security: The proprietary Layer 2 stack introduces unique attack vectors not present in more established solutions
- Scalability Unproven at Scale: While claiming instant transactions, real-world performance under high enterprise load remains untested publicly
VI. Conclusion and Action Recommendations
LL Investment Value Assessment
LightLink presents a high-risk, early-stage investment in Ethereum Layer 2 infrastructure. The project's value proposition centers on gasless transactions for enterprise adoption, yet the 84.59% price decline since launch and minimal trading volume ($21,183 daily) reflect substantial market challenges. With only 4,937 token holders and 41.79% circulating supply, potential dilution risk exists. The $0.004133 all-time low recorded on February 1, 2026, suggests the token is testing critical support levels. Long-term value depends on successful enterprise integration and transaction volume growth, neither of which is currently evident in market data.
LL Investment Recommendations
✅ Beginners: Avoid allocation until project demonstrates sustained enterprise adoption and increased liquidity; if considering exposure, limit to less than 0.5% of total crypto portfolio
✅ Experienced Investors: Consider speculative positions of 1-2% with strict stop-loss orders at 10% below entry; monitor enterprise partnership announcements for catalyst-driven trading
✅ Institutional Investors: Conduct thorough due diligence on LightLink's proprietary Layer 2 technology and enterprise client pipeline before considering strategic allocation; current market conditions suggest waiting for volume stabilization
LL Trading Participation Methods
- Spot Trading on Gate.com: Access LL trading pairs with professional charting tools and limit order functionality
- Dollar-Cost Averaging: Establish recurring small purchases to mitigate timing risk given high volatility
- Portfolio Tracking: Utilize Gate.com's portfolio management tools to monitor LL performance against broader Layer 2 sector benchmarks
Cryptocurrency investments carry extreme risk. This analysis does not constitute investment advice. Investors should make cautious decisions based on their own risk tolerance and consult professional financial advisors. Never invest more than you can afford to lose.
FAQ
What is LL token? What are its uses and value?
LL token is a decentralized digital asset enabling peer-to-peer transactions with high efficiency and low costs. It operates via proof-of-stake consensus mechanism, providing secure global value transfer. LL's value lies in transaction efficiency, cost-effectiveness, and network utility.
How to analyze and predict LL price trends?
LL price is driven by supply-demand dynamics, ecosystem development, and macroeconomic factors. Technical analysis of trading volume, market sentiment, and on-chain metrics provides key insights. Experts project significant LL appreciation potential ahead.
What are the risks to pay attention to when investing in LL?
LL investment carries market volatility risk. Manage position sizing carefully, avoid over-leveraging, and diversify your portfolio. New investors should proceed cautiously and never invest more than you can afford to lose.
LL price prediction requires focus on which key indicators and market factors?
Key indicators include market sentiment, transaction volume, technical breakthroughs, and adoption rates. Investor confidence and market trends directly impact LL price movements. Monitor on-chain metrics, community activity, and macroeconomic factors for comprehensive analysis.
What are the advantages and disadvantages of LL compared to similar tokens?
LL's main advantages are high transaction speed, flexible market mechanics, and strong community support. Disadvantages include high volatility, regulatory uncertainty, and limited institutional adoption compared to established alternatives.
* The information is not intended to be and does not constitute financial advice or any other recommendation of any sort offered or endorsed by Gate.