This comprehensive guide analyzes MANEKI's price trajectory from 2026 to 2031, providing investors with data-driven forecasts and actionable strategies. MANEKI, a Solana-native meme coin inspired by the Japanese beckoning cat symbol, currently trades at $0.00041 with a $3.63 million market cap. The article reviews MANEKI's historical performance, from its $0.014 launch price to the all-time high of $0.028, examining current market sentiment and holder distribution. Expert analysis reveals 2026-2031 price forecasts ranging from $0.00025 to $0.00102, driven by ecosystem development and macroeconomic conditions. The guide outlines tailored investment strategies for beginners through institutional investors, emphasizing risk management through position sizing and stop-loss implementation. On Gate exchange, investors can access spot trading and limit orders. Key considerations include meme coin volatility, liquidity constraints with $27,290 daily volume, and centralization risks with 44.16% held by top address. Lo
Introduction: MANEKI's Market Position and Investment Value
MANEKI (MANEKI), as Solana's native cat coin inspired by the famous Japanese beckoning cat symbol, has been capturing attention in the crypto market since its launch in 2024. As of 2026, MANEKI maintains a market capitalization of approximately $3.63 million, with a circulating supply of about 8.86 billion tokens, and the price hovering around $0.00041. This asset, often referred to as the "Lucky Cat Token," represents good fortune, success, prosperity, wisdom and leadership within the Solana ecosystem.
This article will comprehensively analyze MANEKI's price trajectory from 2026 to 2031, combining historical patterns, market supply and demand dynamics, ecosystem development, and macroeconomic conditions to provide investors with professional price forecasts and practical investment strategies.
I. MANEKI Price History Review and Market Status
MANEKI Historical Price Evolution Trajectory
- April 2024: MANEKI launched on Gate.com at a publication price of $0.014, experiencing significant growth as the Solana native cat coin gained initial traction in the market.
- April 25, 2024: The token reached its all-time high of $0.028, representing a 100% increase from its launch price, driven by strong community interest in the Japanese beckoning cat concept.
- January 29, 2026: MANEKI recorded its all-time low of $0.0003333, reflecting broader market corrections and declining momentum in the meme coin sector.
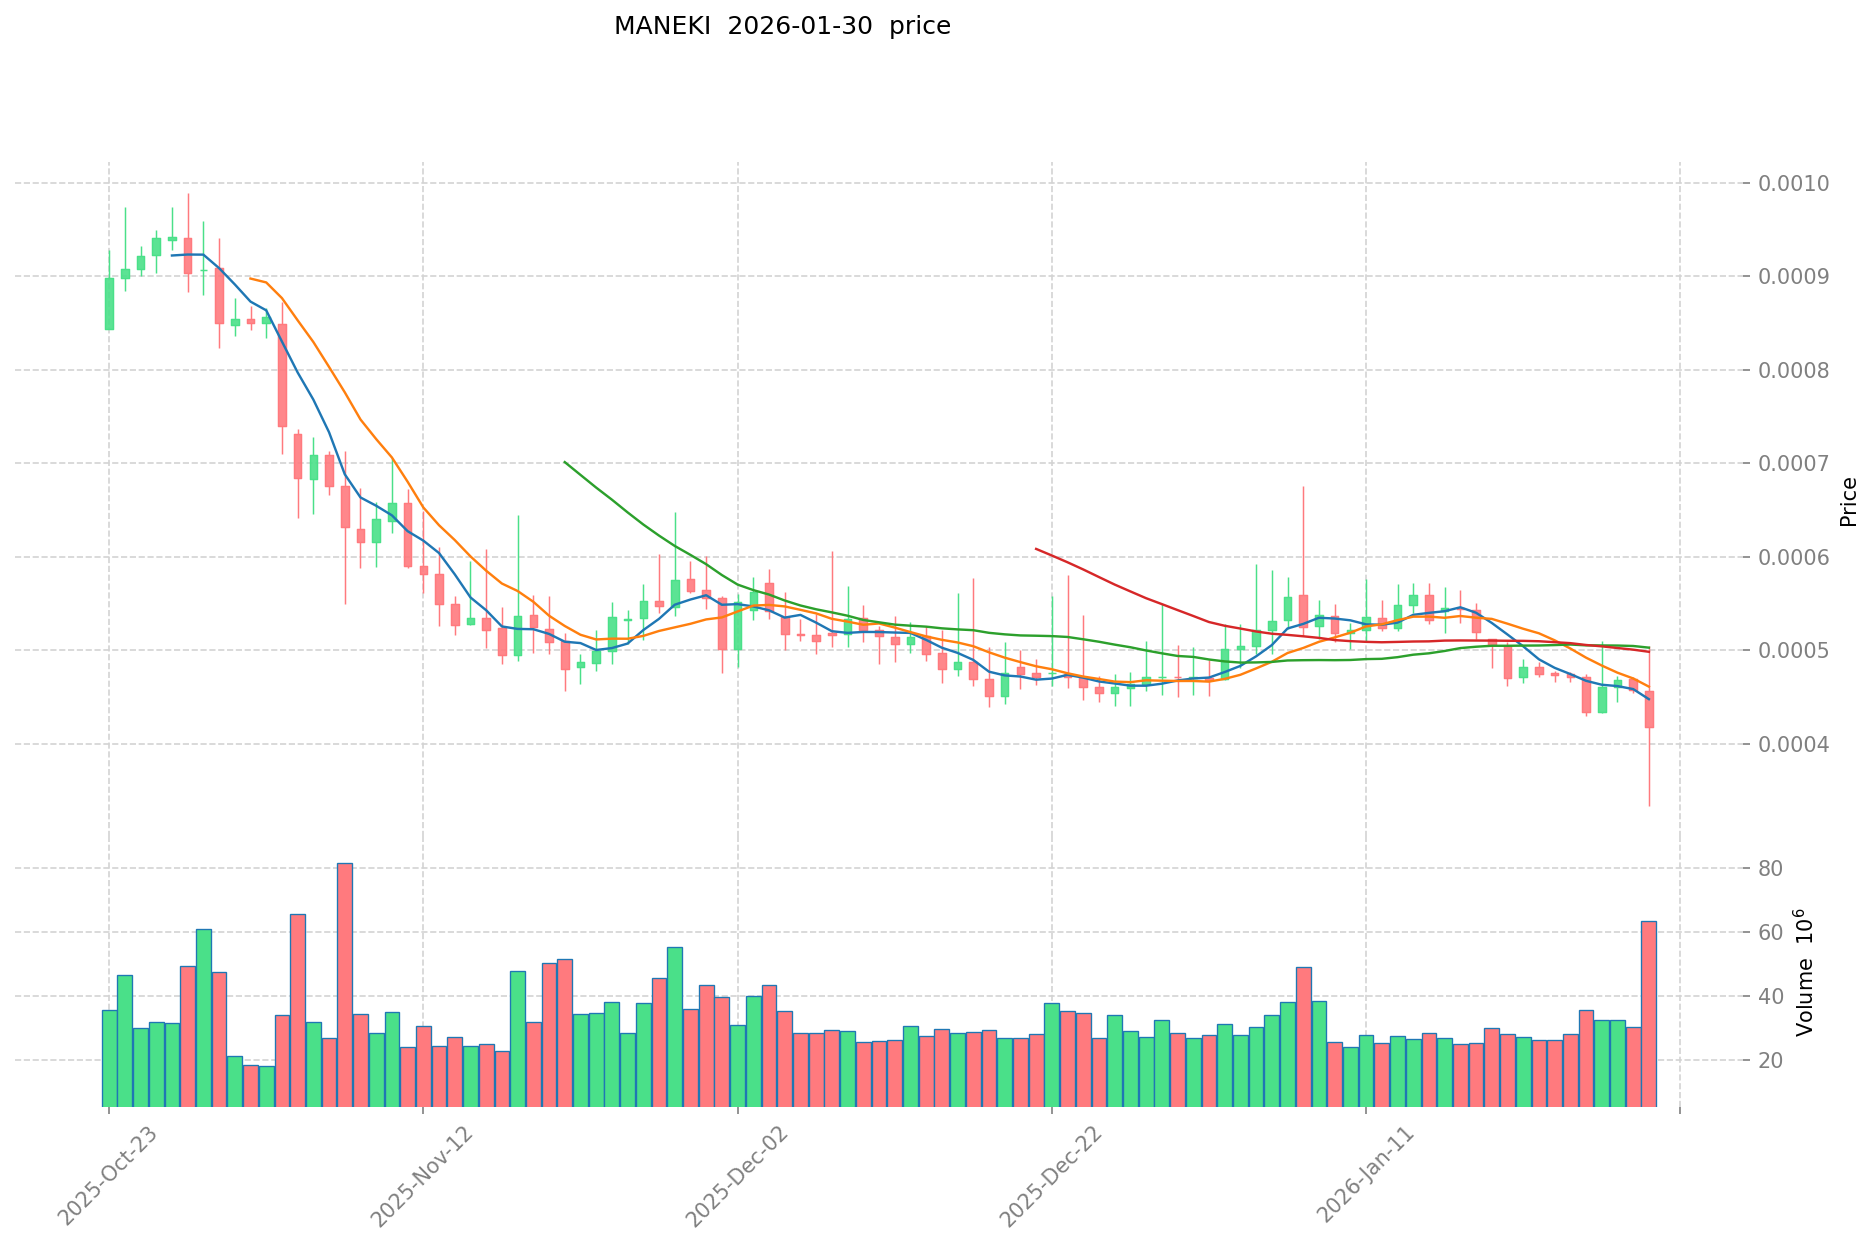
MANEKI Current Market Situation
As of January 30, 2026, MANEKI is trading at $0.00041, showing notable price volatility across multiple timeframes. The token has experienced a 2.45% decline over the past hour and a 10.28% decrease in the last 24 hours. Within the 24-hour period, the price fluctuated between a high of $0.0005043 and a low of $0.0003333.
The 7-day performance indicates a 13.51% decline, while the 30-day trend shows a 14% decrease. Over the past year, MANEKI has recorded an 87.28% decline from previous levels, reflecting substantial price compression from its earlier peaks.
MANEKI currently holds a market capitalization of approximately $3.63 million, with a circulating supply of 8.86 billion tokens representing 99.66% of the maximum supply of 8.89 billion tokens. The fully diluted market cap stands at $3.64 million, closely aligned with the current market capitalization due to the high circulation ratio. The token maintains a 24-hour trading volume of $27,290.
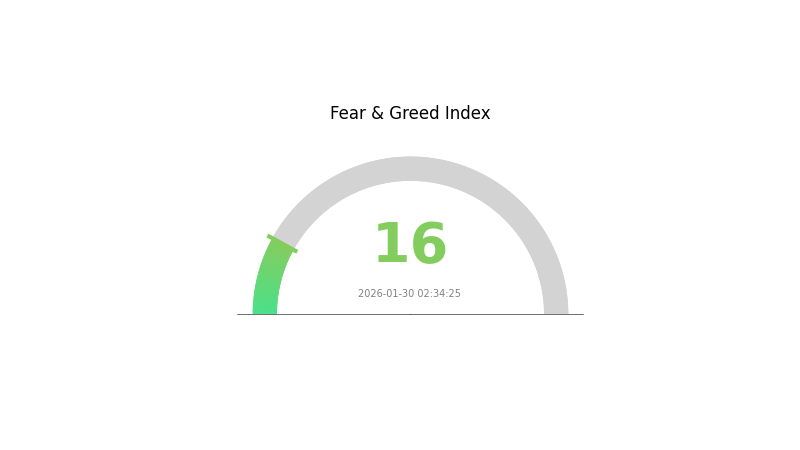
According to market indicators, the current sentiment index stands at 16, suggesting heightened caution among market participants. MANEKI ranks at position 1702 in the cryptocurrency market, with a market dominance of 0.00012%. The token has attracted a holder base of 63,835 addresses, indicating moderate community participation.
Click to view current MANEKI market price
MANEKI Market Sentiment Index
2026-01-30 Fear & Greed Index: 16 (Extreme Fear)
Click to view current Fear & Greed Index
The cryptocurrency market is currently experiencing extreme fear, with the Fear & Greed Index dropping to 16. This exceptionally low reading suggests significant market pessimism and heightened risk aversion among investors. When fear reaches such extreme levels, it often presents contrarian opportunities for long-term investors. Market participants should exercise caution while monitoring potential entry points. Such sentiment extremes typically precede market stabilization or recovery phases. Stay informed with real-time market data on Gate.com to make informed investment decisions during this volatile period.
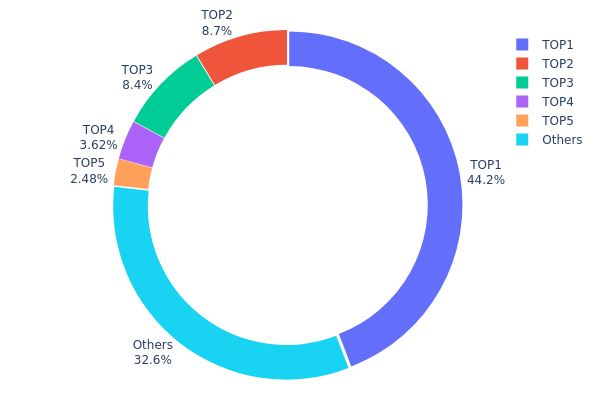
MANEKI Holdings Distribution
The holdings distribution chart visualizes how MANEKI tokens are allocated across different wallet addresses, providing crucial insights into the token's decentralization level and potential market manipulation risks. This metric reveals the concentration of tokens among top holders versus the broader community, serving as a key indicator of market structure health and stability.
According to the current data, MANEKI exhibits a notably concentrated holdings pattern. The top address alone controls 3,912,280.67K tokens, representing 44.16% of the total supply - a substantial concentration that indicates significant centralization risk. The top five addresses collectively hold approximately 67.34% of the total supply, with the second and third largest holders controlling 8.70% and 8.39% respectively. Meanwhile, all remaining addresses combined account for only 32.66% of the distribution, suggesting limited token dispersion across the broader community.
This high concentration level presents several implications for market dynamics. The dominant position of the largest holder creates potential price volatility risks, as large-scale sell-offs could trigger significant market movements. Additionally, such centralized control may facilitate price manipulation and reduce market efficiency. From a decentralization perspective, this distribution pattern suggests that MANEKI's on-chain governance and value distribution remain heavily influenced by a small number of entities, which could impact long-term ecosystem sustainability and community trust.
Click to view current MANEKI Holdings Distribution
| Top |
Address |
Holding Qty |
Holding (%) |
| 1 |
5Q544f...pge4j1 |
3912280.67K |
44.16% |
| 2 |
6FEVkH...8f51Jy |
771136.01K |
8.70% |
| 3 |
22Wnk8...h7zkBa |
743896.89K |
8.39% |
| 4 |
ASTyfS...g7iaJZ |
321082.35K |
3.62% |
| 5 |
u6PJ8D...ynXq2w |
219334.01K |
2.47% |
| - |
Others |
2890813.82K |
32.66% |
II. Core Factors Influencing MANEKI's Future Price
Supply Mechanism
The provided materials do not contain specific information about MANEKI's supply mechanism, historical supply patterns, or current supply-related changes. Investors should monitor official project announcements for any tokenomics updates that may impact price dynamics.
Institutional and Whale Activity
According to the materials, Maneki AI ($MANEKI) is positioned as a DeFi strategy AI assistant that demonstrated notable growth from its presale low point, achieving approximately 10x returns. The project was featured on ChainGPT Pad, a launchpad platform focused on AI-driven Web3 initiatives. However, specific details regarding institutional holdings, corporate adoption patterns, or government-level policies directly related to MANEKI were not available in the source materials.
Macroeconomic Environment
-
Monetary Policy Impact: The overall cryptocurrency market has shown sensitivity to central bank policy shifts. Recent Federal Reserve rate cuts have strengthened confidence among risk asset traders, potentially signaling the beginning of a loosening cycle. Such monetary policy adjustments tend to influence market liquidity and investor appetite for digital assets.
-
Inflation Hedging Attributes: The materials suggest that in inflationary environments, certain cryptocurrencies may exhibit digital gold-like characteristics, potentially serving as alternative stores of value. However, MANEKI's specific performance in such conditions requires further observation.
-
Geopolitical Factors: Geopolitical uncertainty remains a significant variable affecting cryptocurrency markets. Periods of heightened international tension may drive increased interest in decentralized assets, though the magnitude of impact varies across different tokens.
Technology Development and Ecosystem Building
MANEKI is identified as an AI-powered DeFi strategy assistant, positioning itself within the emerging DeAI (Decentralized AI) narrative. The project launched through ChainGPT Pad, which provides AI-focused projects with specialized technical support including smart contract audits and AI analytics. This platform's emphasis on AI-driven innovations suggests that MANEKI benefits from ecosystem-level infrastructure designed to support AI-enhanced blockchain applications.
The broader trend shows increased activity in AI-related cryptocurrency projects, with ChainGPT Pad conducting approximately 35 IDOs over the past six months, raising around $10.2 million collectively. While recent market conditions have cooled compared to earlier periods, occasional projects still achieve significant multiples, reflecting ongoing interest in the AI-crypto intersection.
Investors should note that comprehensive analysis requires monitoring multiple variables including overall economic trends, regulatory developments, market demand dynamics, and continued community engagement, as these factors collectively shape price trajectories in the cryptocurrency space.
III. 2026-2031 MANEKI Price Forecast
2026 Outlook
- Conservative forecast: $0.00025 - $0.00041
- Neutral forecast: $0.00041 average price level
- Optimistic forecast: $0.00049 (requires favorable market sentiment and increased trading volume)
2027-2029 Outlook
- Market stage expectation: Gradual growth phase with potential consolidation periods
- Price range forecast:
- 2027: $0.00035 - $0.00066
- 2028: $0.00044 - $0.00068
- 2029: $0.00046 - $0.00086
- Key catalysts: Market adoption expansion, community development progress, and broader cryptocurrency market trends
2030-2031 Long-term Outlook
- Baseline scenario: $0.00066 - $0.00097 (assuming stable market conditions and continued project development)
- Optimistic scenario: $0.00074 - $0.00102 (assuming enhanced utility adoption and favorable regulatory environment)
- Transformational scenario: Above $0.00102 (requires breakthrough partnerships, significant ecosystem expansion, and sustained bull market momentum)
- 2026-01-30: MANEKI trading near baseline levels (early forecast period with potential for gradual appreciation over the multi-year timeframe)
| Year |
Predicted High Price |
Predicted Average Price |
Predicted Low Price |
Price Change |
| 2026 |
0.00049 |
0.00041 |
0.00025 |
0 |
| 2027 |
0.00066 |
0.00045 |
0.00035 |
9 |
| 2028 |
0.00068 |
0.00055 |
0.00044 |
34 |
| 2029 |
0.00086 |
0.00061 |
0.00046 |
49 |
| 2030 |
0.00097 |
0.00074 |
0.00066 |
79 |
| 2031 |
0.00102 |
0.00085 |
0.0007 |
107 |
IV. MANEKI Professional Investment Strategy and Risk Management
MANEKI Investment Methodology
(1) Long-term Holding Strategy
- Suitable for: Investors with medium to high risk tolerance who believe in the cultural symbolism and community-driven growth of meme coins
- Operational recommendations:
- Consider accumulating positions during market corrections when the price approaches the historical low range
- Set clear profit-taking targets based on personal risk appetite, as meme coin volatility can be substantial
- Storage solution: Use Gate Web3 Wallet for secure self-custody with multi-chain support
(2) Active Trading Strategy
- Technical analysis tools:
- Volume analysis: Monitor 24-hour trading volume (currently around $27,290) for potential breakout signals
- Support and resistance levels: Track the 24-hour range between $0.0003333 and $0.0005043 for entry and exit points
- Swing trading considerations:
- Watch for volatility patterns during major Solana ecosystem developments
- Consider scaling out positions during short-term rallies given the -10.28% 24-hour decline trend
MANEKI Risk Management Framework
(1) Asset Allocation Principles
- Conservative investors: 1-2% of crypto portfolio allocation
- Aggressive investors: 3-5% of crypto portfolio allocation
- Professional investors: May allocate up to 5-8% with proper hedging strategies
(2) Risk Hedging Approaches
- Position sizing: Limit exposure to amounts you can afford to lose completely, given the -87.28% decline from all-time high
- Stop-loss implementation: Set stop-loss orders below key support levels to protect capital during adverse price movements
(3) Secure Storage Solutions
- Hot wallet recommendation: Gate Web3 Wallet for active trading and convenient access
- Cold storage approach: Consider hardware wallets for long-term holdings exceeding personal risk thresholds
- Security precautions: Never share private keys, enable two-factor authentication, and verify contract addresses (25hAyBQfoDhfWx9ay6rarbgvWGwDdNqcHsXS3jQ3mTDJ) before transactions
V. MANEKI Potential Risks and Challenges
MANEKI Market Risks
- High volatility: The token has experienced significant price fluctuations, with a 24-hour change of -10.28% and a 7-day decline of -13.51%
- Limited liquidity: With a relatively modest 24-hour trading volume of approximately $27,290, larger transactions may face slippage
- Meme coin dependency: As a cultural token inspired by the Japanese beckoning cat, value depends heavily on community sentiment and social media trends
MANEKI Regulatory Risks
- Evolving crypto regulations: Changes in cryptocurrency regulations across different jurisdictions may impact trading availability and token utility
- Classification uncertainty: Meme tokens may face scrutiny regarding their classification and compliance requirements in various markets
- Exchange listing risks: Limited exchange availability (12 exchanges) compared to major cryptocurrencies may affect accessibility
MANEKI Technical Risks
- Smart contract dependency: As a Solana-based token, security depends on the underlying smart contract at address 25hAyBQfoDhfWx9ay6rarbgvWGwDdNqcHsXS3jQ3mTDJ
- Network congestion: Potential Solana network issues could affect transaction speed and costs
- Centralization concerns: With approximately 63,835 holders and 99.66% of max supply already circulating, distribution patterns warrant monitoring
VI. Conclusion and Action Recommendations
MANEKI Investment Value Assessment
MANEKI represents a culturally-inspired meme coin within the Solana ecosystem, drawing on the symbolism of the Japanese beckoning cat associated with good fortune. While the token has established a community base with over 63,000 holders and maintains a market cap of approximately $3.63 million, it faces substantial challenges. The significant decline of -87.28% from its all-time high of $0.028 in April 2024 to the current price of $0.00041 reflects the volatile nature of meme-based cryptocurrencies. Short-term risks include continued downward pressure, as evidenced by negative momentum across 1-hour, 24-hour, 7-day, and 30-day timeframes. Long-term value depends heavily on sustained community engagement and broader adoption within the Solana ecosystem.
MANEKI Investment Recommendations
✅ Beginners: Approach with extreme caution and allocate only minimal amounts for educational purposes; prioritize learning about wallet security and blockchain fundamentals before investing
✅ Experienced investors: Consider small speculative positions if aligned with meme coin market sentiment strategies; implement strict stop-loss measures and avoid overexposure
✅ Institutional investors: Exercise thorough due diligence regarding liquidity constraints and volatility; MANEKI may not meet institutional risk management criteria given current market metrics
MANEKI Trading Participation Methods
- Spot trading: Purchase MANEKI directly on Gate.com and other supporting exchanges with transparent pricing
- Limit orders: Use limit orders to target specific entry points within the established trading range
- Gradual accumulation: For those with conviction in the project, consider dollar-cost averaging to mitigate timing risk
Cryptocurrency investment carries extremely high risks, and this article does not constitute investment advice. Investors should make prudent decisions based on their own risk tolerance and are advised to consult professional financial advisors. Never invest more than you can afford to lose.
FAQ
What is MANEKI? What are its uses and value?
MANEKI is a meme coin on Solana blockchain launched in April 2024, symbolizing the Japanese lucky cat. It attracts wealth and good fortune, primarily used for cryptocurrency trading and investment purposes in the Web3 ecosystem.
How to predict MANEKI price? What analysis methods are available?
Technical analysis is the primary method for MANEKI price prediction. Use tools like moving averages and RSI indicators to analyze price charts and identify trends. Monitor trading volume and market sentiment for comprehensive forecasting.
What are the main factors affecting MANEKI price?
MANEKI price is influenced by market sentiment, macroeconomic trends, regulatory policies, trading volume, and technological innovation. Community engagement and project developments also play significant roles in price movements.
MANEKI reached an all-time high of $0.0277 and an all-time low of $0.0004. Over the past 7 days, the price declined by 1.69%. Current price momentum shows consolidation with potential upward movement ahead based on market dynamics.
What are the risks of investing in MANEKI and what should I pay attention to?
MANEKI carries market, regulatory, and technical risks. Price volatility is significant with potential manipulation. Monitor policy changes and network security developments carefully.
What are the advantages and disadvantages of MANEKI compared to similar tokens?
MANEKI offers strong security features and blockchain integration for decentralized applications. However, it faces challenges with limited adoption compared to established tokens and increased competition from larger cryptocurrencies in the market.
What is the future development outlook and price potential of MANEKI?
MANEKI shows strong price potential, with expert predictions suggesting it could reach $0.061 by 2025 and $0.053 by 2030. The project demonstrates solid growth trajectory driven by community engagement and increasing adoption in the meme coin sector.
Where can I buy MANEKI? How is the liquidity?
MANEKI is available on major exchanges with growing liquidity. Trading volume continues to increase as the project gains adoption. Check real-time market data on price tracking platforms for current liquidity metrics and trading pairs across different exchanges.
* The information is not intended to be and does not constitute financial advice or any other recommendation of any sort offered or endorsed by Gate.