This comprehensive analysis examines MANEKI, a Solana-based meme token launched in April 2024, providing detailed price forecasts through 2031 alongside professional investment guidance. Currently trading at $0.0004087 with a $3.62 million market cap, MANEKI exhibits extreme fear sentiment (index: 16) and faces significant concentration risks with top three holders controlling 61.25% of supply. The article evaluates core price drivers including community engagement, ecosystem development, and macroeconomic factors, offering conservative to optimistic price range predictions: $0.00024-$0.00044 for 2026, escalating to $0.00036-$0.00076 by 2031. Professional investment strategies accommodate diverse risk profiles, from beginners limiting exposure to 1% to experienced traders utilizing dollar-cost averaging and swing trading on Gate and decentralized exchanges. Critical risk assessments address volatility, limited liquidity, regulatory uncertainty, and meme token dependency on social sentiment rather than fundame
Introduction: MANEKI's Market Position and Investment Value
MANEKI (MANEKI), positioned as Solana's native cat token inspired by Japan's famous beckoning cat symbolizing good luck, success, prosperity, wisdom, and leadership, was launched in April 2024. Since its inception, the token has established a presence within the Solana ecosystem with a holder base of over 63,000 participants. As of January 30, 2026, MANEKI maintains a market capitalization of approximately $3.62 million, with a circulating supply of around 8.86 billion tokens, trading at approximately $0.0004087. This asset, operating on the Solana blockchain, represents a community-driven meme token segment within the broader cryptocurrency landscape.
This article provides a comprehensive analysis of MANEKI's price trajectory from 2026 through 2031, examining historical patterns, market supply-demand dynamics, ecosystem developments, and macroeconomic conditions to offer professional price forecasts and practical investment strategies for potential investors.
I. MANEKI Price History Review and Market Status
MANEKI Historical Price Evolution Trajectory
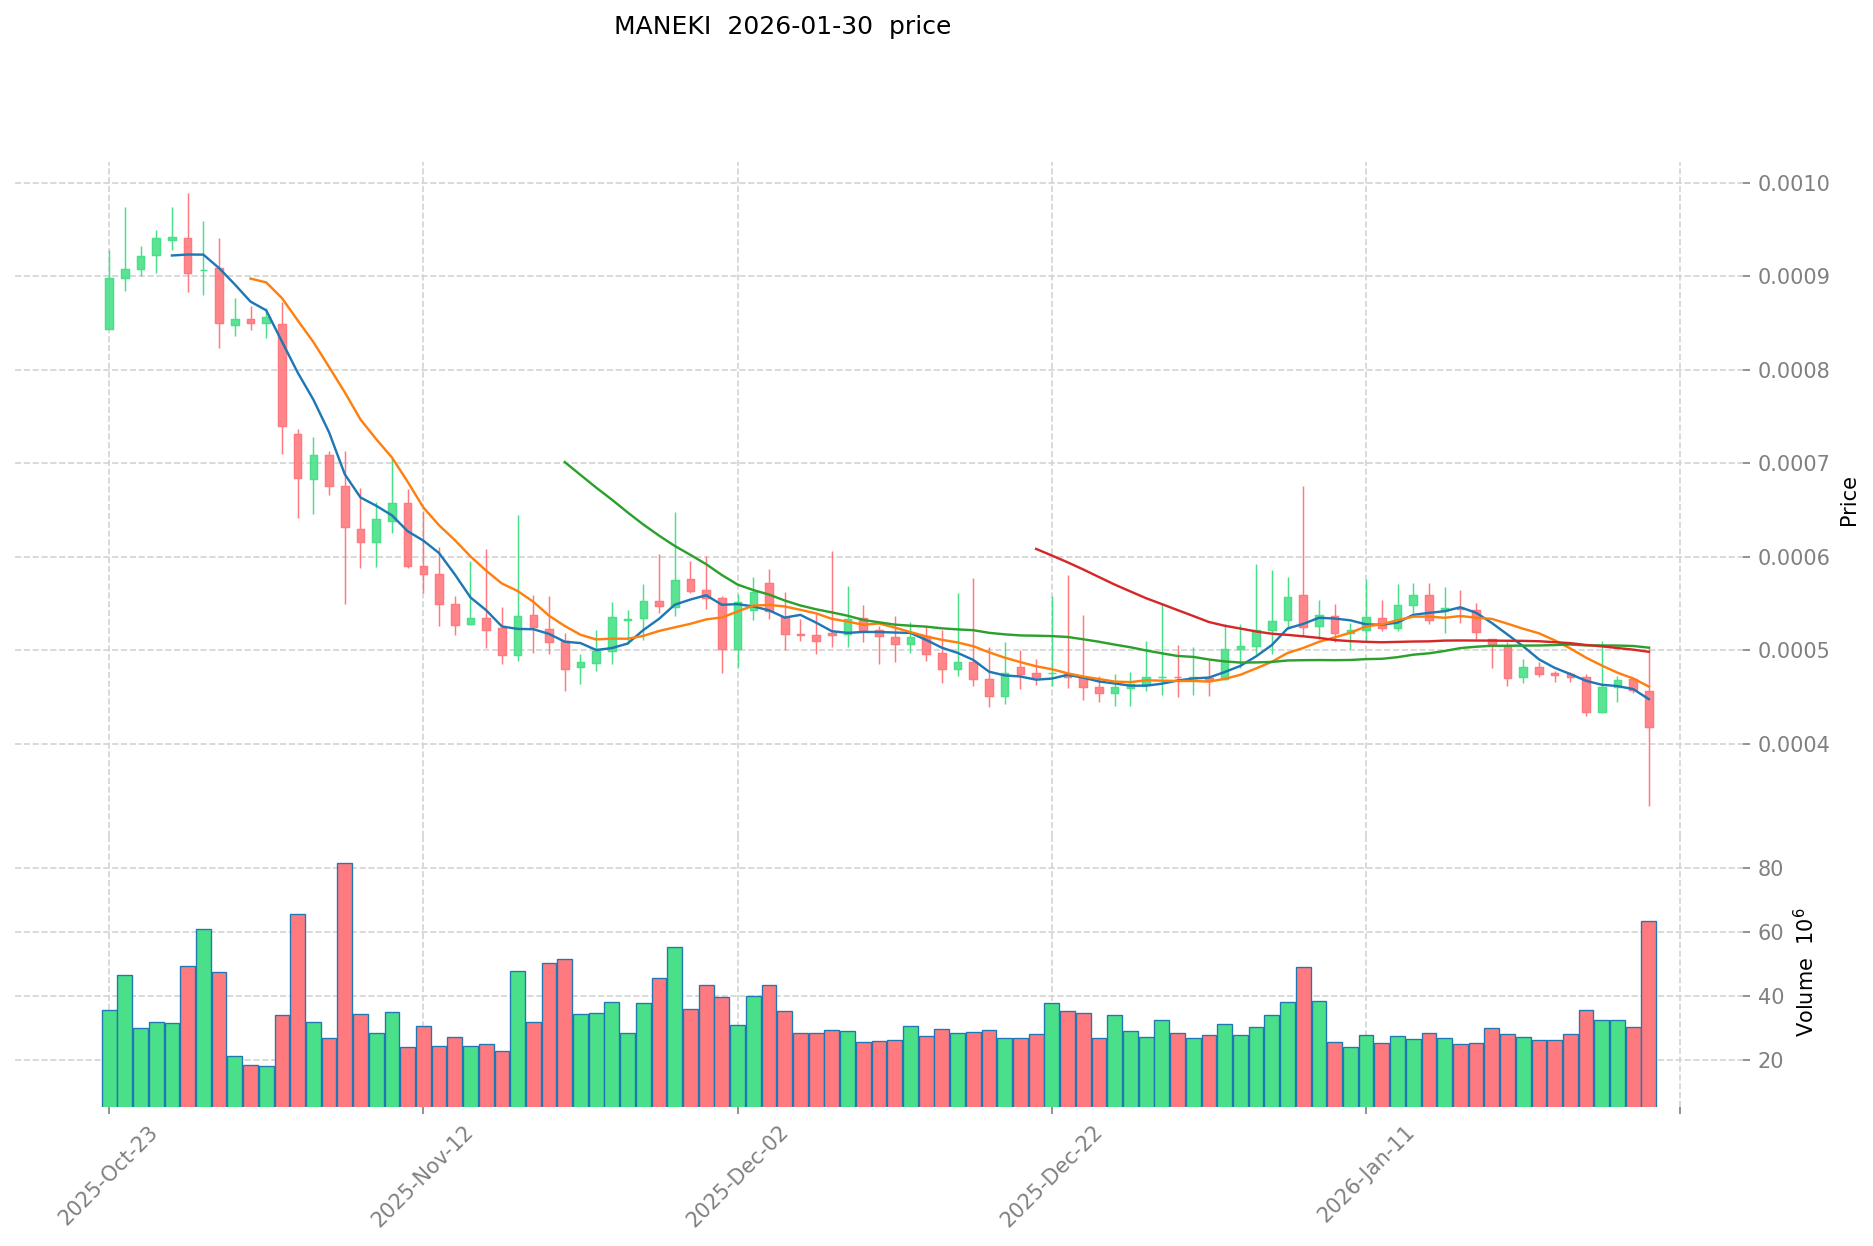
- April 2024: MANEKI reached a historical peak of $0.028 on April 25, 2024, marking a significant milestone during its early trading phase
- January 2026: The token experienced substantial price correction, declining to a historical low of $0.0003333 on January 29, 2026
MANEKI Current Market Situation
MANEKI is currently trading at $0.0004087 as of January 30, 2026. The token has demonstrated notable volatility across different timeframes. Over the past hour, MANEKI showed a modest increase of 0.91%, gaining approximately $0.000003686. However, the 24-hour performance reflects a decline of 9.19%, with the price dropping by $0.000041361.
The weekly and monthly trends indicate continued downward pressure, with MANEKI declining 14.099% over the past 7 days and 13.63% over the past 30 days. The annual performance shows a significant decrease of 87.35%, declining from higher levels to its current valuation.
The token's 24-hour trading range spans from a low of $0.0003333 to a high of $0.0005043, demonstrating intraday volatility. Trading volume stands at approximately $27,458.85 over the past 24 hours.
MANEKI maintains a circulating supply of 8,858,611,539.61 tokens, representing 99.66% of its maximum supply of 8,888,887,546.82 tokens. The market capitalization stands at approximately $3.62 million, with the fully diluted valuation at $3.63 million, showing minimal divergence between the two metrics.
The token holds approximately 63,835 holders and maintains a market dominance of 0.00012%. Current market sentiment indicators reflect extreme fear with a reading of 16 on the volatility index.
Click to view current MANEKI market price
MANEKI Market Sentiment Index
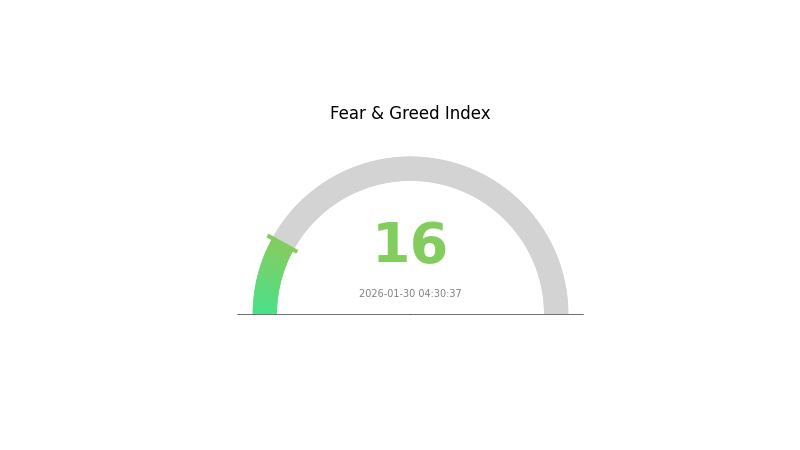
2026-01-30 Fear and Greed Index: 16 (Extreme Fear)
Click to view current Fear & Greed Index
Market sentiment has reached extreme fear levels, with the Fear and Greed Index plummeting to 16. This indicates investors are experiencing heightened anxiety and panic in the cryptocurrency market. Extreme fear periods often present contrarian opportunities for long-term investors, as assets become deeply undervalued. However, caution is advised, as further downside movements remain possible. Market participants should carefully assess their risk tolerance and investment strategies during such volatile periods. Monitoring this indicator closely can help guide trading decisions.
MANEKI Holdings Distribution
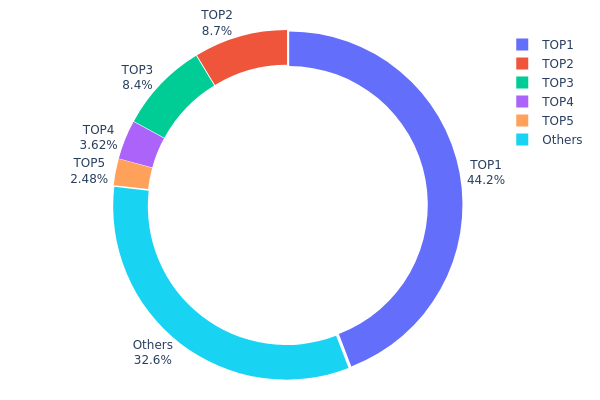
The holdings distribution chart represents the allocation of MANEKI tokens across different wallet addresses on the blockchain. This metric serves as a crucial indicator of token concentration and decentralization level, helping investors assess potential market manipulation risks and the overall health of the token's distribution structure.
Based on the current data, MANEKI exhibits a highly concentrated holdings pattern. The top address holds approximately 3.91 billion tokens, accounting for 44.16% of the total supply, while the second and third largest addresses control 8.70% and 8.39% respectively. The top three addresses collectively hold 61.25% of the circulating supply, indicating significant concentration in the hands of a few entities. This level of concentration poses considerable risks, as large holders possess substantial influence over price movements and market liquidity.
The remaining addresses outside the top five, categorized as "Others," hold 32.66% of the supply, suggesting that while there is some degree of distribution among smaller holders, the market structure remains dominated by whales. Such concentration typically correlates with increased price volatility and susceptibility to coordinated selling pressure. The dominance of the largest address at over 44% is particularly noteworthy, as it represents a single point of significant market control that could potentially impact trading dynamics through large-scale transactions.
Click to view current MANEKI Holdings Distribution
| Top |
Address |
Holding Qty |
Holding (%) |
| 1 |
5Q544f...pge4j1 |
3912280.67K |
44.16% |
| 2 |
6FEVkH...8f51Jy |
771136.01K |
8.70% |
| 3 |
22Wnk8...h7zkBa |
743896.89K |
8.39% |
| 4 |
ASTyfS...g7iaJZ |
321082.35K |
3.62% |
| 5 |
u6PJ8D...ynXq2w |
219334.01K |
2.47% |
| - |
Others |
2890813.82K |
32.66% |
II. Core Factors Influencing MANEKI's Future Price
Supply Mechanism
- Token Distribution and Circulation: MANEKI operates as a meme token with community-driven distribution mechanisms. The token supply dynamics are closely tied to market sentiment and trading activity rather than traditional halving or burning mechanisms.
- Historical Pattern: Meme tokens like MANEKI typically experience price volatility driven by social media trends and community engagement rather than predetermined supply schedules. Past performance shows sensitivity to broader meme coin market cycles.
- Current Impact: Market sentiment and community activity remain primary drivers of MANEKI's price movements, with supply-side factors playing a secondary role compared to demand-driven speculation.
Institutional and Whale Dynamics
- Institutional Holdings: MANEKI represents an emerging meme token category with limited institutional participation compared to established cryptocurrencies. The project maintains a community-focused approach with decentralized ownership patterns.
- Adoption Trends: MANEKI has gained attention within specific crypto communities and has been featured on various launchpad platforms, though mainstream enterprise adoption remains limited given its meme token nature.
Macroeconomic Environment
- Monetary Policy Impact: Central bank policies, particularly interest rate decisions by major monetary authorities, influence overall risk appetite in cryptocurrency markets. Accommodative monetary policies generally support speculative assets including meme tokens.
- Inflation Hedge Characteristics: While MANEKI shares some characteristics with the broader crypto asset class, its role as an inflation hedge is limited compared to established cryptocurrencies. The token functions primarily as a speculative and community-driven asset.
- Geopolitical Factors: International uncertainties and geopolitical developments can increase interest in alternative assets. However, MANEKI's price sensitivity to these factors is typically mediated through broader cryptocurrency market sentiment.
Technology Development and Ecosystem Building
- AI Integration: ChainGPT Pad has featured Maneki AI as a DeFi strategy AI assistant, representing an evolution from pure meme token to utility-focused application. This development saw the token appreciate approximately 10x from presale levels, demonstrating market interest in functional integration.
- Community Engagement: The meme token's value proposition relies heavily on sustained community activity and innovation. Active social media presence and community-driven initiatives serve as primary catalysts for price movements.
- Ecosystem Positioning: MANEKI exists within the broader meme coin ecosystem, competing with established tokens while carving out a niche through cultural branding and community narratives. The token's success depends on maintaining relevance within rapidly evolving meme coin trends.
III. 2026-2031 MANEKI Price Prediction
2026 Outlook
- Conservative Prediction: $0.00024 - $0.00042
- Neutral Prediction: $0.00042 (average trading range)
- Optimistic Prediction: $0.00044 (requires sustained market momentum and increased trading volume)
2027-2029 Outlook
- Market Stage Expectation: Gradual upward trajectory with potential volatility during the broader crypto market cycles
- Price Range Predictions:
- 2027: $0.00025 - $0.00056
- 2028: $0.0003 - $0.00059
- 2029: $0.00047 - $0.00074
- Key Catalysts: Enhanced community engagement, broader adoption within meme coin ecosystems, and potential listings on major platforms like Gate.com
2030-2031 Long-term Outlook
- Baseline Scenario: $0.00036 - $0.00064 (assumes steady market development and maintained community interest)
- Optimistic Scenario: $0.00064 - $0.00072 (requires strong ecosystem growth and favorable market conditions)
- Transformative Scenario: $0.00068 - $0.00076 (contingent upon exceptional adoption rates, strategic partnerships, and sustained bullish crypto market trends)
- 2026-01-30: MANEKI demonstrates potential for progressive growth with price change indicators suggesting emerging upward momentum
| Year |
Predicted High Price |
Predicted Average Price |
Predicted Low Price |
Price Change |
| 2026 |
0.00044 |
0.00042 |
0.00024 |
1 |
| 2027 |
0.00056 |
0.00043 |
0.00025 |
4 |
| 2028 |
0.00059 |
0.00049 |
0.0003 |
20 |
| 2029 |
0.00074 |
0.00054 |
0.00047 |
32 |
| 2030 |
0.00072 |
0.00064 |
0.00036 |
57 |
| 2031 |
0.00076 |
0.00068 |
0.0004 |
66 |
IV. MANEKI Professional Investment Strategy and Risk Management
MANEKI Investment Methodology
(1) Long-term Holding Strategy
- Suitable for: Investors seeking exposure to Solana-based meme tokens with cultural symbolism
- Operational Recommendations:
- Consider dollar-cost averaging (DCA) to mitigate entry timing risk given the token's high volatility
- Monitor Solana ecosystem developments and broader meme token market trends
- Utilize secure storage solutions such as Gate Web3 Wallet for long-term asset custody
(2) Active Trading Strategy
- Technical Analysis Tools:
- Support and Resistance Levels: Current 24H low at $0.0003333 serves as near-term support, while 24H high at $0.0005043 represents immediate resistance
- Volume Analysis: Monitor 24H trading volume ($27,458.85) relative to market cap to gauge liquidity and trading interest
- Swing Trading Considerations:
- High volatility presents opportunities with 24H price fluctuation of -9.19%
- Consider shorter timeframes given the token's meme nature and sentiment-driven price action
MANEKI Risk Management Framework
(1) Asset Allocation Principles
- Conservative Investors: 1-2% of crypto portfolio allocation
- Aggressive Investors: 3-5% of crypto portfolio allocation
- Professional Investors: Up to 10% with active hedging strategies
(2) Risk Hedging Solutions
- Position Sizing: Limit exposure to amounts acceptable for potential total loss
- Stop-Loss Implementation: Consider setting stop-loss orders 15-20% below entry points to limit downside
(3) Secure Storage Solutions
- Hot Wallet Recommendation: Gate Web3 Wallet for active trading and Solana DeFi integration
- Cold Storage Approach: Hardware wallets for long-term holdings exceeding trading requirements
- Security Precautions: Verify contract address (25hAyBQfoDhfWx9ay6rarbgvWGwDdNqcHsXS3jQ3mTDJ) before transactions to avoid fraudulent tokens
V. MANEKI Potential Risks and Challenges
MANEKI Market Risks
- Extreme Volatility: 87.35% decline over one year from ATH demonstrates significant downside risk potential
- Limited Liquidity: Market cap of approximately $3.6M indicates relatively shallow liquidity compared to major cryptocurrencies
- Sentiment Dependency: As a meme token, price action heavily relies on social media trends and community engagement rather than fundamental value drivers
MANEKI Regulatory Risks
- Meme Token Classification: Unclear regulatory treatment of culturally-themed tokens across different jurisdictions
- Exchange Availability: Currently listed on 12 exchanges, potential regulatory actions could impact trading accessibility
- Compliance Uncertainty: Evolving crypto regulations may affect trading, taxation, and legal status of meme tokens
MANEKI Technical Risks
- Solana Network Dependencies: Performance and security tied to underlying Solana blockchain infrastructure
- Smart Contract Security: Token contract vulnerabilities could pose risks to holder assets
- Limited Project Development: Absence of detailed technical roadmap or development activity in provided materials raises sustainability concerns
VI. Conclusion and Action Recommendations
MANEKI Investment Value Assessment
MANEKI represents a culturally-themed meme token on the Solana blockchain with high circulation ratio (99.66% of max supply) but faces significant headwinds. The token has experienced substantial value erosion (-87.35% from ATH) and exhibits high volatility with a 24H price range from $0.0003333 to $0.0005043. While the Japanese beckoning cat symbolism provides cultural appeal, the investment case relies primarily on community sentiment and meme token market dynamics rather than technological innovation or utility. Short-term risks include continued price depreciation, limited liquidity, and regulatory uncertainty surrounding meme tokens.
MANEKI Investment Recommendations
✅ Beginners: Avoid allocation or limit to minimal speculative position (under 1% of portfolio) only with funds prepared for potential total loss
✅ Experienced Investors: Consider small tactical positions (2-3% of crypto portfolio) with strict risk management and stop-loss protocols
✅ Institutional Investors: Generally unsuitable for institutional portfolios due to limited liquidity, high volatility, and lack of fundamental value drivers
MANEKI Trading Participation Methods
- Spot Trading: Direct purchase and sale on Gate.com and other supporting exchanges with MANEKI trading pairs
- Decentralized Trading: Utilize Solana-based DEXs with proper verification of contract address to ensure token authenticity
- Portfolio Integration: Store MANEKI in Gate Web3 Wallet for seamless trading access and Solana ecosystem integration
Cryptocurrency investment carries extremely high risk, and this article does not constitute investment advice. Investors should make prudent decisions based on their own risk tolerance and are advised to consult professional financial advisors. Never invest more than you can afford to lose.
FAQ
What is MANEKI token and what practical application value does it have?
MANEKI is an ERC-20 token on Ethereum offering governance voting rights, staking rewards, and trading fee discounts within its ecosystem. It provides utility through decentralized community participation and value capture mechanisms.
What are the main factors affecting MANEKI price?
MANEKI price is influenced by market sentiment, macroeconomic trends, regulatory policies, and technological innovation. Trading volume, community activity, and overall crypto market conditions also play significant roles in price movements.
What is MANEKI's historical price trend and what stage is it currently in?
MANEKI has experienced significant volatility, declining 9.58% in 24 hours, 12.23% in 7 days, and 51.01% in 3 months. Currently, it appears to be in a consolidation phase with potential for recovery as market sentiment stabilizes.
What are expert predictions for MANEKI's future price?
Experts predict MANEKI will reach $0.061 by 2025 and slightly decline to $0.053 by 2030, according to CoinCodex and DigitalCoinPrice data. These forecasts reflect optimistic market sentiment regarding MANEKI's long-term growth potential.
What risks should I pay attention to when investing in MANEKI?
MANEKI faces high volatility and limited liquidity risks. Price movements are heavily driven by market sentiment, and large transactions can cause significant price fluctuations. The trading volume remains relatively low, which may impact exit opportunities for investors.
What are the advantages or disadvantages of MANEKI compared to similar tokens?
MANEKI offers more flexible token distribution methods compared to BRC-20, allowing varied allocation options. This enhanced flexibility provides better user control and adaptability in token management, giving MANEKI a structural advantage over limited open minting alternatives.
* The information is not intended to be and does not constitute financial advice or any other recommendation of any sort offered or endorsed by Gate.