This comprehensive article provides expert MANTA price analysis and forecasts from 2026 to 2031. It examines MANTA Network's current market position as a zero-knowledge blockchain Layer 2 solution, currently trading at $0.06995 with a $32.19M market cap. The analysis covers historical price trends, market sentiment (currently Extreme Fear at index 24), and token distribution patterns. Key predictions include conservative 2026 forecasts of $0.0664-$0.0937, with potential growth reaching $0.1578+ by 2031 under favorable conditions. The article offers practical investment strategies for beginners through institutional investors, including long-term holding and active trading approaches. Comprehensive risk management frameworks, regulatory considerations, and secure storage solutions via Gate Web3 Wallet are provided to guide investment decisions in this volatile cryptocurrency asset.
Introduction: MANTA's Market Position and Investment Value
Manta Network (MANTA), as a modular blockchain for zero-knowledge (ZK) applications, has been establishing its presence in the Layer 2 ecosystem since its launch in 2024. As of January 2026, MANTA's market capitalization stands at approximately $32.19 million, with a circulating supply of around 460.19 million tokens, and the price is trading near $0.06995. This asset, recognized as a "ZK-as-a-Service provider," is playing an increasingly important role in the EVM-native ZK applications and dApp ecosystem.
This article will comprehensively analyze MANTA's price trends from 2026 to 2031, incorporating historical patterns, market supply and demand dynamics, ecosystem development, and macroeconomic conditions to provide investors with professional price forecasts and practical investment strategies.
I. MANTA Price History Review and Market Status
MANTA Historical Price Evolution Trajectory
- 2024: MANTA reached its historical high of $10.4405 on January 18, 2024, following its initial listing on Gate.com at a publish price of $0.36 in January 2024
- 2025: The market experienced significant corrections throughout the year, with prices declining substantially from previous highs
- 2025-2026: Price continued downward momentum, reaching a historical low of $0.0405 on October 10, 2025, reflecting broader market pressures
MANTA Current Market Status
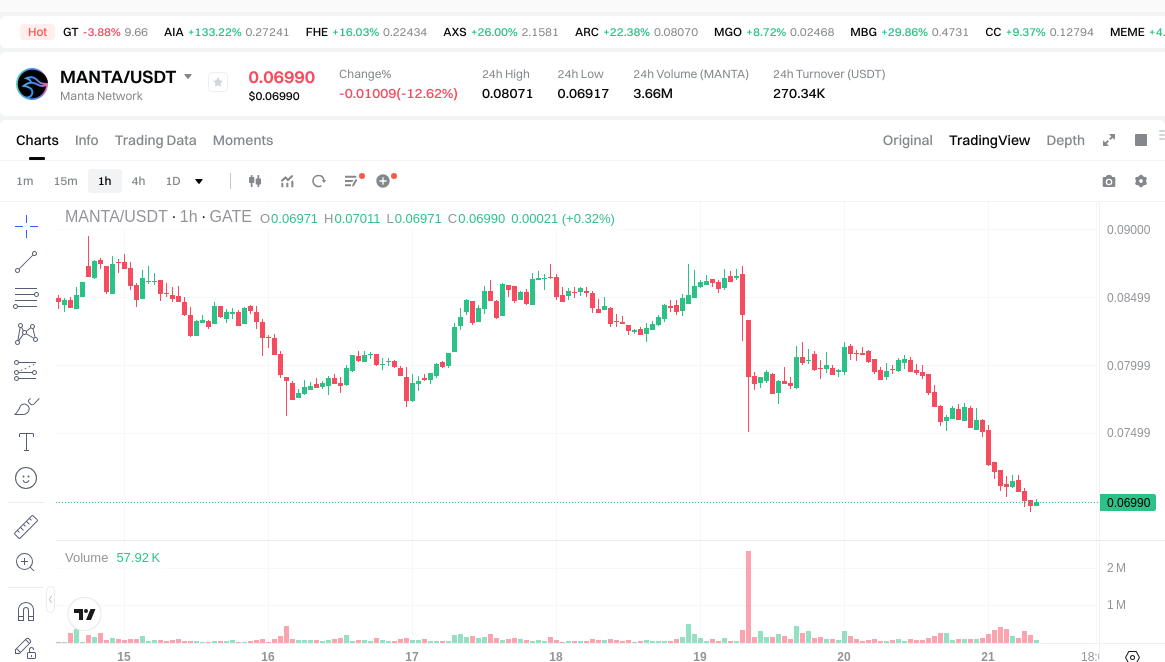
As of January 21, 2026, MANTA is trading at $0.06995, representing a 72.7% increase from its historical low recorded in October 2025. The token's market performance over recent periods shows mixed signals across different timeframes.
In the past hour, MANTA has demonstrated modest positive momentum with a 1.03% increase. However, broader timeframe analysis reveals more concerning trends. The 24-hour performance shows a decline of 12.28%, with the price fluctuating between a low of $0.06917 and a high of $0.08071 during this period. The weekly performance indicates a 16.72% decrease, while the monthly chart reflects a 3.73% decline.
The most significant indicator of market challenges is the annual performance, with MANTA experiencing an 89.61% decrease over the past year. This substantial decline reflects the distance from its all-time high of $10.4405, representing a 99.33% drawdown from peak values.
MANTA currently holds a market capitalization of approximately $32.19 million, with a fully diluted valuation of $69.95 million. The circulating supply stands at 460,187,344 MANTA tokens, representing 46.02% of the maximum supply of 1 billion tokens. The token maintains a market dominance of 0.0022% and is ranked 678th by market capitalization. The 24-hour trading volume amounts to $271,202.66, indicating moderate trading activity relative to its market cap.
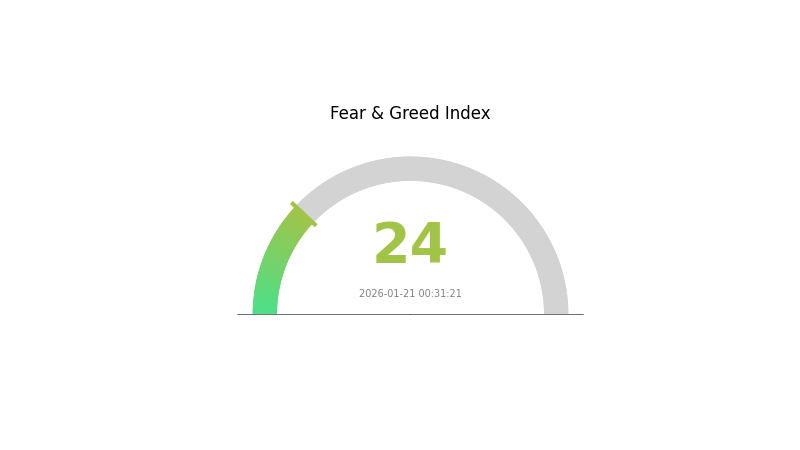
The token is currently listed on 31 exchanges and has a holder base of approximately 200,201 addresses. The Fear and Greed Index registers at 24, indicating an "Extreme Fear" sentiment in the broader cryptocurrency market, which may be influencing MANTA's price action alongside other digital assets.
Click to view current MANTA market price
Market Sentiment Indicator
01-21-2026 Fear and Greed Index: 24 (Extreme Fear)
Click to view current Fear & Greed Index
The cryptocurrency market is currently experiencing extreme fear, with the Fear and Greed Index standing at 24. This indicates significant market pessimism and heightened risk aversion among investors. During such periods, market volatility tends to increase as investors become cautious. This extreme fear environment often presents contrarian opportunities for long-term investors, as panic-driven sell-offs may create entry points for quality assets. However, traders should exercise caution and implement proper risk management strategies when operating in such volatile conditions. Monitor market developments closely before making investment decisions.
MANTA Holding Distribution
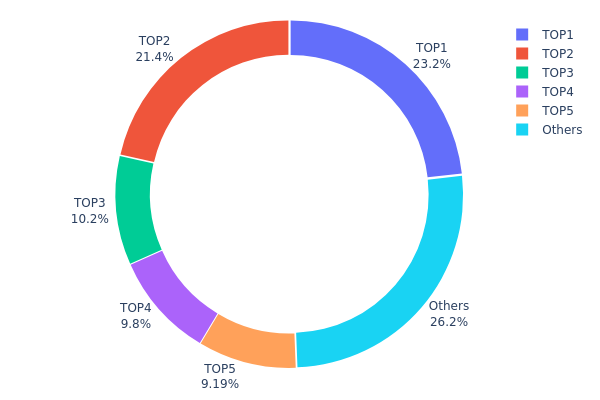
The holding distribution chart illustrates the allocation of MANTA tokens across different wallet addresses, revealing the degree of concentration or decentralization within the network. This metric serves as a crucial indicator of market structure, as it directly impacts liquidity dynamics, price volatility susceptibility, and the overall health of token circulation.
Current data reveals a notably concentrated distribution pattern for MANTA. The top five addresses collectively control approximately 73.81% of the total supply, with the largest single address (0x4200...000010) holding 23.21%, followed closely by the second-largest address (0xf977...41acec) at 21.43%. The third through fifth addresses hold 10.18%, 9.80%, and 9.19% respectively. The remaining 26.19% is distributed among other addresses, indicating a relatively limited dispersion of tokens across the broader holder base.
This concentration level presents both structural considerations and market implications. The dominance of top addresses suggests that MANTA's on-chain ecosystem currently exhibits lower decentralization compared to more mature tokens with broader distribution. Such concentration can amplify price volatility, as large-scale movements from major holders could significantly impact market liquidity and price stability. Additionally, the concentrated nature may raise concerns regarding potential market manipulation risks, as coordinated actions by top holders could disproportionately influence price discovery mechanisms. However, it's worth noting that some concentration may be attributed to legitimate sources such as ecosystem reserves, staking contracts, or foundation holdings, which serve operational purposes rather than speculative intent.
Click to view current MANTA Holding Distribution
| Top |
Address |
Holding Qty |
Holding (%) |
| 1 |
0x4200...000010 |
236803.66K |
23.21% |
| 2 |
0xf977...41acec |
218669.07K |
21.43% |
| 3 |
0x1793...c41419 |
103863.54K |
10.18% |
| 4 |
0x83a1...ae3b8a |
100000.00K |
9.80% |
| 5 |
0x814c...4ea965 |
93750.00K |
9.19% |
| - |
Others |
266913.73K |
26.19% |
II. Core Factors Influencing MANTA's Future Price
Based on the available information, there is insufficient data to provide a comprehensive analysis of the core factors that may influence MANTA's future price. The reference materials do not contain specific information regarding supply mechanisms, institutional holdings, macroeconomic impacts, or technical developments related to MANTA.
Without verified data on these critical aspects, it would be inappropriate to make speculative assessments. A thorough price analysis requires concrete information about tokenomics, market dynamics, and ecosystem developments, which are not present in the provided materials.
III. 2026-2031 MANTA Price Prediction
2026 Outlook
- Conservative Prediction: $0.0664
- Neutral Prediction: $0.0699
- Optimistic Prediction: $0.0937 (requires favorable market conditions and increased adoption)
2027-2029 Outlook
- Market Stage Expectation: Gradual growth phase with potential volatility as the project matures and market conditions evolve
- Price Range Predictions:
- 2027: $0.0466 - $0.0982
- 2028: $0.0675 - $0.0963
- 2029: $0.0587 - $0.1258
- Key Catalysts: Market sentiment shifts, technological developments, and broader cryptocurrency market trends
2030-2031 Long-term Outlook
- Baseline Scenario: $0.0701 - $0.1095 (assuming steady market growth and project development)
- Optimistic Scenario: $0.1242 - $0.1390 (contingent on strong ecosystem expansion and favorable regulatory environment)
- Transformative Scenario: $0.1578+ (under exceptionally favorable conditions including widespread adoption and significant technological breakthroughs)
- 2026-01-21: MANTA shows potential for moderate growth trajectory with price change projections ranging from 17% to 77% over the forecast period
| Year |
Predicted High Price |
Predicted Average Price |
Predicted Low Price |
Price Change |
| 2026 |
0.09372 |
0.06994 |
0.06644 |
0 |
| 2027 |
0.0982 |
0.08183 |
0.04664 |
17 |
| 2028 |
0.09631 |
0.09001 |
0.06751 |
28 |
| 2029 |
0.12577 |
0.09316 |
0.05869 |
33 |
| 2030 |
0.13902 |
0.10947 |
0.07006 |
56 |
| 2031 |
0.15779 |
0.12424 |
0.06336 |
77 |
IV. MANTA Professional Investment Strategy and Risk Management
MANTA Investment Methodology
(1) Long-term Holding Strategy
- Suitable for: Investors who believe in zero-knowledge proof technology and modular blockchain infrastructure
- Operational Recommendations:
- Consider accumulating positions during periods of market volatility, given MANTA's current price of $0.06995 represents a significant discount from its historical levels
- Monitor developments in Manta Pacific's ZK-as-a-Service ecosystem and partnerships that could drive long-term value
- Storage Solution: Gate Web3 Wallet provides secure multi-chain support for storing MANTA tokens with user-controlled private keys
(2) Active Trading Strategy
- Technical Analysis Tools:
- Volume Analysis: Current 24-hour trading volume of $271,202 suggests moderate liquidity; monitor volume spikes for potential breakout signals
- Support and Resistance Levels: The 24-hour low of $0.06917 may serve as near-term support, while $0.08071 (24-hour high) represents immediate resistance
- Swing Trading Considerations:
- Recent 24-hour decline of 12.28% and 7-day decline of 16.72% suggest short-term downward momentum that active traders should monitor
- Consider the circulating supply of 460.19 million tokens (46.02% of max supply) when evaluating potential dilution impacts
MANTA Risk Management Framework
(1) Asset Allocation Principles
- Conservative Investors: 1-3% portfolio allocation
- Moderate Investors: 3-5% portfolio allocation
- Aggressive Investors: 5-10% portfolio allocation
(2) Risk Hedging Approaches
- Diversification Strategy: Balance MANTA exposure with other Layer 2 and privacy-focused blockchain assets
- Position Sizing: Use dollar-cost averaging to mitigate timing risk in volatile market conditions
(3) Secure Storage Solutions
- Mobile Wallet Recommendation: Gate Web3 Wallet offers convenient access with enhanced security features for MANTA token storage
- Multi-Signature Solution: Consider multi-signature wallets for larger holdings to enhance security
- Security Precautions: Never share private keys, enable two-factor authentication, and regularly backup wallet recovery phrases
V. MANTA Potential Risks and Challenges
MANTA Market Risks
- Price Volatility: The 89.61% decline over the past year indicates substantial price volatility that investors should carefully consider
- Liquidity Concerns: With a market capitalization of approximately $32.19 million and ranking at #678, MANTA faces liquidity challenges compared to larger-cap assets
- Market Sentiment: Current market share of 0.0022% suggests limited mainstream adoption and potential for continued price pressure
MANTA Regulatory Risks
- Privacy Technology Scrutiny: Zero-knowledge proof technologies may face increased regulatory attention as authorities examine privacy-enhancing blockchain solutions
- Compliance Requirements: Evolving global cryptocurrency regulations could impact Manta Network's operational flexibility and token utility
- Geographic Restrictions: Potential limitations on trading or usage in certain jurisdictions could affect market accessibility
MANTA Technical Risks
- Smart Contract Vulnerabilities: As with any blockchain protocol, smart contract bugs or exploits could impact the network and token value
- Competition: The Layer 2 and ZK-application space is increasingly competitive, with multiple projects vying for market share
- Adoption Challenges: Success depends on attracting developers and users to the Manta Pacific ecosystem, which remains uncertain
VI. Conclusion and Action Recommendations
MANTA Investment Value Assessment
MANTA represents exposure to the zero-knowledge proof and modular blockchain sectors through its Layer 2 infrastructure. The project's backing from notable institutions and its technical focus on ZK-as-a-Service provide long-term potential. However, investors should weigh this against significant short-term challenges, including substantial price decline of 89.61% over the past year, current market capitalization of $32.19 million, and a market cap to fully diluted valuation ratio of 46.02% suggesting potential future token supply increases. The recent negative price momentum across multiple timeframes indicates ongoing market headwinds.
MANTA Investment Recommendations
✅ Beginners: Start with small position sizes (1-2% of crypto portfolio) and focus on understanding the project's technology and ecosystem before increasing exposure
✅ Experienced Investors: Consider MANTA as a speculative allocation (3-5% of crypto portfolio) within a broader Layer 2 and privacy technology strategy, with close monitoring of technical developments
✅ Institutional Investors: Conduct thorough due diligence on Manta Network's technology stack, team credentials, and competitive positioning before considering allocation
MANTA Trading Participation Methods
- Spot Trading: MANTA is available for spot trading on Gate.com with 31 exchanges supporting the token, providing multiple access points for investors
- Gate Web3 Wallet: Use Gate Web3 Wallet for secure self-custody of MANTA tokens with seamless integration to the Gate.com trading platform
- Research and Monitoring: Track Manta Network's development progress through their official website at https://manta.network/ and Twitter presence at https://twitter.com/MantaNetwork
Cryptocurrency investment carries extremely high risks, and this article does not constitute investment advice. Investors should make prudent decisions based on their own risk tolerance and are advised to consult professional financial advisors. Never invest more than you can afford to lose.
FAQ
What is MANTA token and what are its uses?
MANTA is the native token of Manta Network, a modular blockchain platform enabling privacy-preserving applications. It serves as a governance token for protocol decisions and is used for transaction fees, staking, and incentivizing network validators and developers.
MANTA has shown significant growth since its launch, experiencing multiple bull runs with notable price increases. The token demonstrated strong upward momentum during crypto market rallies, reaching multiple all-time highs. Despite market volatility, MANTA maintained solid support levels and attracted substantial trading volume, reflecting growing ecosystem adoption and investor interest in the project.
What are the main factors affecting MANTA price?
MANTA price is influenced by market demand, network adoption, ecosystem development, overall crypto market sentiment, trading volume, technological upgrades, and competitive positioning within the Web3 infrastructure space.
What is the MANTA price prediction for 2024?
Based on market analysis, MANTA was projected to reach $0.50-$1.20 in 2024. However, actual performance depends on ecosystem adoption, technology developments, and overall market conditions. Current price movements reflect evolving investor sentiment.
What advantages does MANTA have compared to other Layer 2 projects?
MANTA offers privacy-focused features, efficient zk-proof technology, lower transaction costs, and faster settlement speeds. Its modular design enables seamless interoperability while maintaining enhanced security and scalability advantages over traditional Layer 2 solutions.
What risks should I pay attention to when investing in MANTA?
MANTA carries market volatility risk, liquidity risk, and technology risk. Price fluctuations can be significant due to market sentiment. Ensure you only invest what you can afford to lose and conduct thorough research before trading.
What are the circulating supply and total supply of MANTA?
MANTA has a circulating supply of approximately 1.4 billion tokens and a total supply of 10 billion tokens. The token distribution is managed to support long-term ecosystem development and community incentives.
What are the future development prospects of MANTA?
MANTA shows strong potential driven by privacy-focused innovations and growing Web3 adoption. With expanding ecosystem partnerships and increasing institutional interest, the token is positioned for significant growth in the evolving digital asset landscape.
* The information is not intended to be and does not constitute financial advice or any other recommendation of any sort offered or endorsed by Gate.