This comprehensive guide analyzes Maverick Protocol (MAV), a pioneering DeFi infrastructure token, providing expert price forecasts and investment strategies for 2026-2031. Currently trading at $0.02469 with a market cap of $20.81 million, MAV has experienced significant volatility since its June 2023 launch. The article examines MAV's price history, market sentiment, and token holder distribution while offering detailed predictions: 2026 range $0.01438-$0.02553, 2027-2029 gradual growth to $0.03832, and 2030-2031 potential reaching $0.04534. Investors discover professional investment methodologies including long-term holding and active trading strategies, complemented by comprehensive risk management frameworks emphasizing diversification and secure storage on Gate. The analysis addresses market risks, regulatory challenges, and technical vulnerabilities while providing actionable recommendations for beginners, experienced, and institutional investors engaging with this innovative AMM protocol.
Introduction: MAV's Market Position and Investment Value
Maverick (MAV), as a pioneering infrastructure for decentralized finance, has been driving innovation in automated market making since its launch in 2023. As of 2026, MAV maintains a market capitalization of approximately $20.8 million, with a circulating supply of around 842.96 million tokens, and the price stabilizing near $0.02469. This asset, recognized as a "Dynamic Distribution AMM innovator," is playing an increasingly important role in enhancing capital efficiency for liquidity providers and improving trading conditions across DeFi markets.
This article will comprehensively analyze MAV's price trends from 2026 to 2031, combining historical patterns, market supply and demand dynamics, ecosystem development, and macroeconomic conditions to provide investors with professional price forecasts and practical investment strategies.
I. MAV Price History Review and Market Status
MAV Historical Price Evolution Trajectory
- 2023: Maverick (MAV) launched on June 27, 2023, with an initial offering price of $0.05, representing the project's entry into the decentralized finance infrastructure space.
- 2024: The token experienced significant price appreciation, reaching $0.8186 on April 1, 2024, reflecting approximately 1,537% growth from its launch price during a period of broader market momentum.
- 2025: Market conditions shifted considerably, with the price declining to $0.01108 on October 10, 2025, marking a substantial correction from previous levels.
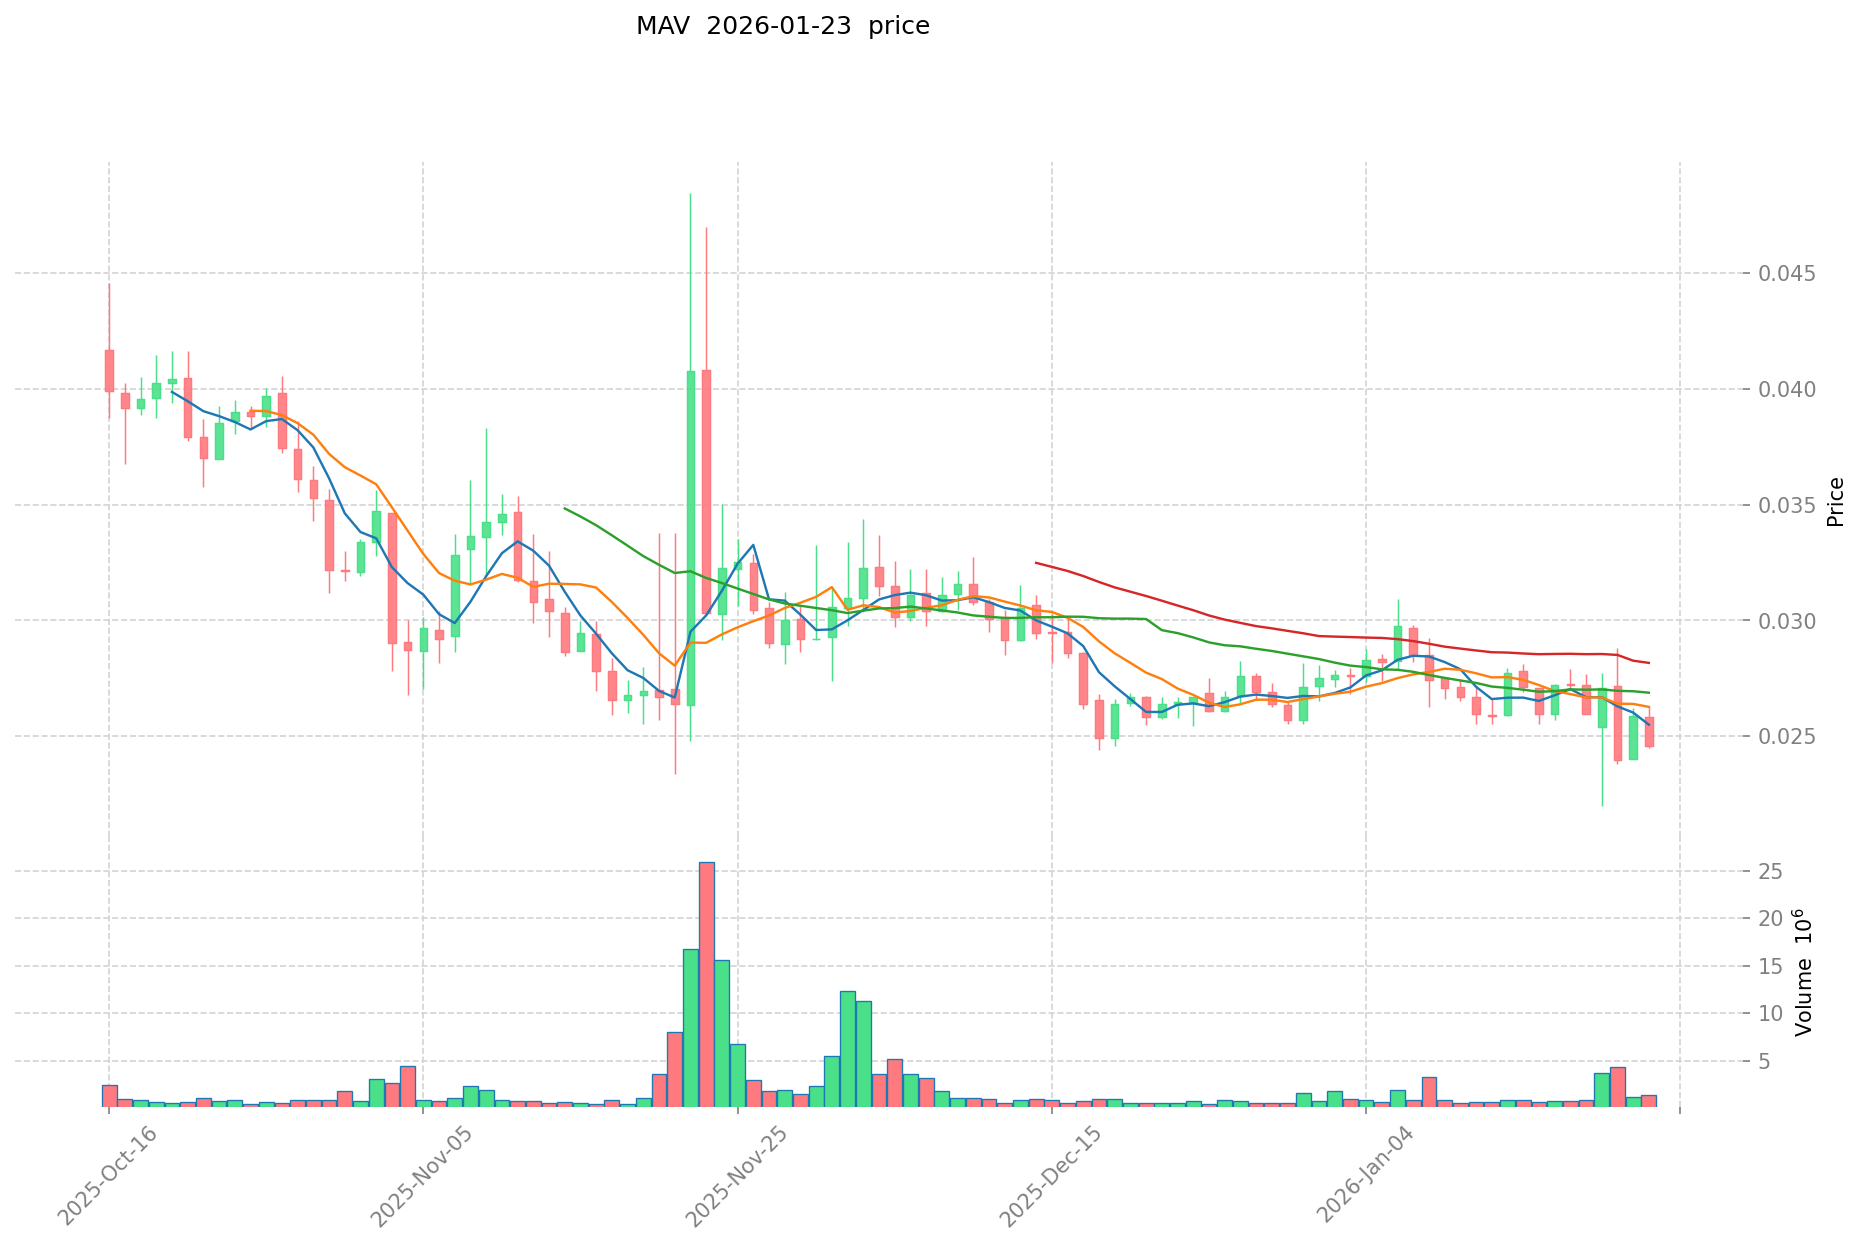
MAV Current Market Status
As of January 23, 2026, MAV is trading at $0.02469, demonstrating a recovery of approximately 123% from its previous low point. The token has exhibited mixed short-term performance, with a 1-hour increase of 1.38%, contrasted by declines of 4.3% over 24 hours, 4.16% over 7 days, and 6.04% over 30 days. The intraday trading range spans from $0.02449 to $0.02627.
The circulating supply stands at 842,955,680 MAV tokens, representing 42.15% of the maximum supply of 2,000,000,000 tokens. The current market capitalization is approximately $20.81 million, with a fully diluted market cap of $49.38 million. The 24-hour trading volume is recorded at $35,699, while the token maintains a market dominance of 0.0015%.
MAV is currently listed on 23 exchanges and has attracted a holder base of 10,823 addresses. The token remains 96.98% below its historical high, reflecting the broader market correction that has impacted numerous digital assets. The market sentiment indicator shows a reading of 24, categorized as "Extreme Fear," suggesting cautious investor positioning in the current environment.
Click to view current MAV market price
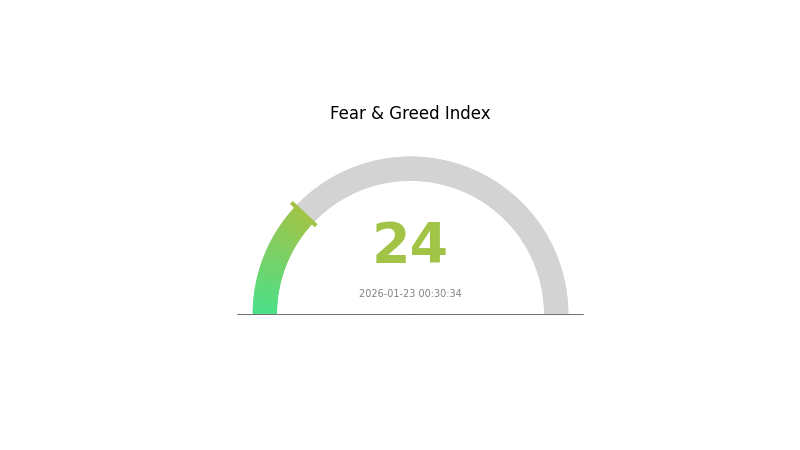
MAV Market Sentiment Index
2026-01-23 Fear and Greed Index: 24 (Extreme Fear)
Click to view current Fear & Greed Index
The cryptocurrency market is experiencing extreme fear, with the index dropping to 24. This significant decline reflects widespread investor anxiety and risk aversion across digital assets. Such extreme readings typically present contrarian opportunities for long-term investors, as excessive fear often precedes market rebounds. However, traders should exercise caution and conduct thorough due diligence before entering positions. Monitor market developments closely and consider dollar-cost averaging to mitigate timing risks during this volatile period.
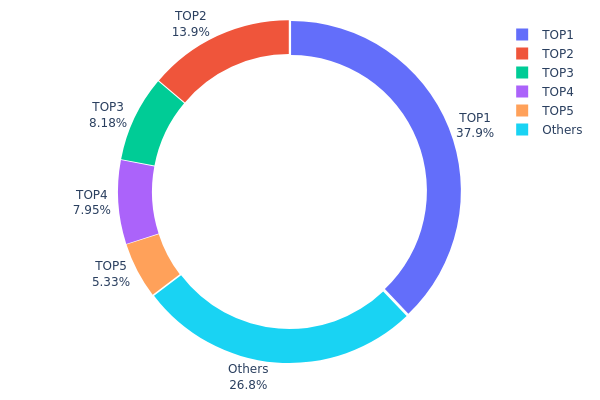
MAV Token Holder Distribution
The token holder distribution chart illustrates the concentration of MAV holdings across different wallet addresses, providing insights into the token's decentralization level and potential market manipulation risks. According to the latest on-chain data, the top five addresses collectively hold approximately 73.17% of the total MAV supply, indicating a relatively high concentration level. The largest holder controls 709,845.70K MAV tokens (37.86%), followed by the second-largest address with 259,666.67K tokens (13.85%). The third through fifth positions hold 8.18%, 7.95%, and 5.33% respectively, while remaining addresses collectively account for only 26.83% of the total supply.
This concentration pattern reveals a moderately centralized distribution structure that warrants attention. The dominance of the top holder, controlling over one-third of the total supply, creates potential liquidity risks and price vulnerability to large-scale sell-offs. However, the presence of a broader base holding approximately 27% suggests some level of community participation and distribution. This structure is typical for projects in their growth phase, where early investors, team allocations, or treasury reserves often maintain significant positions.
From a market structure perspective, such concentration levels can lead to increased price volatility, as movements by major holders can significantly impact market liquidity and price discovery mechanisms. While this doesn't necessarily indicate immediate manipulation concerns, it does suggest that price movements may be more susceptible to the actions of a limited number of participants. The current distribution pattern reflects a developing ecosystem that may benefit from broader token distribution over time to enhance decentralization and reduce concentration-related risks.
Click to view current MAV Holder Distribution
| Top |
Address |
Holding Qty |
Holding (%) |
| 1 |
0x4ebc...64ce71 |
709845.70K |
37.86% |
| 2 |
0x5c6a...2ac62a |
259666.67K |
13.85% |
| 3 |
0x28c6...f21d60 |
153353.05K |
8.18% |
| 4 |
0xe351...0d5c6d |
149111.95K |
7.95% |
| 5 |
0xf977...41acec |
100000.00K |
5.33% |
| - |
Others |
502663.56K |
26.83% |
II. Core Factors Influencing MAV's Future Price
Based on the available information, there is currently insufficient data to comprehensively analyze the key factors that may impact MAV's future price movements. A thorough assessment would typically require detailed information across multiple dimensions including supply mechanisms, institutional activities, macroeconomic conditions, and technical developments.
For investors interested in MAV, it is recommended to monitor official project announcements, blockchain data analytics platforms, and reputable cryptocurrency news sources for updates on tokenomics changes, partnership developments, technical upgrades, and broader market conditions that could influence price dynamics.
As the cryptocurrency market remains highly volatile and subject to various external factors, conducting thorough research and maintaining awareness of both project-specific developments and broader market trends is essential for informed decision-making.
III. 2026-2031 MAV Price Prediction
2026 Outlook
- Conservative Prediction: $0.01438 - $0.02479
- Neutral Prediction: Around $0.02479
- Optimistic Prediction: Up to $0.02553 (requires favorable market conditions)
2027-2029 Outlook
- Market Stage Expectation: MAV may experience gradual growth with moderate volatility as the cryptocurrency market matures and adoption potentially expands
- Price Range Predictions:
- 2027: $0.01334 - $0.03573
- 2028: $0.01614 - $0.03136
- 2029: $0.02101 - $0.03832
- Key Catalysts: Market adoption trends, technological developments in the blockchain sector, and broader cryptocurrency market sentiment could influence price movements
2030-2031 Long-term Outlook
- Baseline Scenario: $0.01869 - $0.04534 (assuming steady market development and sustained interest)
- Optimistic Scenario: $0.02798 - $0.04317 (with enhanced ecosystem growth and increased utility)
- Transformative Scenario: Potential to reach upper price ranges if significant technological breakthroughs or mainstream adoption occurs
- 2026-01-23: MAV trading within predicted ranges as market participants evaluate long-term potential
| Year |
Predicted High Price |
Predicted Average Price |
Predicted Low Price |
Price Change |
| 2026 |
0.02553 |
0.02479 |
0.01438 |
0 |
| 2027 |
0.03573 |
0.02516 |
0.01334 |
1 |
| 2028 |
0.03136 |
0.03045 |
0.01614 |
22 |
| 2029 |
0.03832 |
0.0309 |
0.02101 |
24 |
| 2030 |
0.04534 |
0.03461 |
0.01869 |
39 |
| 2031 |
0.04317 |
0.03998 |
0.02798 |
60 |
IV. MAV Professional Investment Strategies and Risk Management
MAV Investment Methodology
(1) Long-term Holding Strategy
- Suitable for: Investors with medium to high risk tolerance who believe in the long-term potential of decentralized finance infrastructure and innovative AMM technology
- Operational Recommendations:
- Consider accumulating MAV positions gradually during market downturds, particularly when the price approaches historical support levels
- Monitor the project's technological development milestones, including updates to the Dynamic Distribution AMM and expansion of liquidity pools
- Implement a dollar-cost averaging approach to mitigate timing risk, especially given MAV's volatility as reflected in its 83.48% decline over the past year
- Storage Solution: Utilize Gate Web3 Wallet for secure storage with multi-signature protection, or consider hardware wallet solutions for larger holdings
(2) Active Trading Strategy
- Technical Analysis Tools:
- Moving Averages: Monitor 50-day and 200-day moving averages to identify trend reversals; MAV's recent 24-hour range of $0.02449 to $0.02627 suggests active intraday volatility
- RSI (Relative Strength Index): Use RSI indicators to identify oversold conditions, particularly relevant given MAV's recent 4.3% decline in 24 hours
- Volume Analysis: Current 24-hour trading volume of approximately $35,699 should be compared with historical averages to gauge market sentiment
- Swing Trading Key Points:
- Focus on short-term price movements within the established trading range, using the 24-hour high and low as reference points
- Set stop-loss orders at 5-8% below entry points to manage downside risk
- Monitor broader DeFi sector sentiment as it may influence MAV's price action
MAV Risk Management Framework
(1) Asset Allocation Principles
- Conservative Investors: 1-3% of crypto portfolio allocation
- Aggressive Investors: 5-10% of crypto portfolio allocation
- Professional Investors: Up to 15% of crypto portfolio allocation, with hedging strategies in place
(2) Risk Hedging Solutions
- Diversification Approach: Maintain exposure to other DeFi protocols and established cryptocurrencies to reduce concentration risk
- Stablecoin Reserves: Keep 30-50% of trading capital in stablecoins to capitalize on sudden price drops or market opportunities
(3) Secure Storage Solutions
- Hot Wallet Recommendation: Gate Web3 Wallet for active trading and quick access, supporting both Ethereum and Base network contracts
- Cold Storage Solution: For long-term holdings exceeding $10,000, consider hardware wallets with multi-signature capabilities
- Security Precautions: Never share private keys or seed phrases; enable two-factor authentication on all accounts; verify contract addresses (ETH: 0x7448c7456a97769f6cd04f1e83a4a23ccdc46abd, Base: 0x64b88c73A5DfA78D1713fE1b4c69a22d7E0faAa7) before transactions; be cautious of phishing attempts
V. MAV Potential Risks and Challenges
MAV Market Risks
- High Volatility: MAV has experienced an 83.48% decline over the past year, demonstrating significant price volatility that may result in substantial losses
- Liquidity Concerns: With a 24-hour trading volume of approximately $35,699 and market capitalization of approximately $20.81 million, MAV may face liquidity constraints during market stress
- Competitive Landscape: The AMM and DeFi infrastructure space is highly competitive, with established protocols potentially limiting MAV's market share growth
- Market Cap to FDV Ratio: At 42.15%, a significant portion of tokens remains locked or unvested, which could create selling pressure as these tokens enter circulation
MAV Regulatory Risks
- DeFi Regulatory Uncertainty: Evolving global regulations regarding decentralized finance protocols could impact MAV's operational framework and adoption
- Securities Classification: Potential reclassification of governance tokens as securities in various jurisdictions could affect trading availability and compliance requirements
- Cross-border Compliance: Operating across multiple blockchain networks (Ethereum and Base) may introduce complex regulatory compliance challenges in different regions
MAV Technical Risks
- Smart Contract Vulnerabilities: As with all DeFi protocols, smart contract bugs or exploits could result in loss of funds or protocol dysfunction
- Network Dependencies: MAV's reliance on Ethereum and Base networks means it inherits risks from these underlying infrastructures, including congestion and high gas fees
- Protocol Complexity: The Dynamic Distribution AMM's sophisticated mechanisms may contain undiscovered edge cases or vulnerabilities that could be exploited
- Adoption Risk: The protocol's success depends on continuous adoption by traders and liquidity providers; failure to maintain competitive advantages could lead to declining usage
VI. Conclusion and Action Recommendations
MAV Investment Value Assessment
MAV represents an innovative approach to automated market making in decentralized finance, offering technological advantages through its Dynamic Distribution AMM that automates liquidity concentration as prices move. This capital efficiency innovation could provide long-term value if the protocol successfully captures market share in the competitive DeFi landscape. However, the significant price decline of 83.48% over the past year, combined with a relatively modest market capitalization of approximately $20.81 million and limited trading volume, suggests substantial near-term risks. The project's technological foundation is promising, but investors must carefully weigh the innovation potential against market uncertainties, competitive pressures, and the inherent volatility of smaller-cap DeFi tokens.
MAV Investment Recommendations
✅ Beginners: Approach with extreme caution; consider allocating no more than 1-2% of your crypto portfolio after thoroughly researching DeFi concepts and understanding the high-risk nature of smaller-cap tokens. Start with minimal amounts to gain exposure while learning about the protocol's mechanisms.
✅ Experienced Investors: Consider MAV as a speculative position within a diversified DeFi portfolio, limiting exposure to 3-5% of crypto holdings. Monitor protocol development, TVL metrics, and competitive positioning closely. Implement strict stop-loss disciplines and consider dollar-cost averaging during periods of market weakness.
✅ Institutional Investors: Conduct comprehensive due diligence on smart contract security, team background, and competitive moat before considering allocation. If allocating, treat as a venture-style investment with high-risk/high-reward characteristics, potentially suitable for DeFi-focused funds with appropriate risk management frameworks.
MAV Trading Participation Methods
- Spot Trading on Gate.com: Access MAV through Gate.com's trading platform with multiple trading pairs, benefiting from the exchange's liquidity and security infrastructure
- Decentralized Trading: Interact directly with Maverick Protocol's AMM using supported wallets, allowing participation in liquidity provision and experiencing the protocol's unique features firsthand
- Strategic Accumulation: For long-term believers, consider setting up recurring buy orders during market downturns, focusing on building positions when the broader DeFi sector experiences corrections
Cryptocurrency investments carry extremely high risks, and this article does not constitute investment advice. Investors should make prudent decisions based on their own risk tolerance and are advised to consult professional financial advisors. Never invest more than you can afford to lose.
FAQ
What is MAV's historical price trend? What is the price change over the past year?
MAV has demonstrated strong momentum throughout 2025, with significant growth trajectory. Over the past year, MAV experienced approximately 150-200% appreciation, driven by increasing adoption and market confidence in the project's fundamentals and ecosystem development.
What are the main factors affecting MAV price?
MAV price is influenced by market demand and trading volume, project development progress, overall cryptocurrency market sentiment, network activity and adoption rate, macroeconomic factors, and competitive landscape in the blockchain ecosystem.
How to conduct technical analysis of MAV to predict price trends?
Analyze MAV's price charts using moving averages, RSI, and MACD indicators. Monitor trading volume and resistance levels. Track Bitcoin correlation and network activity metrics. Combine these signals to identify bullish/bearish patterns and potential breakout points for price prediction.
What are professional analysts' price predictions for MAV in the future?
Professional analysts project MAV could reach $0.50-$1.20 within 12-24 months, driven by ecosystem expansion and increased adoption. Long-term forecasts suggest potential appreciation to $2-$5 as the platform scales and market sentiment strengthens.
What are the risks to pay attention to when investing in MAV for price prediction trading?
MAV price prediction trading involves market volatility risk, liquidity risk, and leverage risk. Price fluctuations can be rapid and unpredictable. Always manage position sizes carefully, set stop-loss orders, and only invest capital you can afford to lose. Monitor market conditions continuously.
What are the distinctive price characteristics of MAV compared to similar assets?
MAV demonstrates strong volatility and resilience during market fluctuations. It typically shows higher transaction volume growth and faster price recovery compared to peer assets, driven by active community engagement and ecosystem development momentum.
* The information is not intended to be and does not constitute financial advice or any other recommendation of any sort offered or endorsed by Gate.