This comprehensive analysis examines Measurable Data Token (MDT) price performance and market dynamics from 2026 to 2031. As a decentralized big data ecosystem token currently trading at $0.012497, MDT faces both opportunities and challenges shaped by ecosystem adoption, market sentiment, and competitive pressures. The article combines historical trend analysis, supply dynamics, and macroeconomic factors to project potential price ranges: $0.00722-$0.01631 (2026), with gradual growth through 2031 potentially reaching $0.02291 under optimistic scenarios. Investors receive actionable strategies including long-term holding approaches, active trading techniques, and risk management frameworks. The guide addresses market volatility, liquidity constraints, and regulatory considerations while recommending position sizing aligned with investor risk profiles and storage solutions via Gate exchange platforms.
Introduction: MDT's Market Position and Investment Value
MeasurableDataToken (MDT), as a decentralized big data value economic ecosystem based on blockchain technology, has been serving as a communication unit among users, data purchasers, and data suppliers since its launch in 2018. As of 2026, MDT maintains a market capitalization of approximately $7.58 million, with a circulating supply of around 606.32 million tokens, and a price hovering near $0.012497. This asset, designed to quantify data value and incentivize anonymous data sharing, is playing an increasingly important role in the data economy sector.
This article will comprehensively analyze MDT's price trends from 2026 to 2031, combining historical patterns, market supply and demand dynamics, ecosystem development, and macroeconomic conditions to provide investors with professional price forecasts and practical investment strategies.
I. MDT Price History Review and Market Status
MDT Historical Price Evolution Trajectory
- 2018: MDT reached its historical low point during the market downturn, with the price declining to $0.00173261 on December 18.
- 2021: The token experienced notable price appreciation during the broader market rally, reaching $0.168053 on December 26, representing a significant milestone in its trading history.
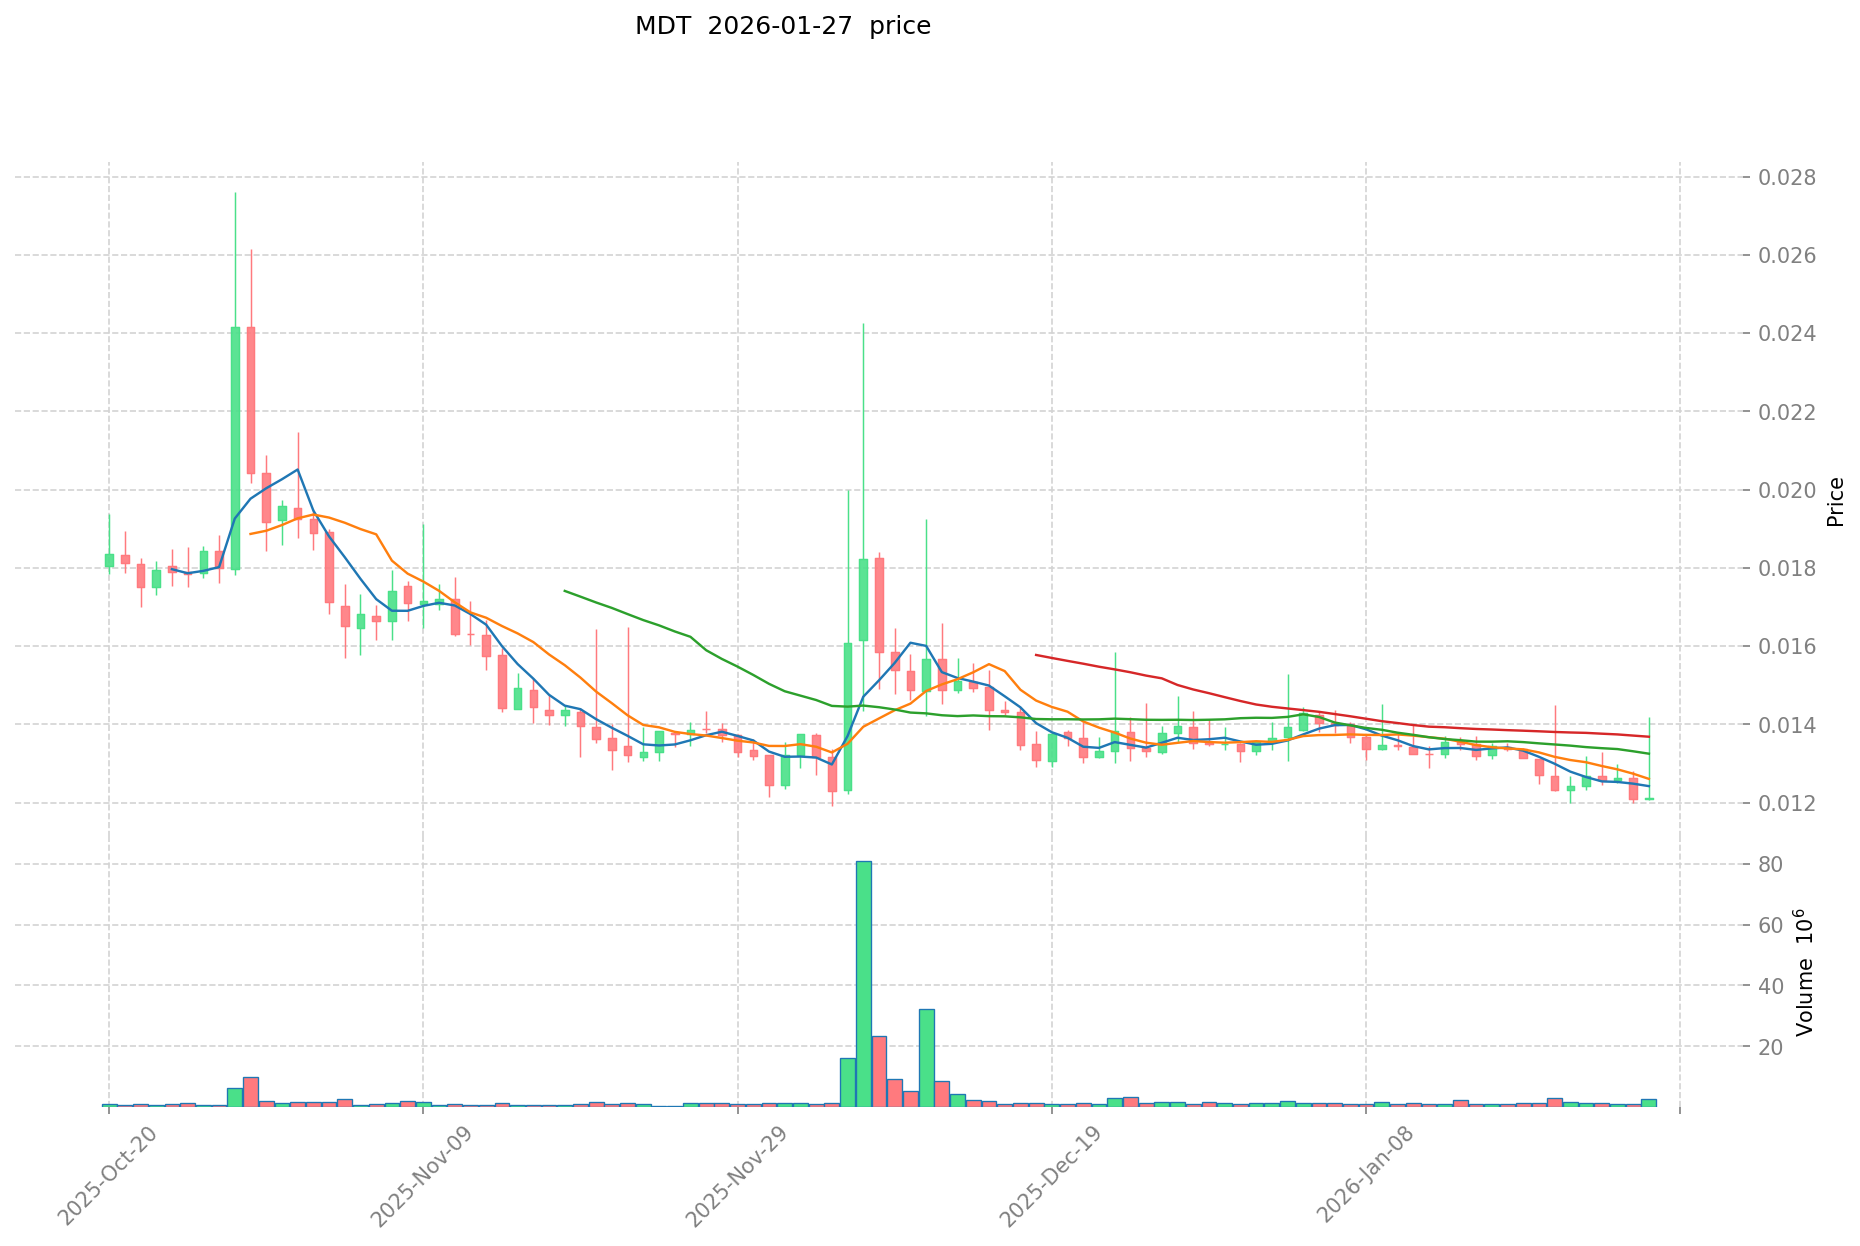
- 2025-2026: Following the market cycle transition, MDT underwent a substantial price adjustment, declining approximately 72.28% over the past year from previous levels to the current trading range.
MDT Current Market Status
As of January 27, 2026, MDT is trading at $0.012497, showing a modest decline of 0.45% over the past 24 hours. The token's 24-hour trading range has fluctuated between $0.011972 and $0.01309, with a total trading volume of approximately $23,408.
The token's market capitalization stands at $7.58 million, with a circulating supply of 606.32 million tokens, representing 60.63% of the total supply of 1 billion tokens. The fully diluted market capitalization is calculated at $12.50 million. MDT maintains a market dominance of 0.00040% within the broader cryptocurrency ecosystem.
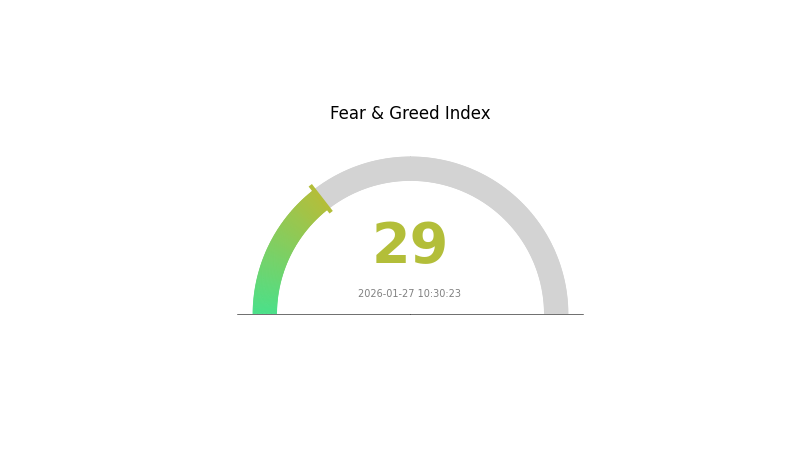
Over different time horizons, MDT has demonstrated mixed price performance: a 0.6% increase over the past hour, a slight gain of 0.18% over the past week, while experiencing an 8.93% decline over the 30-day period. The token has recorded 30,383 holders and is currently listed on 19 exchanges. The market sentiment index indicates a reading of 29, reflecting a "Fear" sentiment environment in the current trading landscape.
Click to view the current MDT market price
MDT Market Sentiment Indicator
2026-01-27 Fear and Greed Index: 29 (Fear)
Click to view the current Fear & Greed Index
The cryptocurrency market is currently in a fear state with an index reading of 29. This indicates heightened market anxiety and risk aversion among investors. When the Fear and Greed Index reaches this level, it typically reflects concerns about market volatility, potential corrections, or negative macroeconomic factors affecting digital assets. Such sentiment often creates both challenges and opportunities - cautious investors may be waiting on the sidelines, while contrarian traders might view this as a potential entry point. Market participants should monitor key support levels and remain vigilant about upcoming developments that could shift sentiment in either direction.
MDT Holdings Distribution
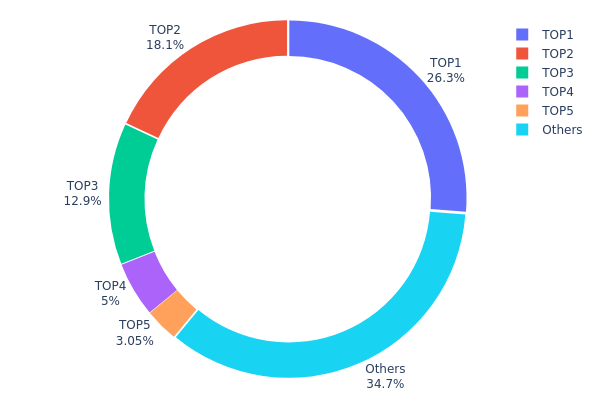
The holdings distribution chart reflects the concentration of token holdings across different addresses on the blockchain, serving as a key indicator of market decentralization and potential manipulation risks. For MDT, the current on-chain data reveals a moderately concentrated distribution pattern that warrants careful examination.
According to the latest holdings data, the top five addresses collectively control approximately 65.23% of the total MDT supply, with the largest single address holding 262,564.60K tokens (26.25%). The second and third largest holders possess 18.09% and 12.85% respectively, while the remaining addresses outside the top five account for only 34.77% of the supply. This concentration level suggests that a relatively small number of entities maintain significant influence over MDT's market dynamics, potentially exposing the token to elevated volatility risks and coordinated selling pressure.
From a market structure perspective, this distribution pattern indicates limited decentralization, which could amplify price fluctuations during periods of market stress. The dominance of top holders creates an asymmetric power dynamic where major stakeholders possess disproportionate control over liquidity and price discovery mechanisms. However, the presence of a substantial "Others" category (34.77%) demonstrates that retail participation remains meaningful, providing some buffer against complete centralization. This dual-layer structure reflects a developing ecosystem where institutional or early stakeholder dominance coexists with growing community participation, suggesting a transitional phase in MDT's on-chain maturation process.
Click to view current MDT Holdings Distribution
| Top |
Address |
Holding Qty |
Holding (%) |
| 1 |
0xf977...41acec |
262564.60K |
26.25% |
| 2 |
0xa145...70c5b3 |
181000.00K |
18.09% |
| 3 |
0x4f4d...8f0ca4 |
128597.48K |
12.85% |
| 4 |
0x5a52...70efcb |
50000.00K |
5.00% |
| 5 |
0xa9d1...1d3e43 |
30488.39K |
3.04% |
| - |
Others |
347349.53K |
34.77% |
II. Core Factors Influencing MDT's Future Price
Supply Mechanism
- Token Distribution and Vesting: MDT's total supply is capped at 1 billion tokens, distributed across multiple categories including the MailTime team allocation (240 million MDT), early investors and advisors (110 million MDT), user growth mining pool (150 million MDT), presale (150 million MDT), and token distribution event (350 million MDT). The structured release schedule impacts market liquidity and price stability.
- Historical Patterns: Since its launch, MDT has experienced notable price fluctuations influenced by token unlocking events and changes in circulating supply. The gradual release of tokens from vesting periods has historically created selling pressure during unlock phases.
- Current Impact: The current supply dynamics continue to affect price movements, with market participants closely monitoring remaining locked tokens and their release schedules.
Institutional and Major Holder Dynamics
- Institutional Holdings: MDT's ecosystem has attracted attention from blockchain-focused investors, though specific institutional holding data remains limited in public disclosure. The involvement of early-stage investors and advisors holding 110 million MDT represents a significant portion of the total supply.
- Enterprise Adoption: The Measurable AI platform, as MDT ecosystem's core business-facing product, provides alternative data services to enterprise clients, creating real-world utility for the token within data monetization scenarios.
- Regulatory Considerations: As digital currency markets face increasing regulatory scrutiny globally, MDT's future development may be influenced by evolving compliance requirements and government policies regarding decentralized identity management and data privacy frameworks.
Macroeconomic Environment
- Market Demand Fluctuations: MDT's price remains sensitive to broader cryptocurrency market conditions, investor sentiment, and external economic factors. The overall volatility in digital asset markets creates both opportunities and risks for MDT holders.
- Competition Landscape: The decentralized identity management sector faces intense competition from multiple blockchain projects developing similar technologies. Competitive pressure from alternative solutions may impact MDT's market share and token valuation.
- Industry Maturation: As blockchain technology continues to mature and decentralized identity authentication gains recognition from enterprises and institutions, MDT may benefit from increased market demand for privacy-preserving identity solutions.
Technology Development and Ecosystem Building
- Data Freshness and Quality: The MDT ecosystem prioritizes data freshness and specifications as key factors determining data value, with the platform designed to reward users for contributing high-quality data through the token incentive mechanism.
- Wallet Functionality Enhancement: According to internal team planning, the MDT wallet will incorporate richer features in the future, including improved methods for users to claim and manage their MDT tokens, potentially enhancing user engagement and ecosystem utility.
- Ecosystem Applications: The MDT ecosystem comprises multiple interconnected products that collectively drive data collection, processing, and monetization, creating a comprehensive data economy framework that supports token utility and demand.
III. MDT Price Prediction for 2026-2031
2026 Outlook
- Conservative Prediction: $0.00722 - $0.01245
- Neutral Prediction: Around $0.01245
- Optimistic Prediction: Up to $0.01631 (requires favorable market conditions and increased adoption)
2027-2029 Outlook
- Market Stage Expectation: The token is projected to enter a gradual growth phase, with price volatility expected as the market matures and ecosystem development progresses.
- Price Range Predictions:
- 2027: $0.01208 - $0.01553, representing approximately 15% growth
- 2028: $0.00882 - $0.01660, with an estimated 19% increase
- 2029: $0.01310 - $0.01736, showing around 26% growth potential
- Key Catalysts: Platform ecosystem expansion, increased user adoption, potential partnerships, and broader cryptocurrency market sentiment could serve as primary drivers for price appreciation during this period.
2030-2031 Long-term Outlook
- Baseline Scenario: $0.00911 - $0.01789 (assuming steady ecosystem growth and stable market conditions)
- Optimistic Scenario: $0.01657 - $0.02291 (contingent upon successful platform upgrades and significant user base expansion)
- Transformative Scenario: Potential to reach $0.02291 or higher (requires exceptional market conditions, major technological breakthroughs, and widespread mainstream adoption)
- 2026-01-27: MDT trading within the predicted range of $0.00722 - $0.01631 (current baseline positioning)
| Year |
Predicted High Price |
Predicted Average Price |
Predicted Low Price |
Price Change |
| 2026 |
0.01631 |
0.01245 |
0.00722 |
0 |
| 2027 |
0.01553 |
0.01438 |
0.01208 |
15 |
| 2028 |
0.0166 |
0.01495 |
0.00882 |
19 |
| 2029 |
0.01736 |
0.01578 |
0.0131 |
26 |
| 2030 |
0.01789 |
0.01657 |
0.00911 |
32 |
| 2031 |
0.02291 |
0.01723 |
0.01309 |
37 |
IV. MDT Professional Investment Strategy and Risk Management
MDT Investment Methodology
(1) Long-term Holding Strategy
- Suitable for: Investors interested in data economy sector development and blockchain-based data monetization platforms
- Operational Recommendations:
- Consider accumulating positions during periods of lower volatility, given MDT's current price of $0.012497 represents a significant decline from its historical high
- Monitor developments in MDT's decentralized big data value ecosystem and user reward mechanisms
- Storage Solution: Utilize Gate Web3 Wallet for secure storage, given MDT's ERC-20 token standard on Ethereum network
(2) Active Trading Strategy
- Technical Analysis Tools:
- Support and Resistance Levels: Current 24-hour range shows support near $0.011972 and resistance around $0.01309
- Volume Analysis: Monitor daily trading volume (currently $23,408) for potential breakout signals
- Swing Trading Considerations:
- The token has shown relatively stable short-term performance with +0.6% (1H) and +0.18% (7D)
- Consider the 30-day decline of -8.93% when evaluating entry points
MDT Risk Management Framework
(1) Asset Allocation Principles
- Conservative Investors: 1-3% of crypto portfolio allocation
- Aggressive Investors: 3-5% of crypto portfolio allocation
- Professional Investors: Up to 5-8% with active risk monitoring
(2) Risk Hedging Approaches
- Portfolio Diversification: Balance MDT holdings with established cryptocurrencies and stablecoins
- Position Sizing: Given the 72.28% decline over 1 year, implement strict position limits
(3) Security Storage Solutions
- Hot Wallet Recommendation: Gate Web3 Wallet for convenient trading access
- Cold Storage Approach: Consider hardware wallet solutions for larger holdings
- Security Precautions: Never share private keys, enable two-factor authentication, and verify contract addresses (0x814e0908b12A99FeCf5BC101bB5d0b8B5cDf7d26) before transactions
V. MDT Potential Risks and Challenges
MDT Market Risks
- Volatility Risk: MDT has experienced substantial price fluctuation, with a 72.28% decline over the past year
- Liquidity Risk: Relatively modest daily trading volume of $23,408 may impact large order execution
- Market Cap Risk: Current market capitalization of approximately $7.58 million indicates lower-cap status with associated volatility
MDT Regulatory Risks
- Data Privacy Compliance: As a data monetization platform, changes in global data protection regulations could impact operations
- Cryptocurrency Regulation: Evolving regulatory frameworks in different jurisdictions may affect token accessibility and usage
- Platform Governance Risk: Decentralized data marketplace models face uncertain regulatory treatment across regions
MDT Technical Risks
- Smart Contract Risk: As an ERC-20 token, exposure to potential Ethereum network vulnerabilities or contract bugs
- Platform Adoption Risk: Success depends on attracting both data contributors and data purchasers to the ecosystem
- Competition Risk: The data monetization sector includes various competing projects and traditional centralized solutions
VI. Conclusion and Action Recommendations
MDT Investment Value Assessment
MDT presents a specialized investment opportunity within the blockchain-based data economy sector. The project addresses data ownership and monetization through a decentralized platform connecting users, data purchasers, and suppliers. However, the substantial 72.28% decline over the past year and relatively low trading volume suggest significant market challenges. The token's long-term value proposition relies on successful ecosystem development and user adoption, while short-term risks include market volatility, liquidity constraints, and competitive pressures in the data monetization space.
MDT Investment Recommendations
✅ Beginners: Approach with caution; if interested, allocate only a minimal portion (under 2%) of your crypto portfolio and prioritize learning about data economy projects
✅ Experienced Investors: Consider small speculative positions with strict stop-loss parameters; monitor ecosystem development and partnership announcements
✅ Institutional Investors: Evaluate MDT within a broader data economy investment thesis; conduct thorough due diligence on platform metrics and user growth
MDT Trading Participation Methods
- Spot Trading: Available on Gate.com with 19 exchange listings for price comparison
- Dollar-Cost Averaging: Implement systematic purchase strategies to mitigate timing risk given price volatility
- Gradual Position Building: Consider building positions incrementally during periods of market stability
Cryptocurrency investment carries extremely high risks. This article does not constitute investment advice. Investors should make prudent decisions based on their own risk tolerance and are advised to consult professional financial advisors. Never invest more than you can afford to lose.
FAQ
What is MDT token? What are its uses?
MDT token is an ERC-20 based token powering the Measurable Data Token ecosystem. It facilitates data product access, user rewards, and transactions within the decentralized data platform, enabling users to participate in data monetization.
MDT demonstrated a 12.92% price change over the past year, with a 52-week range between 79.55 and 106.33. The token has shown resilience in the market with consistent trading activity and volatility typical of digital assets.
What are the main factors affecting MDT price?
MDT price is influenced by market demand, token utility within the ecosystem, data consumption trends, user engagement, and overall cryptocurrency market sentiment. These factors collectively determine MDT's market value.
What is the MDT price prediction for 2024-2025?
MDT price is predicted to trade between $0.004264 and $0.050413 in 2025, with an average annual price of $0.018214, representing a potential 36.21% return on investment.
What are MDT's advantages compared to other data tokens?
MDT quantifies data value and facilitates transactions within the data economy. It compensates data providers and enables data purchasers to acquire insights, serving as the essential currency mechanism for all ecosystem participants.
What are the risks of MDT investment?
MDT investment carries market volatility risk, regulatory uncertainty, and technical risks such as network security issues. Investors should conduct thorough research before investing.
Analyze MDT using key metrics including trading volume, price trends, and market sentiment. Employ technical indicators such as moving averages and RSI. Monitor historical price data patterns. Track platform developments, ecosystem growth, and community engagement. Stay informed on regulatory news and market conditions affecting MDT fundamentals.
What is the MDT project team composition and development roadmap?
MDT project team emphasizes collaborative development with a focus on long-term innovation. The roadmap prioritizes technological advancement and professional enhancement, working with strategic partners to drive sustained progress in the ecosystem.
* The information is not intended to be and does not constitute financial advice or any other recommendation of any sort offered or endorsed by Gate.