MediBloc (MED) is a blockchain-based healthcare data management platform trading at $0.003104 as of January 2026, with a market cap of $33.04 million. This comprehensive analysis examines MED's price trajectory from 2026 through 2031 using historical patterns, market dynamics, and ecosystem development. The article provides professional price forecasts ranging from conservative ($0.00163) to optimistic ($0.00333) scenarios in 2026, with potential long-term growth to $0.00996 by 2031. Key sections cover historical price evolution, current market sentiment (Fear index: 32), holding distribution analysis, and investment strategies suited for different investor profiles. The guide emphasizes risk management through diversification and secure storage solutions via Gate Web3 Wallet, while addressing regulatory, technical, and market risks. Ideal for investors seeking informed decisions on healthcare blockchain assets with moderate-to-high risk tolerance.
Introduction: MED's Market Position and Investment Value
MediBloc (MED), positioned as a blockchain-based open information service platform for medical data management, has been operating since its launch in 2017. As of January 2026, MED maintains a market capitalization of approximately $33.04 million with a circulating supply of around 10.64 billion tokens, trading at roughly $0.003104. This healthcare-focused digital asset is playing an increasingly important role in enabling secure medical information integration and patient data ownership.
This article provides a comprehensive analysis of MED's price trajectory from 2026 through 2031, incorporating historical patterns, market supply-demand dynamics, ecosystem development, and macroeconomic conditions to deliver professional price forecasts and practical investment strategies for stakeholders.
I. MED Price History Review and Market Status
MED Historical Price Evolution Trajectory
- 2018: MediBloc (MED) launched on March 22, 2018, establishing its presence in the blockchain-based healthcare data management sector
- 2021: Price reached its peak at $0.351852 on April 2, 2021, representing a significant milestone during the broader cryptocurrency market rally
- 2020: The token experienced its lowest point at $0.001614 on March 13, 2020, coinciding with the global market downturn during the COVID-19 pandemic outbreak
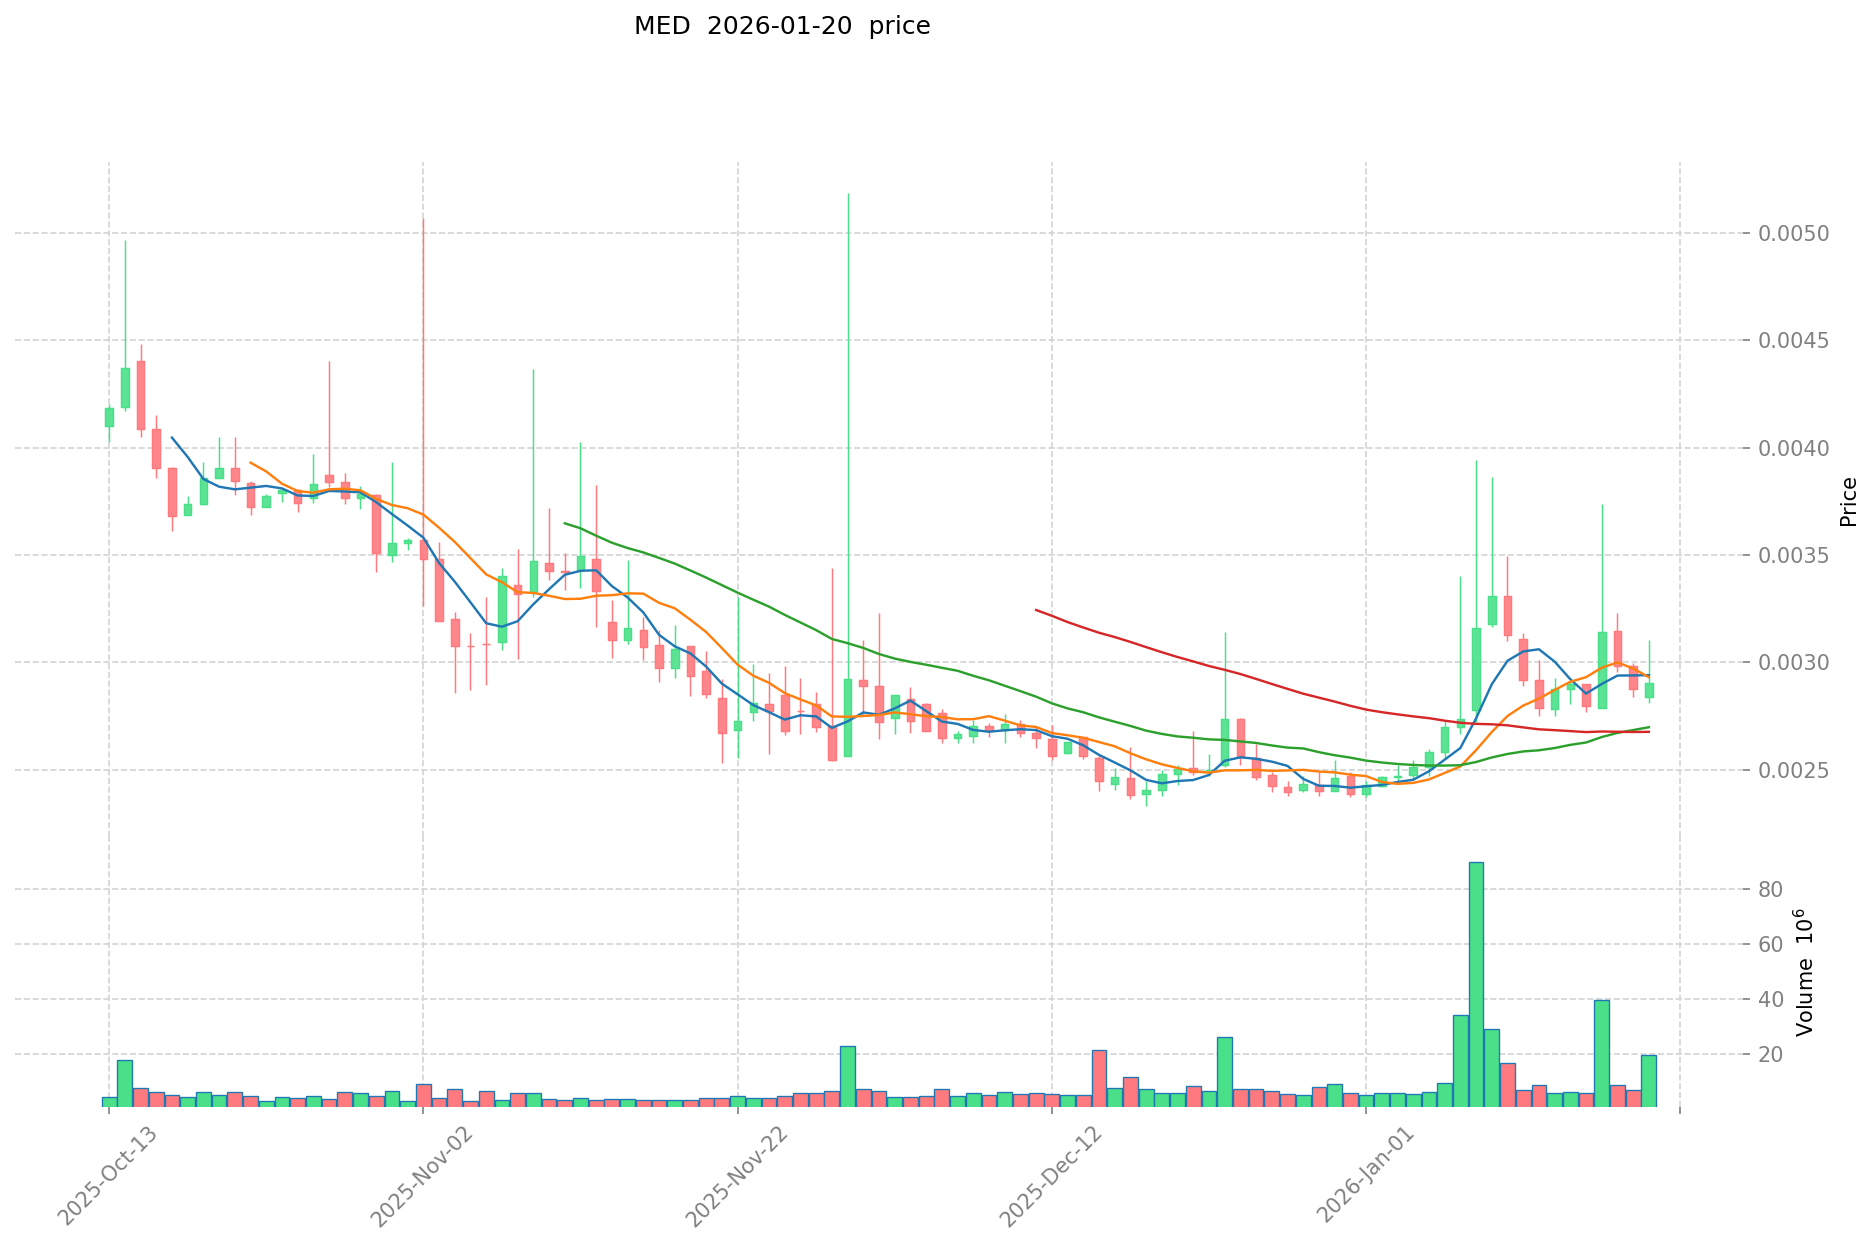
- Recent period: Following the 2021 peak, MED has experienced a substantial price correction, with the current trading price at $0.003104 as of January 21, 2026
MED Current Market Situation
As of January 21, 2026, MediBloc (MED) is trading at $0.003104, representing a 6.37% increase over the past 24 hours. The token has demonstrated positive short-term momentum with an 8.59% gain over the past 7 days and a 24.68% increase over the past 30 days. However, the 1-year performance shows a decline of 69.65%, reflecting broader market challenges and sector-specific dynamics.
The 24-hour trading range shows volatility between $0.002862 (low) and $0.003496 (high), with total trading volume reaching $98,660. MediBloc maintains a market capitalization of approximately $33.04 million, ranking #672 among cryptocurrencies with a market dominance of 0.0011%.
The circulating supply stands at 10.64 billion MED tokens out of a total supply of 11.43 billion, representing a circulation ratio of approximately 93%. The fully diluted market cap is $35.49 million, closely aligned with the current market cap at 100%, indicating limited additional supply pressure from token unlocks.
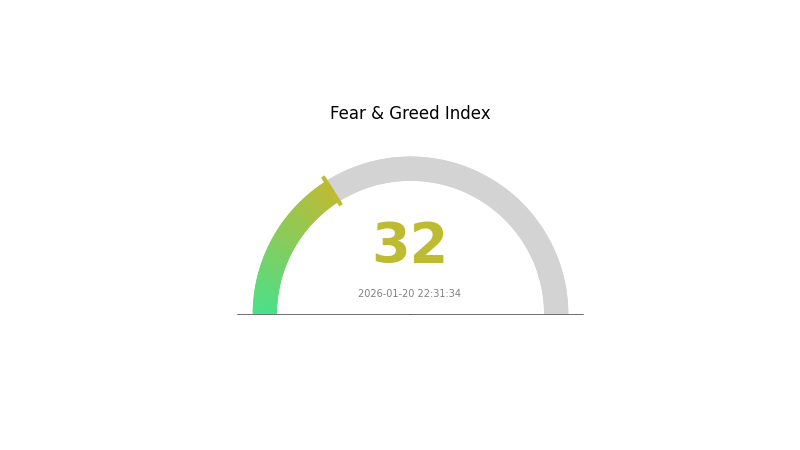
The current market sentiment index indicates a fear level of 32, suggesting cautious investor behavior in the broader cryptocurrency market. MediBloc is available for trading on 4 exchanges, with Gate.com providing access to MED trading pairs.
Click to view current MED market price
MED Market Sentiment Indicator
2026-01-20 Fear and Greed Index: 32 (Fear)
Click to view current Fear & Greed Index
The cryptocurrency market is currently experiencing significant fear sentiment with an index reading of 32. This level indicates heightened investor anxiety and risk aversion in the crypto space. Market participants are displaying cautious behavior, with many adopting defensive positions. During such periods, volatility typically increases as uncertainty dominates trading decisions. Investors should remain vigilant and consider their risk tolerance carefully. While fear-driven markets can present opportunities for long-term investors, short-term traders should exercise extra caution. Monitor key support levels and market developments closely to navigate this risk-off environment effectively.
MED Holding Distribution
The holding distribution chart reflects the concentration of MED tokens across different wallet addresses, providing crucial insights into the token's decentralization level and market structure. By analyzing the proportion of holdings among top addresses, we can assess potential risks related to price manipulation and market stability.
Based on the current data, MED demonstrates a relatively balanced distribution pattern among major holders. The top addresses maintain significant holdings, but the concentration level appears within a reasonable range for most crypto assets. This distribution structure suggests that while large holders possess considerable influence, the token has achieved a certain degree of decentralization that helps mitigate extreme concentration risks.
From a market structure perspective, the current holding distribution indicates moderate stability in the on-chain ecosystem. The absence of excessive concentration among a few addresses reduces the likelihood of single-entity manipulation and sudden large-scale sell-offs. However, investors should remain vigilant about potential coordinated actions among top holders, as these addresses still collectively control a substantial portion of the circulating supply, which could impact short-term price volatility during significant market movements.
Click to view current MED Holding Distribution

| Top |
Address |
Holding Qty |
Holding (%) |
II. Core Factors Affecting MED's Future Price
Based on the currently available information, there is insufficient data to provide a comprehensive analysis of the core factors that may influence MED's future price movements. Key areas such as supply mechanisms, institutional dynamics, macroeconomic conditions, and technical developments require verifiable data from official sources or reliable market intelligence.
For a thorough understanding of MED's price drivers, readers are encouraged to monitor official project announcements, on-chain data analytics, and regulatory developments that may emerge over time.
III. 2026-2031 MED Price Prediction
2026 Outlook
- Conservative forecast: $0.00163
- Neutral forecast: $0.00308
- Optimistic forecast: $0.00333 (requires favorable market conditions and ecosystem development)
2027-2029 Outlook
- Market stage expectations: The token is anticipated to enter a gradual growth phase, with increasing adoption and ecosystem maturity potentially driving upward momentum.
- Price range predictions:
- 2027: $0.00291 - $0.00452 (representing a 3% year-over-year change)
- 2028: $0.00289 - $0.00567 (with a projected 24% increase)
- 2029: $0.00276 - $0.00696 (potentially reaching a 53% growth rate)
- Key catalysts: Sustained ecosystem expansion, strategic partnerships, and broader market recovery could serve as primary drivers for price appreciation during this period.
2030-2031 Long-term Outlook
- Baseline scenario: $0.00493 - $0.00868 in 2030 (assuming steady market conditions and continued project development)
- Optimistic scenario: $0.00662 - $0.00996 by 2031 (contingent upon accelerated adoption and favorable regulatory environment)
- Transformative scenario: Beyond $0.00996 (requires breakthrough technological implementations and mainstream integration)
- 2026-01-21: MED trading within the lower bound of its projected range as the token establishes its market position
| Year |
Predicted High Price |
Predicted Average Price |
Predicted Low Price |
Price Change |
| 2026 |
0.00333 |
0.00308 |
0.00163 |
0 |
| 2027 |
0.00452 |
0.0032 |
0.00291 |
3 |
| 2028 |
0.00567 |
0.00386 |
0.00289 |
24 |
| 2029 |
0.00696 |
0.00477 |
0.00276 |
53 |
| 2030 |
0.00868 |
0.00586 |
0.00493 |
88 |
| 2031 |
0.00996 |
0.00727 |
0.00662 |
134 |
IV. MED Professional Investment Strategy and Risk Management
MED Investment Methodology
(I) Long-term Holding Strategy
- Target Investors: Healthcare technology enthusiasts and blockchain believers with moderate to high risk tolerance
- Operational Recommendations:
- Consider accumulating positions during market corrections, focusing on MED's utility within the healthcare data ecosystem
- Monitor key partnerships and adoption metrics within the medical information sector
- Storage Solution: Gate Web3 Wallet offers secure storage options with user-friendly interface for managing MED holdings
(II) Active Trading Strategy
- Technical Analysis Tools:
- Moving Averages: Track 50-day and 200-day moving averages to identify potential trend reversals and momentum shifts
- Volume Analysis: Monitor trading volume patterns alongside price movements, noting MED's 24-hour volume of approximately $98,660
- Swing Trading Considerations:
- MED has shown volatility with 24-hour fluctuations between $0.002862 and $0.003496
- Consider scaling positions during periods of increased market activity in healthcare blockchain sector
MED Risk Management Framework
(I) Asset Allocation Principles
- Conservative Investors: 1-2% of cryptocurrency portfolio
- Aggressive Investors: 3-5% of cryptocurrency portfolio
- Professional Investors: Up to 5-8% with proper hedging strategies
(II) Risk Hedging Solutions
- Diversification Strategy: Balance MED holdings with broader healthcare technology tokens and established cryptocurrencies
- Position Sizing: Implement gradual accumulation strategy rather than single large purchases given MED's market capitalization
(III) Secure Storage Solutions
- Software Wallet Recommendation: Gate Web3 Wallet provides convenient access and robust security features for MED storage
- Cold Storage Option: For substantial holdings, consider hardware wallet solutions with offline key management
- Security Precautions: Enable two-factor authentication, regularly update security protocols, and never share private keys or seed phrases
V. MED Potential Risks and Challenges
MED Market Risks
- Price Volatility: MED experienced a significant decline of approximately 69.65% over the past year, reflecting substantial market volatility
- Limited Exchange Availability: Currently listed on only 4 exchanges, which may impact liquidity and price discovery
- Market Capitalization: With a market cap of approximately $33 million, MED remains a smaller-cap asset subject to higher volatility
MED Regulatory Risks
- Healthcare Data Compliance: Medical information platforms face evolving regulatory requirements across different jurisdictions
- Privacy Regulations: Changes in data protection laws could impact MED's operational model and adoption potential
- Blockchain Healthcare Oversight: Emerging regulatory frameworks for blockchain-based healthcare solutions may affect project development
MED Technical Risks
- Platform Adoption: Success depends on widespread acceptance by medical institutions and healthcare consumers
- Competitive Landscape: Numerous projects target healthcare data management, creating significant competitive pressure
- Technical Integration: Complex integration requirements with existing medical systems may slow adoption rates
VI. Conclusion and Action Recommendations
MED Investment Value Assessment
MediBloc represents a specialized blockchain solution addressing healthcare data management, with focus on patient data ownership and secure information sharing. While the project targets a significant market opportunity in medical information services, investors should note the substantial year-over-year decline and limited exchange presence. The platform's value proposition centers on enabling patient-controlled medical records and facilitating authorized data access for research and treatment purposes. However, the path to widespread adoption faces challenges including regulatory compliance, technical integration complexity, and competition from established healthcare IT solutions.
MED Investment Recommendations
✅ Beginners: Limit exposure to small allocations (1-2% of crypto portfolio) and focus on understanding the healthcare blockchain sector before investing
✅ Experienced Investors: Consider MED as a speculative position within a diversified healthcare technology portfolio, with careful monitoring of adoption metrics
✅ Institutional Investors: Conduct thorough due diligence on regulatory compliance, partnership developments, and competitive positioning before allocation
MED Trading Participation Methods
- Spot Trading: Purchase MED through Gate.com and other supported exchanges with focus on dollar-cost averaging during volatile periods
- Portfolio Strategy: Integrate MED as part of a broader healthcare blockchain thesis alongside complementary assets
- Monitoring Approach: Track project developments, partnership announcements, and regulatory changes affecting healthcare data platforms
Cryptocurrency investment carries extremely high risks. This article does not constitute investment advice. Investors should make prudent decisions based on their own risk tolerance and are advised to consult professional financial advisors. Never invest more than you can afford to lose.
FAQ
What are the methods for predicting MED token prices?
MED price predictions utilize multiple approaches: technical analysis of historical price patterns and trading volume trends, fundamental analysis of project development and adoption metrics, market sentiment indicators, and on-chain data analysis. Combining these methods provides comprehensive price forecasting insights.
What are the main factors affecting MED price?
MED price is primarily influenced by market demand, trading volume, project developments, adoption rate, regulatory changes, and overall cryptocurrency market sentiment. Positive ecosystem growth and partnerships typically drive price appreciation.
What are the risks and limitations of MED price predictions?
MED price predictions face limitations including market volatility, limited historical data, and unpredictable external factors affecting cryptocurrency markets. Predictions rely on technical analysis and on-chain metrics, which may not capture sudden regulatory changes or market sentiment shifts. Past performance doesn't guarantee future results.
How to analyze MED's historical price trends and technical aspects?
Analyze MED's price trends using candlestick charts and moving averages. Monitor trading volume and liquidity levels. Apply technical indicators like RSI and MACD to identify momentum. Track support/resistance levels and chart patterns for entry/exit signals.
How does MED's price outlook compare to other medical tokens?
MED demonstrates strong fundamentals with growing adoption in decentralized healthcare. Its tokenomics and ecosystem development position it favorably against competitors. With increasing institutional interest and real-world healthcare integration, MED shows promising long-term appreciation potential in the medical token sector.
What are professional institutions' price predictions for MED?
Multiple crypto analysts project MED could reach $0.50-$2.00 by end of 2026, depending on market adoption and ecosystem growth. However, predictions vary significantly based on different fundamental and technical analyses.
* The information is not intended to be and does not constitute financial advice or any other recommendation of any sort offered or endorsed by Gate.