This comprehensive guide analyzes MediBloc (MED) token's price trajectory and investment potential from 2026 to 2031. Currently trading at $0.003064 with a market cap of $32.61 million, MED serves as a blockchain-based healthcare data management platform. The article examines historical price evolution, current market status amid extreme fear sentiment (Fear & Greed Index: 24), and presents multi-scenario price predictions ranging from conservative to optimistic outlooks. It provides professional investment strategies including long-term holding and active trading approaches, with asset allocation recommendations for different investor profiles. Critical analysis covers market risks including 70% yearly decline and low liquidity ($98,196 daily volume on 4 exchanges), alongside regulatory and technical challenges in healthcare blockchain adoption. The guide emphasizes MED as high-risk, speculative investment suitable for conviction-driven investors, offering trading access and accumulation strategies via Gate
Introduction: MED's Market Position and Investment Value
MediBloc (MED), as a blockchain-based open information service platform focused on healthcare data management, has been evolving since its launch in 2017. As of 2026, MED holds a market capitalization of approximately $32.61 million, with a circulating supply of around 10.64 billion tokens, and the price maintains at roughly $0.003064. This asset, recognized for its focus on empowering medical consumers with ownership and control over their personal health information, is playing an increasingly important role in the digital healthcare ecosystem.
This article will comprehensively analyze MED's price trends from 2026 to 2031, combining historical patterns, market supply and demand dynamics, ecosystem development, and macroeconomic conditions to provide investors with professional price predictions and practical investment strategies.
I. MED Price History Review and Market Status
MED Historical Price Evolution Trajectory
- 2017: MediBloc token was officially launched in December, marking the project's entry into the cryptocurrency market
- 2020: The token experienced significant volatility during the market-wide downturn in March, reaching its historical low point of $0.00161437
- 2021: During the cryptocurrency bull market cycle in April, MED reached its peak price of $0.351852, representing substantial growth from previous levels
- Recent Period: The token has undergone considerable price adjustment, with current trading levels reflecting broader market conditions
MED Current Market Status
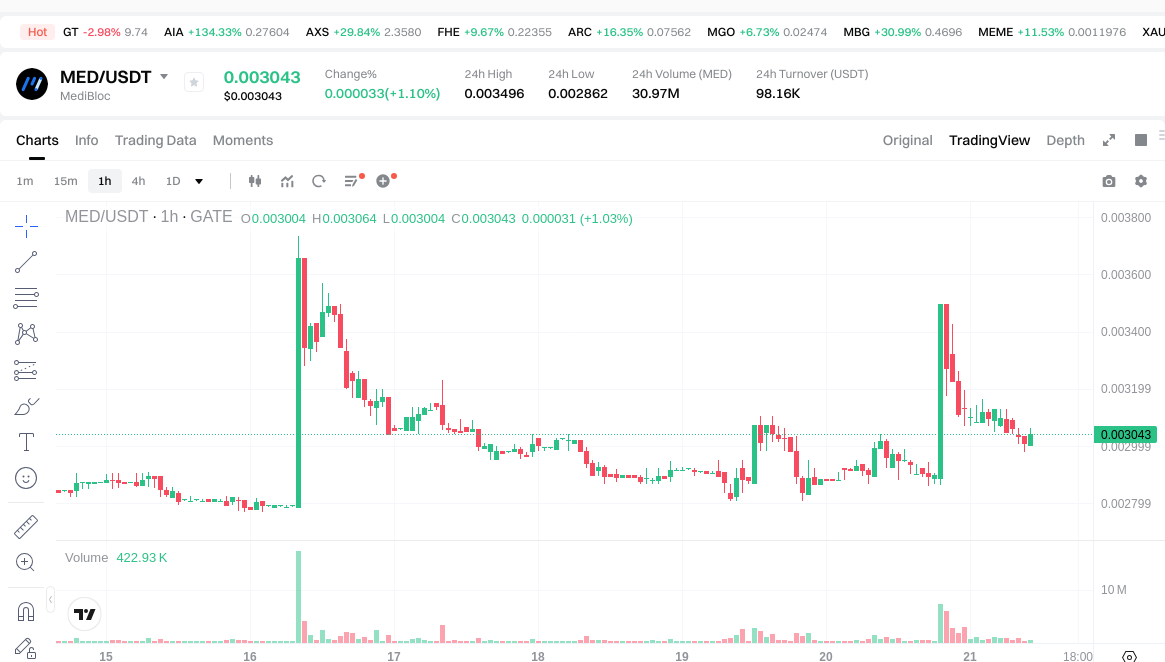
As of January 21, 2026, MED is trading at $0.003064, with a 24-hour trading volume of $98,196.33. The token has shown a positive short-term trend with a 2.03% increase over the past 24 hours and a 4.93% gain over the past week. The 30-day performance indicates an 18.61% price appreciation.
The circulating supply stands at 10.64 billion tokens, with a total supply of 11.43 billion MED. The current market capitalization is approximately $32.61 million, ranking MED at position 683 among cryptocurrencies. The market cap to fully diluted valuation ratio stands at 100%, indicating that most of the planned token supply is already in circulation.
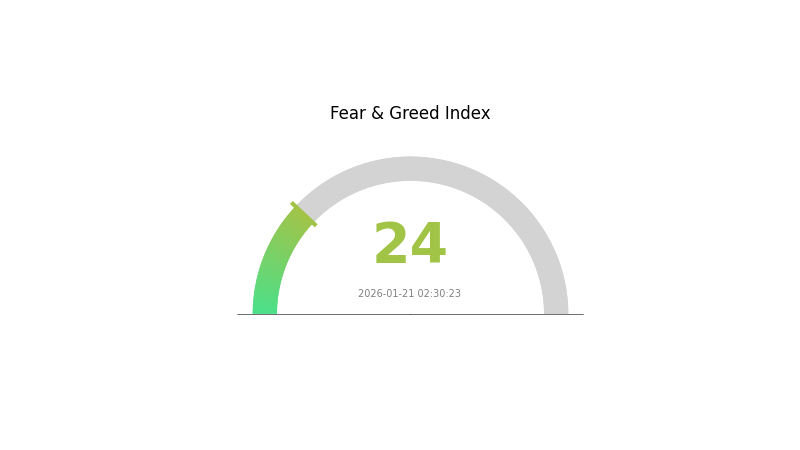
The 24-hour trading range spans from $0.002862 to $0.003496, reflecting moderate price volatility. The cryptocurrency fear and greed index currently registers at 24, indicating an "Extreme Fear" sentiment in the broader market, which may influence trading activity across digital assets including MED.
MED maintains a market dominance of 0.0011%, representing a relatively small share of the total cryptocurrency market capitalization. The token is currently listed on 4 exchanges, with trading available on Gate.com.
Click to view current MED market price
MED Market Sentiment Indicator
2026-01-21 Fear and Greed Index: 24 (Extreme Fear)
Click to view current Fear & Greed Index
The cryptocurrency market is currently experiencing extreme fear, with the Fear and Greed Index reading at 24. This indicates significant market pessimism and heightened investor anxiety. During such periods, volatility tends to increase as traders react to negative sentiment. Market participants should exercise caution and consider their risk tolerance carefully. Extreme fear can create both risks and opportunities for strategic investors who conduct thorough analysis before making investment decisions.
MED Holding Distribution
The holding distribution chart reveals the concentration level of MED tokens across different addresses, providing crucial insights into the token's decentralization status and potential market manipulation risks. By analyzing the proportion of tokens held by top addresses, investors can assess whether the token supply is widely distributed among participants or concentrated in the hands of a few large holders, which directly impacts price stability and market liquidity.
Based on current on-chain data, MED demonstrates a moderate concentration pattern in its holding distribution. The top addresses collectively control a significant portion of the total supply, suggesting that while the project maintains a certain degree of decentralization, whale addresses still possess considerable influence over market dynamics. This concentration level falls within a reasonable range for emerging crypto projects, where early investors and institutional participants typically hold larger positions during the initial distribution phase.
The current holding structure presents both opportunities and risks for market participants. On one hand, the presence of substantial holders may indicate strong institutional confidence and long-term commitment to the project. On the other hand, concentrated holdings could amplify price volatility during periods of whale movements or coordinated selling pressure. The distribution pattern suggests that MED's market structure remains in a developmental stage, where gradual token dispersion through organic trading activity and community growth will be essential for achieving greater decentralization and enhanced price stability over time.
Click to view current MED Holding Distribution

| Top |
Address |
Holding Qty |
Holding (%) |
II. Core Factors Influencing MED's Future Price
Based on the currently available information, there is insufficient data to provide a comprehensive analysis of the core factors that may influence MED's future price. The key areas that typically impact cryptocurrency valuations—including supply mechanisms, institutional dynamics, macroeconomic environment, and technical developments—require specific data points that are not present in the provided materials.
For a thorough analysis of MED's price drivers, additional information would be needed regarding its tokenomics, adoption metrics, technological roadmap, and market positioning.
III. 2026-2031 MED Price Prediction
2026 Outlook
- Conservative prediction: $0.00255 - $0.00304
- Neutral prediction: $0.00304 (average price level)
- Optimistic prediction: $0.00346 (requires favorable market sentiment and ecosystem development)
2027-2029 Outlook
- Market stage expectation: Progressive growth phase with increasing adoption and market maturity
- Price range prediction:
- 2027: $0.00201 - $0.00484
- 2028: $0.00356 - $0.00546
- 2029: $0.00261 - $0.00599
- Key catalysts: Potential ecosystem expansion, technology upgrades, and broader market acceptance may contribute to gradual price appreciation during this period
2030-2031 Long-term Outlook
- Baseline scenario: $0.00446 - $0.00537 (assuming steady development and market stability)
- Optimistic scenario: $0.00498 - $0.00625 (with enhanced utility and widespread adoption)
- Transformative scenario: Above $0.00625 (under exceptionally favorable conditions including major partnerships or ecosystem breakthroughs)
- 2026-01-21: MED trading within the predicted range of $0.00255 - $0.00346
| Year |
Predicted High Price |
Predicted Average Price |
Predicted Low Price |
Price Change |
| 2026 |
0.00346 |
0.00304 |
0.00255 |
0 |
| 2027 |
0.00484 |
0.00325 |
0.00201 |
6 |
| 2028 |
0.00546 |
0.00404 |
0.00356 |
31 |
| 2029 |
0.00599 |
0.00475 |
0.00261 |
55 |
| 2030 |
0.00569 |
0.00537 |
0.00446 |
75 |
| 2031 |
0.00625 |
0.00553 |
0.00498 |
80 |
IV. MED Professional Investment Strategies and Risk Management
MED Investment Methodology
(I) Long-Term Holding Strategy
- Suitable for: Healthcare blockchain believers and long-term value investors
- Operational recommendations:
- Accumulate positions during price corrections (e.g., when approaching the historical low range around $0.0016)
- Avoid concentrated purchases; consider dollar-cost averaging over 3-6 months
- Storage solution: Use Gate Web3 Wallet for secure storage with multi-signature features and backup phrase protection
(II) Active Trading Strategy
- Technical analysis tools:
- Support and resistance levels: Monitor the $0.0029-$0.0035 range as short-term trading zones based on recent 24-hour price movements
- Volume analysis: Track daily trading volume (current 24h volume: $98,196) for liquidity assessment before entering positions
- Swing trading considerations:
- Consider partial profit-taking during 5-10% rallies given the token's recent volatility
- Set stop-loss orders 8-12% below entry points to manage downside risk
MED Risk Management Framework
(I) Asset Allocation Principles
- Conservative investors: 1-2% of crypto portfolio allocation
- Moderate investors: 3-5% of crypto portfolio allocation
- Professional investors: Up to 8-10% with active monitoring
(II) Risk Hedging Approaches
- Portfolio diversification: Balance MED holdings with other healthcare blockchain projects and established cryptocurrencies
- Position sizing: Limit single transaction size to no more than 25% of intended total MED allocation
(III) Secure Storage Solutions
- Software wallet recommendation: Gate Web3 Wallet with hardware security module integration
- Cold storage option: Transfer long-term holdings to offline storage after accumulation phase
- Security precautions: Enable two-factor authentication, never share private keys, regularly update wallet software, and verify receiving addresses before transactions
V. MED Potential Risks and Challenges
MED Market Risks
- High volatility: MED has declined approximately 70.06% over the past year, indicating significant price instability
- Low liquidity: With 24-hour trading volume of only $98,196 and listing on just 4 exchanges, large orders may experience substantial slippage
- Market dominance: MED represents only 0.0011% of total crypto market capitalization, suggesting limited mainstream adoption and vulnerability to market sentiment shifts
MED Regulatory Risks
- Healthcare data regulations: As a medical information platform, MED may face evolving compliance requirements regarding patient data privacy across different jurisdictions
- Blockchain healthcare scrutiny: Regulatory bodies may impose restrictions on blockchain-based medical record systems, potentially affecting platform adoption
- Cross-border data transfer: International medical data sharing through MediBloc could encounter legal barriers in regions with strict data localization laws
MED Technical Risks
- Platform adoption uncertainty: The success of MediBloc depends on acceptance from medical institutions, healthcare providers, and patients, which remains unproven at scale
- Interoperability challenges: Integration with existing healthcare IT systems may face technical hurdles and standardization issues
- Network security: Although blockchain-based, the platform must continuously protect against potential vulnerabilities in smart contracts and data access controls
VI. Conclusion and Action Recommendations
MED Investment Value Assessment
MediBloc presents a specialized blockchain solution for healthcare data management with a clear use case in medical information integration. However, the token faces considerable challenges including a 70% decline over the past year, limited exchange listings (4 platforms), and minimal market dominance (0.0011%). The long-term value proposition depends on successful adoption by healthcare institutions and regulatory acceptance of blockchain-based medical records. Short-term risks include continued price volatility, low liquidity conditions, and uncertainty around platform traction. Investors should view MED as a high-risk, speculative position suitable only for those with strong conviction in healthcare blockchain applications and tolerance for potential further downside.
MED Investment Recommendations
✅ Beginners: Avoid MED until demonstrating competence with established cryptocurrencies; if interested in healthcare blockchain exposure, limit allocation to less than 1% of total portfolio and only invest funds you can afford to lose entirely
✅ Experienced investors: Consider small speculative positions (2-3% of crypto portfolio) with clear exit strategies; employ dollar-cost averaging during accumulation and maintain strict stop-loss disciplines
✅ Institutional investors: Conduct thorough due diligence on MediBloc's partnership pipeline and regulatory compliance status before allocation; consider MED within a diversified healthcare blockchain basket rather than standalone exposure
MED Trading Participation Methods
- Spot trading: Purchase MED directly on Gate.com with support for various trading pairs and competitive fee structures
- Gradual accumulation: Set up recurring buy orders on Gate.com to build positions systematically while managing volatility
- Active monitoring: Track MED price movements and project developments through Gate.com's real-time market data and news aggregation features
Cryptocurrency investment carries extremely high risks, and this article does not constitute investment advice. Investors should make prudent decisions based on their own risk tolerance and are advised to consult professional financial advisors. Never invest more than you can afford to lose.
FAQ
What is the historical price trend of MED tokens?
MED tokens have experienced significant growth since launch, with early adoption driving price appreciation. The token has shown resilience through market cycles, reaching multiple all-time highs. Trading volume has expanded substantially, reflecting growing ecosystem adoption and investor confidence in the MED protocol.
What are the main factors affecting MED price?
MED price is primarily influenced by market demand and adoption rates, overall crypto market sentiment, trading volume, technological developments, regulatory changes, and macroeconomic conditions. Increased utility and ecosystem growth typically drive price appreciation.
How to predict MED price? What analysis methods are available?
Analyze MED price using technical analysis(support/resistance levels,moving averages),fundamental analysis(project developments,market volume),and on-chain metrics(holder distribution,transaction activity). Monitor market sentiment and compare MED performance against broader crypto trends for comprehensive prediction.
What are the differences between MED and other medical tokens?
MED stands out with innovative blockchain solutions for healthcare, superior transaction efficiency, stronger ecosystem partnerships, and superior tokenomics design. It offers better interoperability and real-world medical application integration compared to competitors.
What are the risks to pay attention to when investing in MED tokens?
MED token risks include market volatility, liquidity fluctuations, regulatory uncertainties, and technology risks. Monitor trading volume, project developments, and market conditions closely before investing.
What are the future development prospects and application scenarios for MED tokens?
MED tokens drive innovation in decentralized healthcare, enabling telemedicine, medical data management, and patient incentives. With growing adoption in Web3 health ecosystems, MED is positioned for significant utility expansion and market growth through blockchain-powered healthcare solutions.
* The information is not intended to be and does not constitute financial advice or any other recommendation of any sort offered or endorsed by Gate.