This comprehensive METFI price prediction guide analyzes MetFi DAO's market trajectory from 2026 through 2031, combining historical price data, market sentiment analysis, and tokenomics insights. The article addresses investor needs by providing conservative to optimistic price forecasts, ranging from $0.03267 to $0.1244, alongside professional investment strategies for different investor profiles. Readers will discover long-term holding approaches, active trading methodologies, and robust risk management frameworks tailored to crypto market dynamics. The guide systematically examines METFI's current $0.05445 valuation, extreme market concentration risks, regulatory challenges, and security considerations. Ideal for Web3 enthusiasts, venture capital participants, and crypto traders on Gate.com seeking data-driven METFI investment decisions with practical portfolio allocation recommendations.
Introduction: METFI's Market Position and Investment Value
MetFi DAO (METFI), positioned as the world's first DeFi utility NFT ecosystem focused on investing and incubating Metaverse and Web3 unicorns, has been working to democratize early-stage venture capital access since its launch. As of January 2026, METFI maintains a market capitalization of approximately $15.10 million, with a circulating supply of around 277.31 million tokens and a current price hovering near $0.05445. This asset, recognized as a "community-owned investment vehicle," is playing an increasingly important role in bridging retail investors with promising Web3 and Metaverse startup opportunities.
Currently ranked #1003 in the cryptocurrency market with over 19,000 holders, METFI represents a unique approach to venture capital through its DAO structure, where 100% of investment assets are owned and allocated by the MetFi community. The project has implemented security measures including a 2-year liquidity lock and has received recognition from Certik as a top 5% blockchain project. With a fully diluted market cap of approximately $24.52 million and a maximum supply capped at 500 million tokens, METFI operates with a circulating ratio of about 55.46%.
This article will comprehensively analyze METFI's price trends from 2026 through 2031, combining historical patterns, market supply and demand dynamics, ecosystem development, and macroeconomic conditions to provide investors with professional price forecasts and practical investment strategies.
I. METFI Price History Review and Market Status
METFI Historical Price Evolution Trajectory
- 2023: METFI reached its all-time high of $3.48 on May 9, marking a significant milestone in the project's early development phase
- 2024-2025: The token experienced a substantial market correction period, with price declining significantly from previous levels
- 2025: On October 17, METFI recorded its all-time low of $0.04744, reflecting broader market challenges and investor sentiment shifts
METFI Current Market Situation
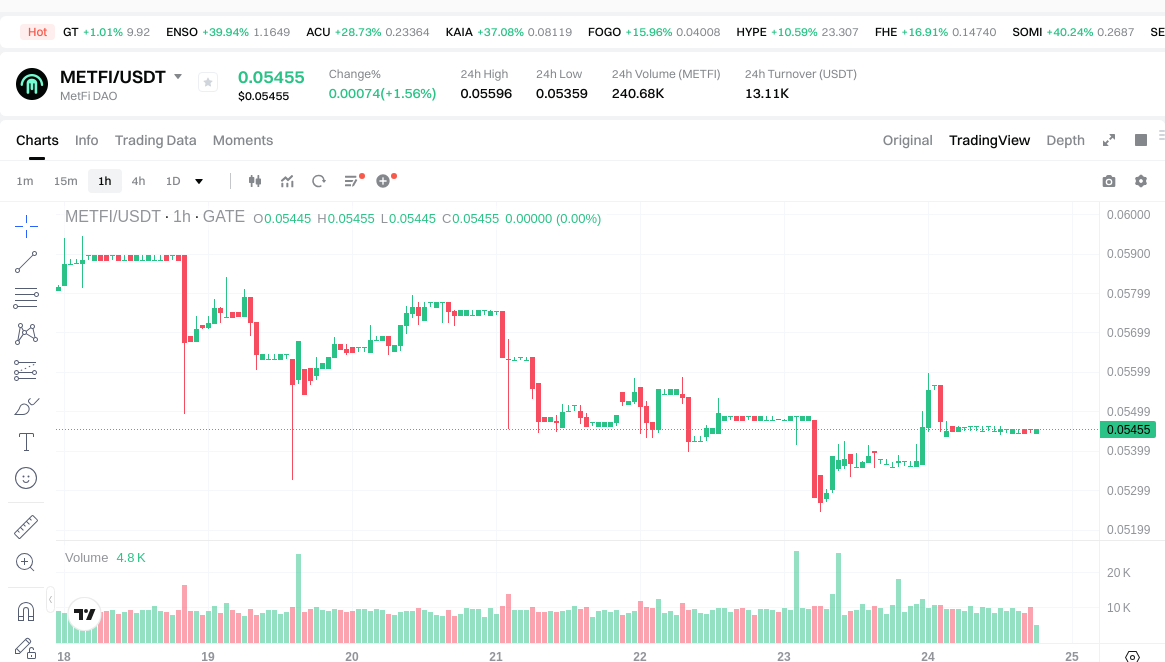
As of January 24, 2026, METFI is trading at $0.05445, showing a 24-hour price increase of 1.79%. The token's intraday range spans from $0.05359 to $0.05596, indicating moderate volatility within the session.
The current market capitalization stands at approximately $15.10 million, with a circulating supply of 277.31 million METFI tokens representing 55.46% of the maximum supply of 500 million tokens. The fully diluted market cap reaches $24.52 million. Trading volume over the past 24 hours amounts to $13,110.72, suggesting relatively modest market activity.
From a longer-term perspective, METFI has experienced notable price fluctuations. The 7-day performance shows a decline of 7.13%, while the 30-day trend indicates a decrease of 15.04%. The 1-year performance reflects an 88.62% decline from previous levels, positioning the current price approximately 98.44% below the historical peak.
The token maintains a market dominance of 0.00077% and is held by 19,307 addresses. MetFi DAO has implemented a 2-year liquidity lock mechanism and has received recognition from Certik, ranking among the top 5% of audited projects on their platform.
Click to view current METFI market price
METFI Market Sentiment Indicator
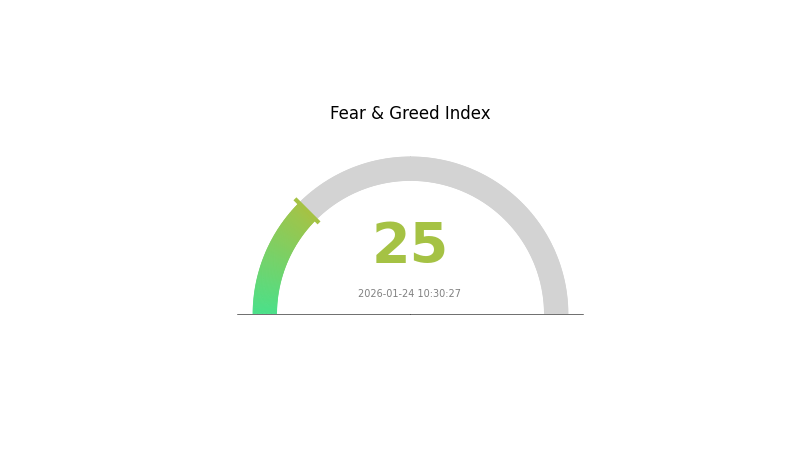
2026-01-24 Fear and Greed Index: 25 (Extreme Fear)
Click to view current Fear & Greed Index
The crypto market is currently experiencing extreme fear, with the Fear and Greed Index registering at 25. This significant decline reflects heightened investor anxiety and risk aversion across the digital asset space. During periods of extreme fear, market volatility typically increases as participants reassess their positions. However, historically, such extreme sentiment levels have often presented opportunities for contrarian investors. On Gate.com, you can monitor real-time market sentiment indicators to make more informed trading decisions and stay ahead of market movements during this volatile period.
METFI Holding Distribution
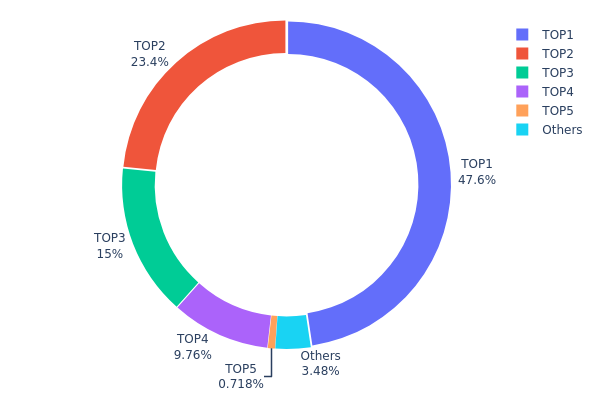
The holding distribution chart illustrates the allocation of METFI tokens across different wallet addresses, reflecting the degree of decentralization within the token's ownership structure. This metric serves as a crucial indicator of market concentration risk and potential price manipulation vulnerabilities.
According to the current data, METFI exhibits a highly concentrated holding pattern. The top five addresses collectively control 450,558.78K tokens, representing 96.47% of the total supply. Notably, the largest address (0x0ede...8465b5) holds 214,403.86K tokens, accounting for 47.61% of the total supply alone. The second and third addresses maintain 23.36% and 15.04% respectively, while the remaining addresses outside the top five hold merely 3.53% of the total supply. This distribution pattern reveals an extreme concentration of tokens among a small number of entities.
Such a centralized holding structure poses significant implications for market dynamics. The dominance of a few large holders creates substantial price volatility risks, as any significant selling activity from these addresses could trigger sharp market movements. Additionally, this concentration level raises concerns about potential market manipulation, as major holders possess sufficient influence to impact token price through coordinated actions. The minimal distribution among smaller addresses suggests limited retail participation and weak decentralization characteristics, which may hinder organic market development and liquidity. From a blockchain governance perspective, this structure indicates a centralized control mechanism that deviates from typical decentralized cryptocurrency principles, potentially affecting long-term project credibility and market confidence.
Click to view current METFI Holding Distribution
| Top |
Address |
Holding Qty |
Holding (%) |
| 1 |
0x0ede...8465b5 |
214403.86K |
47.61% |
| 2 |
0x5950...7d9b89 |
105216.85K |
23.36% |
| 3 |
0xd824...3aa72d |
67759.95K |
15.04% |
| 4 |
0xf350...d3c2f8 |
43943.53K |
9.75% |
| 5 |
0x4303...7c82f6 |
3234.59K |
0.71% |
| - |
Others |
15686.08K |
3.53% |
II. Core Factors Affecting METFI's Future Price
Based on the available information, there is insufficient data to provide a comprehensive analysis of the core factors affecting METFI's future price. The provided materials do not contain specific details regarding supply mechanisms, institutional holdings, macroeconomic influences, or technical developments related to METFI.
Without access to concrete data about METFI's tokenomics, institutional adoption, policy environment, or ecosystem developments, it would be inappropriate to speculate on these factors. A thorough analysis requires verifiable information about the project's fundamentals and market dynamics.
III. 2026-2031 METFI Price Prediction
2026 Outlook
- Conservative Forecast: $0.03267 - $0.05445
- Neutral Forecast: $0.05445 (average scenario)
- Optimistic Forecast: Up to $0.08004 (requires favorable market conditions and strong adoption momentum)
2027-2029 Outlook
- Market Stage Expectations: METFI is projected to enter a gradual growth phase, with price momentum building as the cryptocurrency market matures and broader adoption potentially increases.
- Price Range Predictions:
- 2027: $0.03967 - $0.08742, representing approximately 23% growth from 2026 baseline
- 2028: $0.07192 - $0.08739, showing 42% cumulative increase with tightening price volatility
- 2029: $0.07412 - $0.10048, reaching 51% growth trajectory
- Key Catalysts: Sustained market recovery, potential ecosystem developments, increased trading volume on platforms like Gate.com, and broader DeFi integration could serve as primary growth drivers.
2030-2031 Long-term Outlook
- Baseline Scenario: $0.05942 - $0.10605 (assuming steady market conditions and moderate adoption rates)
- Optimistic Scenario: $0.08294 - $0.1244 (contingent on strong ecosystem expansion and favorable regulatory environment)
- Transformative Scenario: Potentially reaching $0.1244 by 2031 (requires exceptional market conditions, significant technological breakthroughs, and widespread institutional adoption)
- January 24, 2026: METFI trading within initial predicted range as market participants assess long-term potential
| Year |
Predicted High Price |
Predicted Average Price |
Predicted Low Price |
Price Change |
| 2026 |
0.08004 |
0.05445 |
0.03267 |
0 |
| 2027 |
0.08742 |
0.06725 |
0.03967 |
23 |
| 2028 |
0.08739 |
0.07733 |
0.07192 |
42 |
| 2029 |
0.10048 |
0.08236 |
0.07412 |
51 |
| 2030 |
0.10605 |
0.09142 |
0.05942 |
67 |
| 2031 |
0.1244 |
0.09873 |
0.08294 |
81 |
IV. METFI Professional Investment Strategy and Risk Management
METFI Investment Methodology
(1) Long-term Holding Strategy
- Target Investors: Web3 and Metaverse enthusiasts, early-stage venture capital participants, and investors seeking exposure to decentralized investment tools
- Operational Recommendations:
- Consider accumulating positions during market corrections, given the token's historical volatility
- Monitor MetFi DAO's investment portfolio developments and partnership announcements for long-term value assessment
- Utilize Gate Web3 Wallet for secure storage with BSC network compatibility
(2) Active Trading Strategy
- Technical Analysis Tools:
- Volume Analysis: Track the 24-hour trading volume of approximately $13,110 to identify liquidity patterns
- Price Range Indicators: Monitor the recent 24-hour range between $0.05359 and $0.05596 for short-term trading opportunities
- Swing Trading Key Points:
- Consider the token's 7-day decline of 7.13% when evaluating entry points
- Be aware of the 30-day downward trend of 15.04% when planning position sizing
METFI Risk Management Framework
(1) Asset Allocation Principles
- Conservative Investors: 1-3% of crypto portfolio
- Aggressive Investors: 3-7% of crypto portfolio
- Professional Investors: 5-10% of crypto portfolio with active management
(2) Risk Hedging Solutions
- Portfolio Diversification: Balance METFI holdings with other Web3 and Metaverse tokens to reduce sector-specific risk
- Position Sizing: Limit individual position exposure considering the token's year-over-year decline of 88.62%
(3) Secure Storage Solutions
- Software Wallet Recommendation: Gate Web3 Wallet with BSC network support
- Multi-signature Approach: For larger holdings, consider implementing multi-signature wallet solutions
- Security Precautions: Verify contract address (0x3e7f1039896454b9cb27c53cc7383e1ab9d9512a) before any transactions, enable two-factor authentication, and never share private keys
V. METFI Potential Risks and Challenges
METFI Market Risks
- Price Volatility: The token has experienced substantial price fluctuations, with a current price of $0.05445 significantly below its historical high of $3.48
- Liquidity Concerns: With a 24-hour trading volume of approximately $13,110, relatively low liquidity may impact large order execution
- Market Capitalization: The token's market cap of approximately $15.1 million represents a relatively small market presence, which may contribute to price instability
METFI Regulatory Risks
- DAO Structure Compliance: As regulatory frameworks for decentralized autonomous organizations continue to evolve globally, potential changes may impact MetFi DAO's operational model
- Investment Vehicle Classification: The project's positioning as a decentralized investment tool may face scrutiny under securities regulations in various jurisdictions
- Cross-border Investment Regulations: The project's focus on early-stage investment access may encounter regulatory challenges in different markets
METFI Technical Risks
- Smart Contract Vulnerabilities: Despite Certik auditing and ranking the project in the top 5%, smart contract risks remain inherent in blockchain-based platforms
- Platform Dependency: The token operates on the BSC network, making it subject to the underlying blockchain's performance and security considerations
- Project Execution Risk: The ambitious goal of becoming a leading Metaverse and Web3 incubator faces competitive and operational challenges
VI. Conclusion and Action Recommendations
METFI Investment Value Assessment
MetFi DAO presents itself as a decentralized investment platform targeting early-stage Web3 and Metaverse opportunities. The project's unique value proposition lies in democratizing access to seed-round investments traditionally reserved for venture capital firms. With liquidity locked for two years and Certik's security assessment, the project demonstrates certain structural safeguards. However, the token's performance shows significant challenges, with an 88.62% decline over the past year and a current price substantially below historical levels. The relatively low trading volume and market capitalization indicate limited market participation. While the concept of community-owned investment allocation is innovative, investors should carefully weigh the execution risks against the long-term vision.
METFI Investment Recommendations
✅ Beginners: Avoid allocation until gaining substantial experience with crypto markets; if interested, limit exposure to less than 1% of total crypto portfolio and prioritize learning about DAO structures
✅ Experienced Investors: Consider small speculative positions not exceeding 3-5% of crypto portfolio; monitor project developments and investment portfolio performance closely before increasing exposure
✅ Institutional Investors: Conduct comprehensive due diligence on the project's investment strategy, governance structure, and regulatory compliance before considering participation; evaluate alignment with institutional risk parameters
METFI Trading Participation Methods
- Spot Trading: Access METFI through Gate.com's spot trading platform with BSC network support
- Dollar-Cost Averaging: For long-term believers, implement systematic purchase strategies to mitigate timing risk in volatile conditions
- Portfolio Integration: Combine with other Web3 and Metaverse tokens for sector diversification within crypto holdings
Cryptocurrency investment carries extremely high risks, and this article does not constitute investment advice. Investors should make prudent decisions based on their own risk tolerance and are advised to consult professional financial advisors. Never invest more than you can afford to lose.
FAQ
What is METFI? What are its basic functions and uses?
METFI is a decentralized platform offering cryptocurrency price prediction tools and analytics. It enables users to forecast market movements, access real-time data, and participate in prediction markets. The platform combines AI-driven insights with community intelligence to help traders make informed decisions in the crypto market.
What are the main factors affecting METFI price?
METFI price is influenced by market demand, trading volume, overall crypto market sentiment, project development progress, token utility adoption, and macroeconomic conditions affecting the broader digital asset ecosystem.
What is the METFI price prediction for 2024-2025?
Based on market analysis and growth trends, METFI is projected to reach $0.50-$1.20 range during 2024-2025, driven by increased adoption and ecosystem expansion within the metaverse sector.
How to conduct technical analysis and price prediction for METFI?
Analyze METFI's price trends using candlestick charts, moving averages, and RSI indicators. Monitor trading volume and support/resistance levels. Track market sentiment and on-chain metrics for comprehensive technical forecasting.
What are the risks of investing in METFI? How large are typical price fluctuations?
METFI exhibits moderate volatility typical of emerging crypto assets. Daily fluctuations range 5-15%, with potential 20-30% swings during market cycles. Risk factors include market sentiment shifts, regulatory changes, and liquidity variations. Long-term holders have historically seen positive trends despite short-term volatility.
How does METFI's price potential and prospects compare to other mainstream tokens?
METFI demonstrates strong growth potential with its innovative DeFi ecosystem and expanding user base. Compared to mainstream tokens, METFI offers unique value through advanced prediction mechanisms and community-driven development. Early indicators suggest significant upside potential as adoption accelerates and transaction volume grows substantially.
* The information is not intended to be and does not constitute financial advice or any other recommendation of any sort offered or endorsed by Gate.