This comprehensive article analyzes Mitosis (MITO), a cross-chain liquidity protocol, providing expert price forecasts from 2026 to 2031 for investors. Currently trading at $0.067 with a $13.1 million market cap, MITO serves the DeFi ecosystem by enabling liquidity provision across Ethereum L1 and L2 networks. The article examines market history, current sentiment (extreme fear at index 25), and highly concentrated token distribution, then presents tiered price predictions ranging from conservative to optimistic scenarios. It delivers actionable investment strategies including long-term holding and active trading approaches, establishes risk management frameworks for different investor types, and thoroughly addresses volatility, liquidity, regulatory, and technical risks. Professional recommendations guide beginners through institutional investors on optimal allocation percentages and trading methods on Gate, emphasizing that crypto investment carries extreme risks requiring careful due diligence.
Introduction: MITO's Market Position and Investment Value
Mitosis (MITO) serves as a liquidity protocol for the modular era, focusing on redefining cross-chain liquidity solutions. Since its launch in 2025, the project has established itself within the decentralized finance ecosystem by enabling cross-chain liquidity provision through derivative tokens. As of 2026, MITO maintains a market capitalization of approximately $13.1 million, with a circulating supply of around 196.27 million tokens, and the price hovering around $0.067. This asset, recognized as an innovative cross-chain liquidity solution, is playing an increasingly relevant role in the DeFi landscape by allowing liquidity providers to utilize their locked assets across various applications on Ethereum L1 and L2 rollups.
This article will comprehensively analyze MITO's price trends from 2026 through 2031, combining historical patterns, market supply-demand dynamics, ecosystem development, and macroeconomic conditions to provide investors with professional price forecasts and practical investment strategies.
I. MITO Price History Review and Market Status
MITO Historical Price Evolution Trajectory
- 2025: MITO launched in early 2025, with price reaching $0.45 in September 2025
- 2025: Price experienced significant volatility, declining from $0.45 to $0.05 by October 2025
- 2025-2026: The token underwent a consolidation phase, with price movements reflecting broader market conditions
MITO Current Market Situation
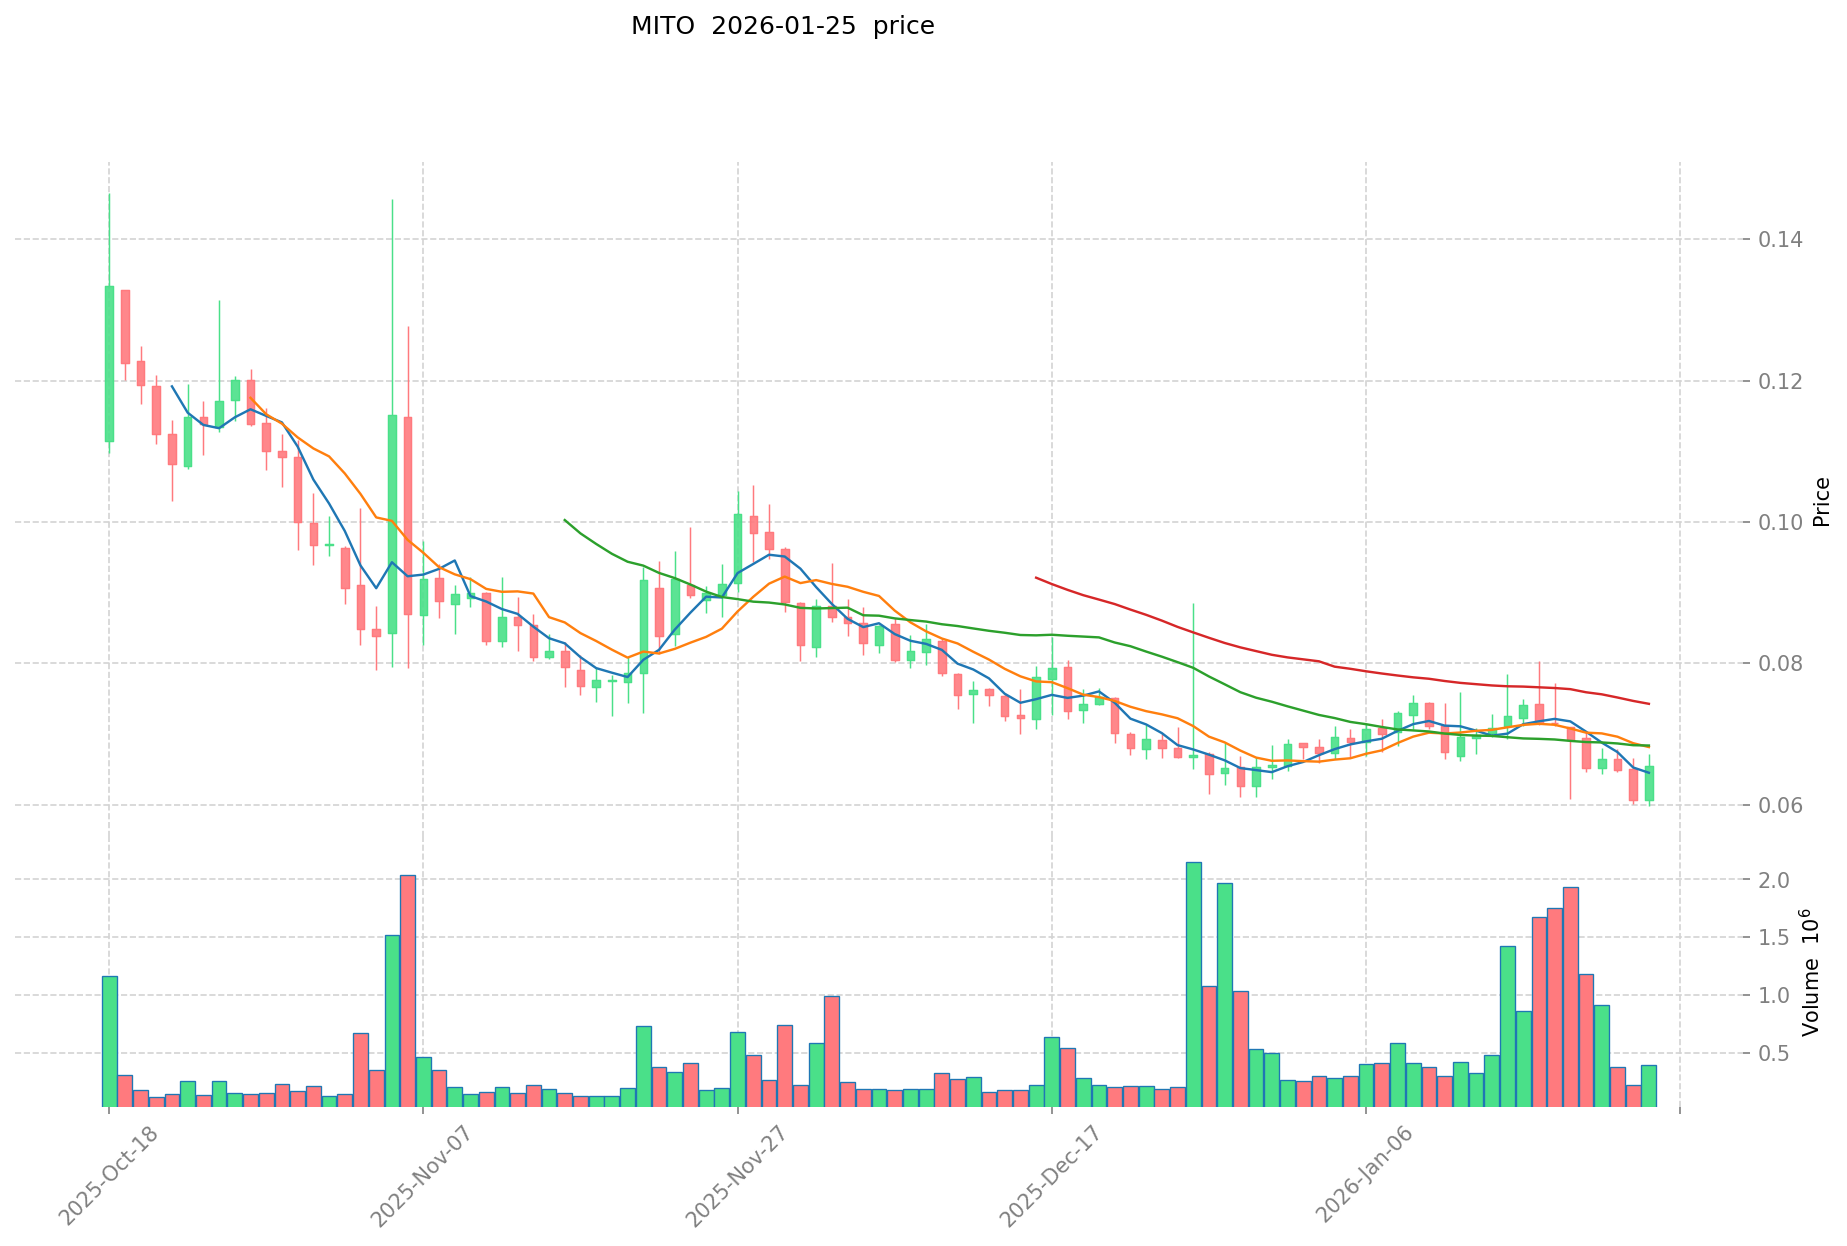
As of January 25, 2026, MITO is trading at $0.06672, showing an 11.41% increase over the past 24 hours. The token has demonstrated positive momentum with a 2.82% gain in the last hour and a 1.18% increase over the past 30 days. However, the 7-day performance shows a decline of 5.58%.
The current trading range for MITO spans from $0.05977 to $0.06754 within the 24-hour period. The token maintains a market capitalization of approximately $13.1 million, with 196.3 million tokens in circulation, representing 19.63% of the total supply of 1 billion tokens. The fully diluted market capitalization stands at $66.72 million.
MITO's 24-hour trading volume reaches $25,425.72, with the token currently listed on 18 exchanges. The project has attracted 75,125 token holders. Market sentiment indicators show a value of 25, suggesting cautious market conditions.
Click to view current MITO market price
MITO Market Sentiment Indicator
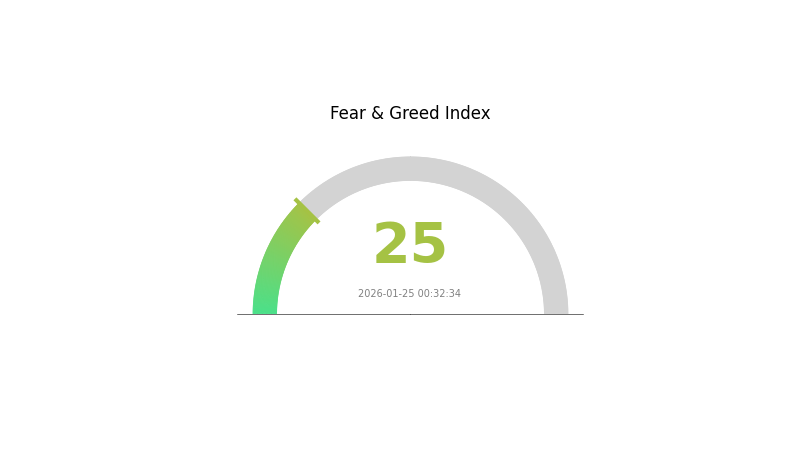
2026-01-25 Fear and Greed Index: 25 (Extreme Fear)
Click to view current Fear & Greed Index
The crypto market is experiencing extreme fear, with the Fear and Greed Index at 25. This indicates strong market pessimism and risk aversion among investors. During periods of extreme fear, assets are typically oversold, presenting potential opportunities for long-term investors with higher risk tolerance. However, caution is advised, as the market remains volatile. Consider dollar-cost averaging strategies and maintain adequate risk management. Monitor market developments closely before making investment decisions on Gate.com.
MITO Holding Distribution
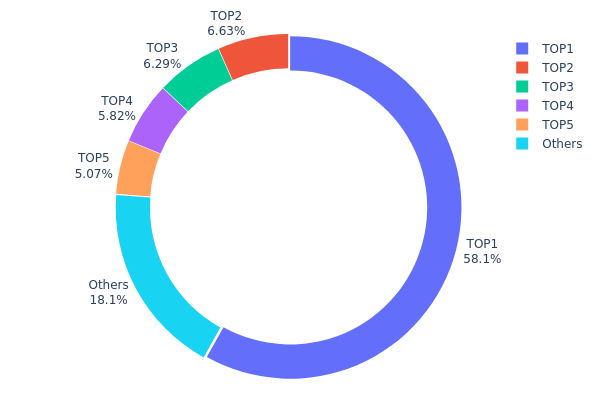
According to the on-chain data, MITO's holding distribution exhibits significant concentration characteristics. The top-ranked address holds 30 million tokens, accounting for 58.08% of the total supply, demonstrating an extremely high degree of centralization. The holdings of the second through fifth addresses range from 2.62 million to 3.42 million tokens, with individual holding percentages between 5.07% and 6.62%. Collectively, the top five addresses control approximately 81.87% of the total supply, while other addresses combined hold only 18.13%.
This highly concentrated holding structure indicates that MITO's on-chain distribution has not yet achieved effective decentralization. The dominant position of the largest holder grants it substantial influence over market supply and demand dynamics, potentially leading to significant price volatility during large-scale sell-offs or transfers. Additionally, the concentration of holdings among the top five addresses may increase the risk of coordinated actions, adversely affecting the fairness and transparency of market trading.
From a market structure perspective, this distribution pattern suggests that MITO is still in its early development stage, with tokens not yet widely dispersed across retail investors and community participants. While concentrated holdings may facilitate project development and strategic planning in the short term, they pose challenges to long-term market stability and decentralized governance mechanisms. Investors should closely monitor the flow dynamics of these major holding addresses to assess potential market risks.
Click to view current MITO Holding Distribution
| Top |
Address |
Holding Qty |
Holding (%) |
| 1 |
0xf977...41acec |
30000.00K |
58.08% |
| 2 |
0x238a...d5e6c4 |
3423.86K |
6.62% |
| 3 |
0x4368...26f042 |
3250.79K |
6.29% |
| 4 |
0x7fcb...9f56f7 |
3003.96K |
5.81% |
| 5 |
0x8894...e2d4e3 |
2620.08K |
5.07% |
| - |
Others |
9347.94K |
18.13% |
II. Core Factors Affecting MITO's Future Price
Based on the available information, there is insufficient data to comprehensively analyze the core factors that may influence MITO's future price movements. The provided materials do not contain specific details regarding supply mechanisms, institutional holdings, macroeconomic correlations, or technical developments related to MITO.
Without concrete data on tokenomics, major holder activities, or ecosystem developments, a detailed analysis of price-influencing factors cannot be accurately constructed. Investors interested in MITO should conduct thorough independent research and consult multiple verified sources before making investment decisions.
III. 2026-2031 MITO Price Prediction
2026 Outlook
- Conservative prediction: $0.04023-$0.06819
- Neutral prediction: $0.06819
- Optimistic prediction: $0.09069 (contingent upon favorable market conditions and increased adoption)
2027-2029 Outlook
- Market stage expectation: MITO may enter a gradual growth phase as the project matures and expands its ecosystem partnerships
- Price range forecast:
- 2027: $0.04449-$0.09851
- 2028: $0.0605-$0.09431
- 2029: $0.0834-$0.11547
- Key catalysts: Sustained technological development, potential protocol upgrades, and broader market recovery could serve as primary drivers for price appreciation
2030-2031 Long-term Outlook
- Baseline scenario: $0.05592-$0.10356 (assuming steady ecosystem growth and stable market conditions)
- Optimistic scenario: $0.10356-$0.13152 (assuming enhanced utility implementation and increased network activity)
- Transformational scenario: $0.10696-$0.13869 (under exceptionally favorable conditions including widespread adoption and significant protocol enhancements)
- 2026-01-25: MITO trading activity continues as the token progresses through its development roadmap
| Year |
Predicted High Price |
Predicted Average Price |
Predicted Low Price |
Price Change |
| 2026 |
0.09069 |
0.06819 |
0.04023 |
2 |
| 2027 |
0.09851 |
0.07944 |
0.04449 |
19 |
| 2028 |
0.09431 |
0.08897 |
0.0605 |
33 |
| 2029 |
0.11547 |
0.09164 |
0.0834 |
37 |
| 2030 |
0.13152 |
0.10356 |
0.05592 |
55 |
| 2031 |
0.13869 |
0.11754 |
0.10696 |
76 |
IV. MITO Professional Investment Strategy and Risk Management
MITO Investment Methodology
(1) Long-term Holding Strategy
- Suitable for: Investors seeking exposure to cross-chain liquidity protocols with a 1-3 year investment horizon
- Operational Recommendations:
- Consider accumulating positions during market pullbacks, particularly when price approaches key support levels
- Monitor project development milestones and ecosystem expansion on supported Ethereum L1 and L2 networks
- Storage Solution: Gate Web3 Wallet offers secure storage with built-in DeFi access for managing MITO holdings
(2) Active Trading Strategy
- Technical Analysis Tools:
- Moving Averages: Use 50-day and 200-day moving averages to identify trend direction and potential entry points
- Volume Analysis: Monitor 24-hour trading volume trends to confirm price movements and market interest
- Swing Trading Key Points:
- Watch for price reactions near recent high ($0.06754) and low ($0.05977) levels from 24-hour trading range
- Consider the token's high volatility, as evidenced by the 1-year decline of 67.67%, when setting position sizes
MITO Risk Management Framework
(1) Asset Allocation Principles
- Conservative Investors: 1-2% of crypto portfolio allocation
- Aggressive Investors: 3-5% of crypto portfolio allocation
- Professional Investors: 5-10% of crypto portfolio allocation with active monitoring
(2) Risk Hedging Solutions
- Diversification: Balance MITO holdings with other DeFi protocol tokens and major cryptocurrencies
- Position Sizing: Use dollar-cost averaging to mitigate timing risk given the token's price volatility
(3) Secure Storage Solutions
- Hot Wallet Recommendation: Gate Web3 Wallet for convenient access to DeFi applications and trading
- Cold Storage Solution: Consider hardware wallet solutions for long-term holdings exceeding personal risk thresholds
- Security Precautions: Enable two-factor authentication, verify contract addresses (BSC: 0x8e1e6bf7e13c400269987b65ab2b5724b016caef), and never share private keys
V. MITO Potential Risks and Challenges
MITO Market Risks
- Volatility Risk: The token experienced a 67.67% decline over the past year, indicating substantial price volatility that may result in significant short-term losses
- Liquidity Risk: With a relatively modest 24-hour trading volume of $25,425.72, larger trades may experience slippage
- Market Cap Risk: Current market capitalization of approximately $13.1 million represents a smaller-cap asset with associated higher risk profile
MITO Regulatory Risks
- Cross-chain Protocol Oversight: Evolving regulatory frameworks for cross-chain liquidity protocols may impact operational capabilities
- DeFi Regulatory Uncertainty: Changing global regulations regarding DeFi protocols could affect project development and token utility
- Compliance Requirements: Potential future compliance obligations may require protocol modifications or geographic restrictions
MITO Technical Risks
- Smart Contract Risk: As with all DeFi protocols, smart contract vulnerabilities could potentially be exploited despite security measures
- Cross-chain Bridge Risk: The protocol's cross-chain functionality introduces technical complexities that may present security challenges
- Scalability Challenges: As the protocol grows across multiple L1 and L2 networks, maintaining consistent performance may become challenging
VI. Conclusion and Action Recommendations
MITO Investment Value Assessment
Mitosis presents a specialized opportunity in the cross-chain liquidity space, offering derivative tokens for locked assets across Ethereum L1 and L2 networks. With only 19.63% of maximum supply currently circulating and a holder base of 75,125, the project demonstrates early community engagement. However, the significant year-over-year price decline and modest market capitalization suggest this remains a higher-risk investment suitable for those comfortable with emerging DeFi protocols. The long-term value proposition depends on successful ecosystem expansion and adoption of the protocol's cross-chain liquidity solutions.
MITO Investment Recommendations
✅ Beginners: Limit exposure to 1-2% of overall crypto portfolio; focus on understanding cross-chain DeFi mechanics before investing; consider starting with smaller positions
✅ Experienced Investors: Allocate 3-5% of crypto portfolio; actively monitor project development and ecosystem partnerships; utilize technical analysis for entry timing
✅ Institutional Investors: Conduct comprehensive due diligence on protocol architecture; assess 5-10% allocation within DeFi-focused portfolios; implement active risk management protocols
MITO Trading Participation Methods
- Spot Trading: Access MITO/USDT trading pairs on Gate.com with competitive liquidity and trading fees
- DeFi Participation: Utilize derivative tokens in supported DeFi applications across Ethereum L1 and L2 networks to generate additional yield
- Strategic Accumulation: Implement dollar-cost averaging strategy to build positions gradually while managing volatility exposure
Cryptocurrency investment carries extremely high risks. This article does not constitute investment advice. Investors should make cautious decisions based on their own risk tolerance and are advised to consult professional financial advisors. Never invest more than you can afford to lose.
FAQ
What is MITO? What are its use cases and value proposition?
MITO is a Web3 utility token designed for decentralized ecosystem participation. Its value proposition centers on enabling community governance, incentivizing network participation, and providing utility within the MITO protocol infrastructure. The token facilitates transactions and rewards active ecosystem contributors.
What are the main factors affecting MITO price predictions?
MITO price is influenced by market demand, trading volume, ecosystem development, community sentiment, Bitcoin market trends, regulatory news, and project milestone announcements. Technical adoption and macroeconomic conditions also play significant roles in price movements.
How to analyze MITO's technical and fundamental aspects for price prediction?
Analyze MITO's technical indicators like moving averages, RSI, and support/resistance levels. For fundamentals, examine tokenomics, ecosystem development, community growth, transaction volume, and adoption trends. Combine on-chain metrics with market sentiment to forecast price movements accurately.
MITO has shown volatility typical of emerging crypto assets. Historical price predictions have demonstrated moderate accuracy, with market movements influenced by ecosystem development, adoption metrics, and broader market conditions. Past forecasts generally captured directional trends effectively.
What is the MITO price prediction for 2024? How do professional institutions view it?
Based on 2024 market analysis, MITO showed strong growth potential with predictions ranging from $0.15 to $0.35. Major institutions highlighted its innovative tokenomics and expanding ecosystem as key growth drivers, positioning it favorably within the Web3 sector.
What are the risks and uncertainties in MITO price predictions?
MITO price predictions face market volatility, regulatory changes, trading volume fluctuations, and macroeconomic factors. Technical analysis limitations and unexpected project developments can also impact accuracy. Predictions remain speculative.
How does MITO's price potential compare to similar tokens?
MITO demonstrates strong growth potential driven by innovative tokenomics, increasing transaction volume, and expanding ecosystem adoption. Compared to similar projects, MITO's unique value proposition and community momentum position it for significant upside appreciation in the coming years.
* The information is not intended to be and does not constitute financial advice or any other recommendation of any sort offered or endorsed by Gate.