This comprehensive article provides expert analysis of MITO (Mitosis), an innovative cross-chain liquidity protocol, currently trading at $0.0652 with a $12.79M market cap. The guide examines MITO's historical price performance since its January 2025 launch, including the significant decline from its $0.45 peak, and delivers detailed price forecasts spanning 2026-2031 with conservative, neutral, and optimistic scenarios. Key sections cover market sentiment analysis revealing extreme fear conditions, holding distribution showing whale concentration risks, and core investment strategies for different investor profiles. The article addresses technical risks, regulatory challenges, and liquidity concerns while offering practical guidance for spot trading on Gate and secure custody via Gate Web3 Wallet. Investors receive actionable recommendations on position sizing, dollar-cost averaging, and risk management frameworks tailored to their experience level.
Introduction: MITO's Market Position and Investment Value
Mitosis (MITO), positioned as a liquidity protocol for the modular era redefining cross-chain liquidity, has been making strides in the DeFi ecosystem since its launch in 2025. As of January 2026, MITO has achieved a market capitalization of approximately $12.79 million, with a circulating supply of around 196.27 million tokens, and the price hovering around $0.0652. This asset, recognized as an innovative solution for cross-chain liquidity provision, is playing an increasingly important role in decentralized finance applications across Ethereum L1 and L2 rollups.
MITO's unique value proposition lies in its approach to making cross-chain liquidity provision more attractive through derivative tokens that maintain 1:1 convertibility with locked assets. This mechanism enables liquidity providers to participate in various DeFi applications while earning additional yields on top of default fee sharing. With a fully diluted market cap of $65.16 million and a circulating ratio of approximately 19.63%, the token demonstrates significant growth potential within its sector.
This article will comprehensively analyze MITO's price trends from 2026 to 2031, combining historical patterns, market supply and demand dynamics, ecosystem development, and macroeconomic environments to provide investors with professional price forecasts and practical investment strategies. As the cross-chain liquidity landscape continues to evolve, understanding MITO's positioning within the modular blockchain infrastructure becomes essential for making informed investment decisions.
I. MITO Price History Review and Market Status
MITO Historical Price Evolution Trajectory
- 2025: Token launched in January, price reached 0.45 on September 14
- 2025: Market correction phase, price declined to 0.05 on October 10
- 2025-2026: Consolidation period, price fluctuated within a range
MITO Current Market Situation
As of January 25, 2026, MITO is trading at 0.06516, representing a 6.25% increase over the past 24 hours. The trading volume stands at 27,633.26 over the same period. Within the last day, the token has fluctuated between a low of 0.06094 and a high of 0.0691.
From a weekly perspective, MITO has experienced a 13.5% decline over the past 7 days, while the 30-day performance shows a 3.40% decrease. The circulating supply represents 19.63% of the total supply, with 196,273,082 MITO tokens in circulation out of a maximum supply of 1,000,000,000 tokens.
The current market capitalization is approximately 12.79 million, while the fully diluted valuation stands at 65.16 million. MITO maintains a market dominance of 0.0020% and is listed on 18 exchanges, with a holder count of 75,114.
Click to view the current MITO market price

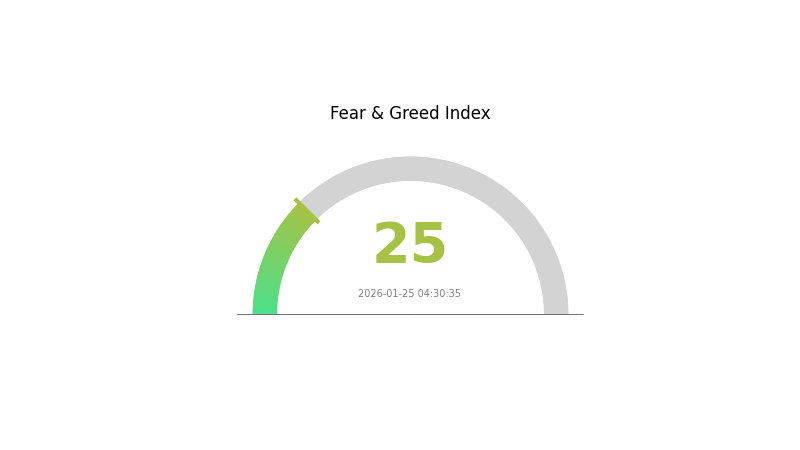
MITO Market Sentiment Indicator
2026-01-25 Fear and Greed Index: 25(Extreme Fear)
Click to view current Fear & Greed Index
The cryptocurrency market is currently experiencing extreme fear, with the Fear and Greed Index at 25. This indicates significant investor pessimism and risk aversion in the market. During such periods, market volatility tends to increase, and asset prices may experience notable fluctuations. For traders, extreme fear can present both challenges and opportunities—while downside risks persist, historically, such extreme readings have sometimes preceded market rebounds. It is advisable to maintain a cautious stance, manage risk carefully, and avoid making impulsive decisions driven by emotions.
MITO Holding Distribution
According to the on-chain holding distribution data, MITO currently exhibits a highly concentrated ownership structure. The top holder controls approximately 30 million tokens, accounting for 58.08% of the total supply, demonstrating significant centralization. The subsequent four major addresses collectively hold 12.3 million tokens (23.79% of total supply), while the remaining addresses only account for 18.13%. This distribution pattern indicates that over 80% of MITO tokens are concentrated in the hands of the top five addresses, reflecting a typical whale-dominated market structure.
Such extreme concentration presents multiple market implications. First, the high concentration ratio suggests that price movements may be heavily influenced by the actions of a few major holders, potentially increasing short-term volatility risks. When large holders execute buy or sell orders, the market depth may be insufficient to absorb such transactions, leading to sharp price fluctuations. Second, this distribution structure may affect token liquidity, as a significant portion of tokens are locked in a small number of addresses, reducing the actual circulating supply available for market trading.
From a decentralization perspective, MITO's current holding distribution deviates from the ideal decentralized token model. While concentrated holdings do not necessarily indicate malicious intent, such a structure theoretically provides major holders with significant market influence capabilities. Investors should pay close attention to the on-chain transfer activities of these top addresses to assess potential market risks and maintain appropriate risk management strategies.
Click to view current MITO Holding Distribution
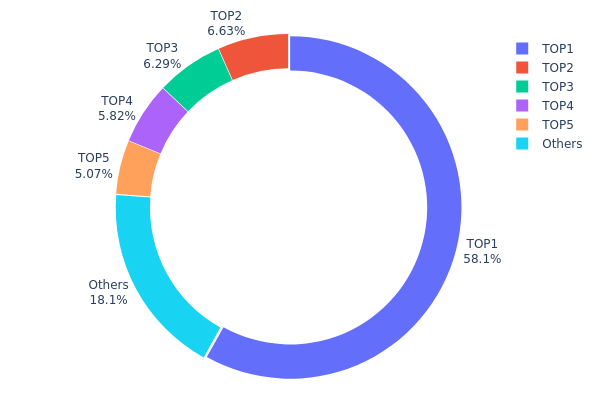
| Top |
Address |
Holding Qty |
Holding (%) |
| 1 |
0xf977...41acec |
30000.00K |
58.08% |
| 2 |
0x238a...d5e6c4 |
3423.86K |
6.62% |
| 3 |
0x4368...26f042 |
3250.79K |
6.29% |
| 4 |
0x7fcb...9f56f7 |
3003.96K |
5.81% |
| 5 |
0x8894...e2d4e3 |
2620.08K |
5.07% |
| - |
Others |
9347.94K |
18.13% |
II. Core Factors Affecting MITO's Future Price
Based on the available materials, there is currently insufficient data to provide a comprehensive analysis of the core factors that may influence MITO's future price movements. A thorough evaluation would require detailed information about supply mechanisms, institutional holdings, macroeconomic correlations, and technical developments specific to this token.
Investors interested in MITO should conduct independent research and monitor official project channels for updates on tokenomics, partnerships, and development roadmaps that could impact price dynamics.
III. 2026-2031 MITO Price Forecast
2026 Outlook
- Conservative estimate: $0.04439 - $0.06626
- Neutral estimate: $0.06626
- Optimistic estimate: $0.08746 (contingent on favorable market conditions)
2027-2029 Mid-term Outlook
- Market stage expectations: MITO is anticipated to enter a phase of gradual growth, with potential price appreciation driven by broader market dynamics and ecosystem developments
- Price range forecast:
- 2027: $0.04381 - $0.08532
- 2028: $0.05028 - $0.08920
- 2029: $0.06130 - $0.10387
- Key catalysts: Market maturity, technological improvements, and increased adoption could serve as primary drivers for price movement during this period
2030-2031 Long-term Outlook
- Baseline scenario: $0.05482 - $0.10302 (assuming stable market conditions and moderate growth)
- Optimistic scenario: $0.08098 - $0.13333 (assuming enhanced utility, expanded partnerships, and favorable regulatory environment)
- Transformative scenario: Above $0.13333 (contingent on widespread adoption, significant ecosystem breakthroughs, and exceptional market conditions)
| Year |
Predicted High Price |
Predicted Average Price |
Predicted Low Price |
Price Change |
| 2026 |
0.08746 |
0.06626 |
0.04439 |
1 |
| 2027 |
0.08532 |
0.07686 |
0.04381 |
17 |
| 2028 |
0.0892 |
0.08109 |
0.05028 |
24 |
| 2029 |
0.10387 |
0.08514 |
0.0613 |
30 |
| 2030 |
0.10302 |
0.09451 |
0.05482 |
45 |
| 2031 |
0.13333 |
0.09876 |
0.08098 |
51 |
IV. MITO Professional Investment Strategies and Risk Management
MITO Investment Methodology
(I) Long-term Holding Strategy
- Suitable for: Investors seeking exposure to cross-chain liquidity protocols and modular blockchain infrastructure
- Operational Recommendations:
- Consider accumulating positions during periods of market consolidation, as MITO has shown volatility with a 13.5% decline over 7 days
- Monitor the protocol's adoption metrics and integration with L1 and L2 rollups to assess long-term viability
- Storage Solution: Utilize Gate Web3 Wallet for secure self-custody, supporting BSC (BEP-20) standard where MITO is deployed
(II) Active Trading Strategy
- Technical Analysis Tools:
- Moving Averages: Track 7-day and 30-day trends; current 7D (-13.5%) and 30D (-3.40%) indicate recent downward pressure
- Volume Analysis: Monitor 24-hour trading volume ($27,633) relative to market cap ($12.79M) to identify liquidity patterns
- Trading Considerations:
- Short-term volatility observed with 24H range between $0.06094 and $0.0691
- Position sizing should account for the token's relatively low market cap and limited exchange availability (18 exchanges)
MITO Risk Management Framework
(I) Asset Allocation Principles
- Conservative Investors: 1-2% of crypto portfolio allocation
- Moderate Investors: 3-5% of crypto portfolio allocation
- Experienced Investors: Up to 10% with active monitoring
(II) Risk Mitigation Approaches
- Diversification Strategy: Limit MITO exposure relative to total portfolio, given its single-protocol concentration risk
- Gradual Position Building: Consider dollar-cost averaging to reduce timing risk in volatile market conditions
(III) Secure Storage Solutions
- Hot Wallet Recommendation: Gate Web3 Wallet for convenient access to DeFi applications on BSC
- Cold Storage Option: Hardware wallet solutions for long-term holdings exceeding $1,000
- Security Considerations: Verify contract address (0x8e1e6bf7e13c400269987b65ab2b5724b016caef on BSC) before transactions; enable two-factor authentication on all platforms
V. MITO Potential Risks and Challenges
MITO Market Risks
- Price Volatility: MITO has experienced significant decline of 68.19% from its all-time high of $0.45 (September 2025), indicating substantial downside historical precedent
- Liquidity Concerns: With 24-hour trading volume of approximately $27,600 against a market cap of $12.79M, liquidity may be limited during periods of market stress
- Low Circulation Ratio: Only 19.63% of total supply is currently circulating, creating potential for supply-side pressure if additional tokens enter the market
MITO Regulatory Risks
- Cross-chain Protocol Scrutiny: DeFi protocols facilitating cross-chain liquidity may face evolving regulatory frameworks in multiple jurisdictions
- Derivative Token Classification: The protocol's derivative tokens representing locked assets may attract attention from securities regulators in various regions
- Compliance Evolution: As regulatory clarity develops for cross-chain liquidity protocols, operational adjustments may be required
MITO Technical Risks
- Smart Contract Vulnerabilities: Cross-chain protocols involve complex smart contract interactions that may contain undiscovered vulnerabilities
- Bridge Security Dependencies: The protocol's functionality relies on cross-chain bridge infrastructure, which has historically been a target for exploits in the broader crypto ecosystem
- Integration Complexity: Participation in multiple L1 and L2 rollup ecosystems introduces technical dependencies and potential points of failure
VI. Conclusion and Action Recommendations
MITO Investment Value Assessment
Mitosis presents an innovative approach to cross-chain liquidity through derivative tokens that unlock capital efficiency for liquidity providers. The protocol addresses a genuine need in the modular blockchain ecosystem by enabling LPs to utilize their locked assets across multiple DeFi applications. However, the token has experienced significant price decline (68.19% from ATH) and maintains a relatively small market cap ($12.79M) with limited circulation (19.63%), indicating early-stage development and associated volatility. The protocol's success depends on adoption across supported chains and the broader growth of modular blockchain infrastructure.
MITO Investment Recommendations
✅ Beginners: Allocate no more than 1-2% of crypto portfolio; prioritize education on cross-chain protocols before investing; use Gate Web3 Wallet for secure custody
✅ Experienced Investors: Consider 3-5% allocation with active monitoring of protocol development and on-chain metrics; implement position sizing strategies to manage volatility
✅ Institutional Investors: Conduct thorough due diligence on smart contract audits and team credentials; assess protocol's competitive positioning within cross-chain liquidity landscape
MITO Trading Participation Methods
- Spot Trading: Available on Gate.com and 17 other exchanges; verify platform security and liquidity before trading
- DeFi Integration: Utilize MITO derivative tokens in supported DeFi applications on Ethereum L1 and L2 rollups to maximize capital efficiency
- Portfolio Management: Store assets in Gate Web3 Wallet (BSC network) with proper security measures including backup of recovery phrases
Cryptocurrency investments carry extremely high risks, and this article does not constitute investment advice. Investors should make cautious decisions based on their own risk tolerance and are advised to consult professional financial advisors. Never invest more than you can afford to lose.
FAQ
What is the historical price trend of MITO? Are there any obvious price fluctuation patterns in the past?
MITO has experienced significant volatility since launch, with notable rallies during bull market phases and corrections during consolidation periods. Price movements typically correlate with overall market sentiment and protocol developments. Early holders witnessed substantial gains during initial adoption phases, with periodic pullbacks offering entry opportunities for new investors.
What are the main factors affecting MITO price? How do market sentiment, technical analysis, and fundamentals each impact it?
MITO price is driven by market sentiment reflecting investor confidence, technical factors including trading volume and price levels, and fundamentals like project development and adoption. Bullish sentiment and strong fundamentals typically drive price appreciation.
Analyze MITO using technical analysis (candlestick patterns, moving averages), fundamental analysis (tokenomics, adoption rate), and market sentiment indicators. Monitor trading volume, on-chain metrics, and compare with similar projects for comprehensive price prediction insights.
What risks exist in MITO price predictions? How should I view price predictions rationally?
Price predictions depend on market sentiment, trading volume, and tokenomics. View predictions as reference tools, not guarantees. Market volatility, regulatory changes, and adoption rates significantly impact actual prices. Combine multiple analyses and maintain realistic expectations for informed decision-making.
How is the price correlation between MITO and mainstream cryptocurrencies like BTC and ETH?
MITO shows moderate positive correlation with BTC and ETH, typically moving 0.6-0.8 correlation coefficient. During market rallies, MITO tends to outperform, while in downturns it demonstrates relative resilience due to its utility-driven ecosystem and independent development trajectory.
* The information is not intended to be and does not constitute financial advice or any other recommendation of any sort offered or endorsed by Gate.